Original Articles
Is Cystatin C a promising marker of renal function, at birth, in
neonates prenatally diagnosed with congenital kidney anomalies?
Paloma Parvex
1, Christophe Combescure
2, Maria Rodriguez
3and Eric Girardin
11
Pediatric Nephrology Unit, Department of Pediatry, Geneva University Hospital, Geneva, Switzerland,2Department of Clinical Epidemiology, Geneva University Hospital, Geneva, Switzerland and3Pediatric Research Platform, Department of Pediatry,
Geneva University Hospital, Geneva, Switzerland
Correspondence and offprint requests to: Paloma Parvex; E-mail: [email protected]
Abstract
Background. Despite the increased prenatal diagnosis of congenital abnormalities of the kidney and urinary tract (CAKUT), no reliable renal marker for glomerular filtration rate (GFR) has been validated yet in neonates. Cystatin C (CysC) is specific to the neonate and is pro-posed as a sensitive marker for this population. The aims of the study were first to define a reference interval in our center of CysC at birth in normal term babies and assess CysC as a marker of GFR in a group of term neo-nates prenatally diagnosed with CAKUT compared to controls.
Methods. One hundred normal term neonates (control group) and 33 neonates with kidney malformation (KM) had the CysC levels in their cord blood measured. A re-ference interval for CysC in controls was calculated using non-parametric methods. CysC from controls was comparedfirst to the whole group of neonates with KM, then with KM group divided in infants (n = 20) with uni-lateral kidney malformation (UKM) and those (n = 13) with bilateral kidney malformation (BKM). A multivari-able analysis was performed to assess the difference in CysC between the groups with adjustment on other factors.The ability of CysC to discriminate neonates with BKM from the controls was assessed by a non-para-metric receiver-operated characteristics (ROC) curve. Results. In the control group, the CysC reference inter-val was [1.54–2.64] mg/L with a median (M) CysC of 2.02 IQR [1.86–2.23]. In the neonates with KM, M CysC was 1.98 IQR [1.79–2.34]; 1.88 IQR [1.76–2.01] in the UKM group and 2.52 IQR [2.16–2.71] in BKM group. Using a multivariate regression analyses, CysC was significantly increased (P < 0.001) in BKM com-pared to controls with an increment of CysC of 24.5%, and independent from gender, weight and size. The ROC curve analyses, comparing BKM versus controls with a chosen cut-off for CysC of 2.34, showed a sensitivity of 69% and a specificity of 86%.
Conclusions. Comparing CysC with a reference interval of CysC validated in our center, we showed a significant
increase of CysC in neonates presenting BKM compared to controls and those with UKM.
Keywords: congenital kidney diseases; cystatin C; neonates; reference interval; renal marker
Introduction
The assessment of renal function in neonates at birth may be particularly helpful in case of severe congenital anomalies of the kidney and urinary tract diagnosed during the prenatal period, not only to identify neonates at risk to present an abnormal decrease in glomerular fil-tration rate (GFR) but also to optimize nephrotoxic drugs, electrolytes andfluids prescriptions in critical situations.
For this population, no accurate renal marker is vali-dated because the correlation with a gold standard as clearances implies serial blood samples and timed col-lected urine, which is challenging in neonates.
Even if plasma creatinine is widely used to evaluate renal function in children and adults, its measurement is not specific for the baby at birth since creatinine crosses the placenta and is influenced by the mother’s value for the 2–3 weeks after birth [1–3]. Cystatin C (CysC) does not cross the placenta [4,5] and is proposed as a potential renal marker for the neonatal period. CysC is a 13 600 Da protein synthesized by a house-keeping gene in all nu-cleated cells, which means that its amount in the blood is constant [6,7]. In addition, 99% of CysC is freelyfiltered through the glomerular membrane without significant peritubular uptake and then completely reabsorbed and degraded by the proximal tubule. Therefore, urine content of CysC is negligible and it is not a good candidate for a urine renal marker [8,9]. Numerous studies showed that CysC is independent of gender, age and muscle mass, this being of particular importance in a paediatric population [10–12]. CysC can be easily drawn at birth on cord blood and may provide a rapidly available measure of neonatal renal function.
© The Author 2012. Published by Oxford University Press on behalf of ERA-EDTA. All rights reserved. For Permissions, please e-mail: [email protected]
Nephrol Dial Transplant (2012) 27: 3477–3482 doi: 10.1093/ndt/gfs051
The aims of this study werefirst to validate a reference interval for CysC in our centre in a large population of normal term babies without any anomalies detected on prenatal ultrasound and compare our reference interval for Cystatin C with those published in the literature [5, 10, 11,13–15]. Thereafter, we aimed to assess the validity of CysC levels at birth in neonates prenatally diagnosed with kidney malformations (KMs), and finally to compare the Cystatin C values in this group with the control group of normal term neonates.
Materials and methods
The protocol (CER 05-111) of this study was approved by the Ethical committee of Geneva University.
Patients
Since 2008, in the University Maternity of Geneva, term neonates without any anomalies detected on prenatal ultrasound (n = 100) and term neonates (n = 33) prenatally diagnosed with kidney anomalies were included prospectively in the study. In case of kidney dilatation, we con-sidered for inclusion a measured anterior-posterior diameter of≥10 mm during the third trimester of pregnancy. The repartition of the kidneys’ anomalies is described in Table1.
We recruited the patients during the regular second (26 weeks) or third (32 weeks) prenatal visit. During this visit, we obtained written consent to measure CysC by drawing sample on cord blood in the neo-nates at birth. In the group of normal neoneo-nates, babies from mothers pre-senting complications during pregnancy as diabetes, hypertension and infection or on medication during pregnancy were not included. Cystatin C analyses
CysC was measured by particle-enhanced nephelometric immunoassay (PENIA) on Image®-Beckman analyzer. The assay used for the reaction is from DakoCytomation. The samples were analysed within 4 h of being drawn. Samples did not require dilution and results were available within a few minutes. Only 2 mL of cord blood was required for this analysis. The coefficient of variation (CV) for CysC (inter-assay pre-cision) was 4.95% at 1.13 mg/L and 3.30% at 4.91 mg/L (n = 130). The CV (intra-assay precision) was 2.0% at 1.71 mg/L and 2.3% at 5.37 mg/ L (n = 80). Total measurement uncertainty was 0.097 mg/L at 1.14 mg/L. Statistical analyses
The distribution of CysC in controls was described by median and inter-quartile range (IQR) (mg/L). The CysC was log-transformed to fulfil the assumption of a Gaussian distribution. It was tested using a Shapiro– Wilk’s test. The reference interval (percentiles 2.5 and 97.5%) of the logarithm of the CysC was assessed by using the non-parametric central 95% confidence interval method and by a robust method following the Clinical and Laboratory Standards Institute guidelines (CLSI C28-A3) and back-transformed in the natural scale of the CysC. The confidence interval of the estimates of CysC reference interval was obtained by bootstrap (re-sampling 100 00 times). To check the robustness of the es-timate reference interval for the characteristics of the subjects, it was
assessed in subgroups according to gender, weight and size by using the robust method.
Characteristics of controls and patients with KM were described ( per-centage or median and IQR) and compared by using a chi-square test (or a Fisher exact test if some frequencies were <5) and a Mann–Whitney test. The distribution of the CysC was represented in the groups by box-plots. The patients with KMs werefirst analysed as the entire group and compared to controls, then divided in two groups: patients presenting unilateral KM (UKM) and those with bilateral KM (BKM).
A univariate analysis was performed to test the association between the CysC value and gender, weight, size, gestational age (GA) and the different patient groups (controls, unilateral and bilateral malformation).
A multivariate analysis (linear regression) was also performed to assess the difference in CysC between the groups with adjustment on the potential confounders (gender, weight and size were significant in the univariate analysis). For this later analysis, the CysC measure was log-transformed to have a Gaussian distribution. The association between a factor and CysC (assessed by the regression parameter) was expressed as a percentage of a variation of the CysC.
The ability of the CysC to discriminate the controls and the patients with a bilateral malformation was assessed by a non-parametric receiver-operated characteristics (ROC) curve. The area under the ROC curve and its 95% confidence interval are reported. The sensitivity and the speci-ficity were calculated for several cut-off with the 95% confidence inter-vals obtained by the Clopper–Pearson’s method.
P-values were considered significant if <0.05. The statistical analyses were performed with S-Plus 8.0 (Insightful Corp., Seattle, WA) and SPSS 15.0 for Windows (SPSS Inc., Chicago, IL).
Results
CysC reference interval
We obtained CysC values in 100 term babies. Fifty-six were girls (56%). The median for weight was 3.50 kg IQR [3.23–3.79], for size 51 cm IQR [50–53] and for GA 40 weeks IQR [40–41].
Median cord blood CysC in normal term babies was 2.02 mg/L IQR [1.86–2.23].
The assumption of a Gaussian distribution was rejected for CysC (P = 0.02) but was adequate for the logarithm of CysC (P = 0.25). By using the non-parametric central 95% confidence interval method, the reference interval was [1.61–2.70]. The 95% confidence interval for the as-sessed low normal value was [1.47–1.67] and [2.52–2.71] for the high value.
By using the robust method, the reference interval was [1.54–2.64]. The 95% confidence interval for the assessed low normal value was [1.47–1.61] and [2.51–2.78] for the high value. The results from both methods were similar.
When the reference intervals were assessed in sub-groups according to gender, weight and size, the lower normal value ranged from 1.49 to 1.63 and the upper normal value from 2.49 to 2.63.
CysC in neonates with KM
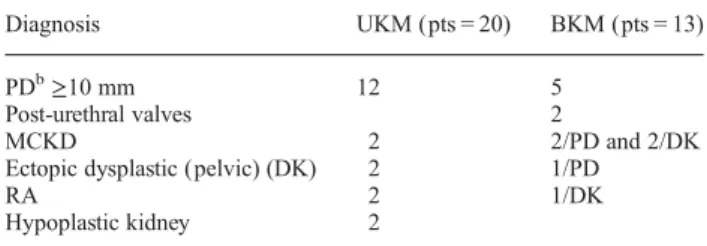
Among the 33 babies (22 boys; 11girls) with KM, 20 had UKM and 13 had BKM. Neonates with UKM had the fol-lowing diagnosis: 12 renal pelvic dilatation ≥10 mm, 2 multicystic kidney disease (MCKD), 2 pelvic dysplastic kidneys, 2 renal agenesis and 2 hypoplastic kidneys. Among the neonates with BKM, five patients (pts) pre-sented with bilateral renal pelvic dilatation ≥10 mm, two pts with post-urethral valves, two pelvic dilatation ≥10 mm/MCKD, one ectopic dysplastic kidney/MCKD, one
Table 1. Details of the different patient’s congenital kidneys anomaliesa
Diagnosis UKM (pts = 20) BKM (pts = 13)
PDb≥10 mm 12 5
Post-urethral valves 2
MCKD 2 2/PD and 2/DK
Ectopic dysplastic (pelvic) (DK) 2 1/PD
RA 2 1/DK
Hypoplastic kidney 2
a
DK, dysplastic kidney; PD, pelvic dilatation; RA, renal agenesis; pts, patients.
pelvic dilatation ≥10 mm/ectopic dysplastic kidney, one MCKD/dysplastic kidney (TCF2 mutation) and one patient renal agenesis/ectopic dysplastic kidney (Table1).
The control group and the KM group were different in weight (P < 0.001) and size (P < 0.003) (Table2), justifying a multivariate analysis with adjustment on these factors (Table3).
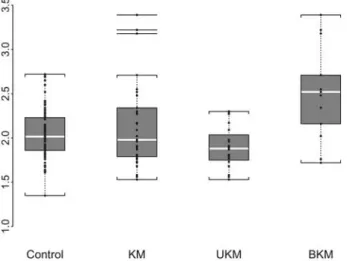
CysC in the KM group was not statistically different from the control group (P = 0.83). The distribution of Cy-statin C values of each group is illustrated in the box-plot (Figure1). The median CysC in each group was: 1.98 IQR [1.79–2.34] in the KM group, 1.88 IQR [1.76–2.01] in the UKM group and 2.52 IQR [2.16–2.71] in the BKM group. The univariate analysis (not shown) yielded similar results than the multivariate analyses reported in Table3. In the multivariate analyses, we confirmed that CysC was not influenced by gender and weight. Compared to con-trols, CysC in the BKM group was significantly increased (P < 0.001) with an augmentation of 24.5%. The UKM group had lower values of CysC (P = 0.007) but the de-crease was weak (6.9%).
The ROC curves, analysing BKM versus control, showed a cut-off for CysC of 2.16, a sensitivity of 76.9% [46.2; 95.0] and a specificity of 73.0% [63.2; 81.4]; with a value of 2.34, a sensitivity of 69.2% [38.6; 90.9] and a specificity of 86.0% [77.6; 92.1] and with 2.48, a sensi-tivity 61.5% [31.6; 86.1] and a specificity of 92.0% [84.8; 96.5] (Figure2).
Discussion
Because congenital kidney anomalies represent 30% of total anomalies diagnosed prenatally [16], the revelation during pregnancy by ultrasound of a kidney anomaly has become a frequent reason for nephrology prenatal counsel-ling. This increase is due principally to technical advances and a better follow-up of pregnancies. Consequently, the need to progress in the determination of a useful renal marker for the neonatal period has become more and more necessary, not only to improve neonatal care but also to inform the parents on long-term prognosis. Assessment of renal function before birth is not accurate and even if the amount of amnioticfluid is widely used, it is a weak indi-cator of neonatal renal function and nowadays, none of the prenatal renal markers proposed have been validated [17– 20]. Bokenkamp et al. proposed that reference values for CysC in fetal serum could be predictors for renal function, and obtained by 129 cordocenteses, values in 84 fetuses. Among these, he defined in a group of 54 fetuses without kidney disease a mean CysC of 1.66 ± 0.202 mg/L and a reference interval using parametric method of [1.26–2.06] mg/L. However, the dosage of serum fetal CysC cannot be performed routinely because of the risk of fetal loss associated with fetal blood puncture [4].
The absence of an accurate prenatal marker highlights the necessity to measure renal function at birth particularly in neonates presenting bilateral kidney anomalies. Creati-nine widely used to assess renal function is not useful at birth to identify neonates susceptible to present renal failure. Guignard et al. [2,3] demonstrated that creatinine
rises during thefirst 48 h of life and this increase was even greater in premature infants. Moreover, creatinine does not reflect the neonates’ value during the first 2 weeks of life [2,3,21,22]. These authors report that the increased crea-tinine immediately after birth is not only secondary to mother transfer in the neonate but also to a temporary in-creased creatinine reabsorption by the kidney attributed to tubular immaturity of the newborn [2].
It is now recognized that CysC is specific for the fetus, implying its use as a potentially valuable renal marker for neonates [4, 5, 13]. Akbari et al. [23] showed the pro-gressive rise of Cystatin C in relation with GA in pregnant women with higher values during the third trimester. Despite this mother’s CysC increases during pregnancy, many authors confirmed the lack of correlation between maternal and fetal CysC [4, 18, 24]. The measure of CysC in urine and amniotic fluid has been tested in fetuses with renal obstruction by different authors without the possibility to establish reference values for CysC in this condition [17,24,25].
CysC reference interval
In the newborn, the validation of a potential renal marker using a gold standard for GFR is complicated by the need of repeated blood samples and the difficulty to obtain ac-curate urine collections.
Because of the difficulty to compare CysC at this age with a recognized gold standard, we validated in our centre a reference interval using the Clinical and Labora-tory Standards Institute (CLSI C28-A3) guidelines and calculate reference interval using the robust method as de-scribed in CLSI guidelines. Two methods are available and recognized for the measurement of CysC; PENIA and particle-enhanced turbidimetric immunoassay (PETIA) [8]. The method used in our centre is PENIA which is reported to be more sensitive than PETIA [8]. We report here CysC values in 100 normal term babies and estab-lished a reference interval for CysC of [1.54–2.64 mg/L] and the median value for CysC was 2.02 mg/L.
The estimation of the confidence interval for normal values was similar using both non-parametric and robust methods and confirmed the robustness of the results ob-tained with these statistical analyses. In our sample, the robustness of the CysC reference interval was checked in the subgroup and showed no clinically meaningful varia-bility of CysC with gender, weight and size. The literature reports reference interval for normal term newborns [5, 10, 13–15,26, 27] and premature [10, 14,21,26,28] at birth. We compared our results with published data avail-able for term babies at birth. Bahar et al. [13], reported lower values than ours, with a mean CysC of 1.36 ± 0.35 mg/L measured by PENIA method, taken from cord blood in 112 newborns. Treiber et al. measured using the same methods (PENIA), CysC cord blood value in 75 newborns and found a cord blood value with a mean CysC value of 1.97 ± 0.36 quite similar to our value of 2.02. Harmoinen et al. analysed 50 full-term infants and proposed a mean CysC value (PETIA) of 1.70 mg/L ± 2.6 SD and a reference interval of CysC in term babies of [1.36–2.23] mg/L. Bokenkamp et al. report a mean CysC
(PETIA) of 2.02 mg/L and a range of 1.64–2.59 mg/L similar to our results. Barician et al. measured CysC on Day 1 and Day 3 in 128 neonates, aged from 24 to ≥36 weeks. In the group of term babies (≥36 weeks) corresponding to our group, 24 neonates had CysC measured on Day 1 and 21 on Day 3; median CysC was 1.84 mg/dL and the reference interval of [1.32–2.63].
Using a regression analysis, the authors showed no sig-nificant correlation between GA and CysC on Day 3, whereas there was a weak, but significant, positive corre-lation on Day 1 (r = 0.275, P = 0.0037); however, they analysed a population with different GA. In our popu-lation, we did not observe a relationship with GA, most likely because our infants had a GA >36 weeks [29].
Numerous studies evaluated the interest of CysC to predict GFR in adult and in older children and found a good correlation with a recognized gold standard [6, 10, 15, 30, 31]. Only a few have studied the correlation of CysC with a gold standard in neonates. This was done by Montini et al. who measured GFR in 20 premature neo-nates (28–34 weeks of gestation) using single-shot inulin clearance where inulin was injected through a central catheter previously inserted for clinical reason. Then the authors compared CysC and creatinine GFR obtained with inulin clearance; infants with a GFR <0.5 mL/min/ 1.73 m2had CysC >2 mg/L and inversely premature with normal clearance >0.5 mL/min/1.73 m2had CysC <2 mg/ L [13]. Different CysC-based formulas to derive GFR from CysC were described but none have been validated yet for neonates [4,31].
CysC in neonates with prenatal diagnosis of KM
To assess the validity of CysC at birth in neonates with congenital renal anomalies, we compared the group pre-senting malformation of the kidneys with the group of
Fig. 1. Box-plot: median (M) and IQR. CysC in the different groups: M CysC in controls was 2.02 IQR [1.86–2.23] mg/L, 1.98 IQR [1.79–2.34] in KM, 1.88 IQR [1.76–2.01] in UKM and 2.52 IQR [2.16–2.71] in BKM.
Fig. 2. ROC-curve BKM versus controls: with a CysC cut-off of 2.34 mg/L, the calculate sensitivity was 69.2% and specificity 86.0%. With a cut-off of 2.48, the calculate sensitivity was 61.5% and specificity 93.3%. Area under curve = 0.777 [0.599–0.955].
Table 2. Descriptive analysis: patients characteristics; median [IQR] for gender, weight and sizea
Control KM UKM BKM P
Gender, N (%)
Girls 56 (56) 11 (33) 7 (35) 4 (30) 0.08
Boys 44 (44) 22 (66) 13 (650) 9 (69)
Weight (kg), median [IQR] 3.50 [3.23–3.79] 3.16 [2.90–3.43] 3.05 [2.86–3.21] 3.39 [3.17–3.57] <0.001
Size (cm), median [IQR] 51 [50–53] 50 [48–51] 50 [48–51] 50 [49–51] 0.003
a
P-value compared three groups: control, UKM and BKM.
Table 3. Multivariate regression analysis on the CysC including gender, size, control group, patients with UKM and BKM as potential predictorsa
Multivariate
Estimates SEb P-value CysC increase (%) Gender Girls Boys 0.039 0.026 0.13 3.8 Weight (per kg) −0.052 0.037 0.16 −2.8 Size (per cm) 0.002 0.009 0.84 −0.5 Group Control UKM −0.103 0.038 0.007 −6.9 BKM 0.178 0.04 <0.001 24.5 a
UKM had a significant decrease of 6.9% (P = 0.007) and BKM a significant increase of 24.5% (P < 0.001).
b
normal term babies. The multivariate analyses confirmed that CysC was not influenced by gender, weight and size and both groups were comparable.
We observed that the median CysC for the entire group of KM was 1.98 mg/L and not statistically different from the control group 2.02 mg/L. When analysing separately neonates presenting UKM or BKM, interestingly, we found in neonates with BKM, a significantly increased mean CysC compared to the control group (P < 0.001) with a CysC increment of 24.5%. In our population, a high level of CysC in neonates with BKM may reflect the low renal endowment in these neonates. In normal term babies, the nephron mass is complete at birth. However, impaired kidney development occurs in neonates with congenital kidney anomalies leading likely to a lower number of ne-phrons at birth and an increased risk to present lower renal function at birth [32–35]. Compensatory mechanisms such as hyperfiltration of the residual nephrons will take place later in these infants leading to a pre-disposition to future hypertension and renal insufficiency [35,36].
Surprisingly, mean CysC in neonates with UKM was significantly lower from the control group. One of the explanations could be the lower weight of the neonates in this group, but the multivariate analyses showed no impact of weight on CysC values. Another reason may be the small sample size of this group (n = 20). We hypoth-esize that this decrease in CysC could be secondary to hyperfiltration of the nephrons of the opposite normal kidney. To analyse this hypothesis, we calculate the length of the kidneys to seek for a possible hypertrophic growth of the normal opposite kidney with sizes reported as z-score for length (results not shown). The difference was not significant, probably biased by the fact that the principal kidney anomaly in this group was pelvic dilated kidney with an increased size.
Finally, we were interested to propose a cut-off CysC value that may be used as an indicator of an increased risk to present reduced renal function at birth; we used ROC curve analyses and compared neonates with BKM versus controls. With a chosen cut-off of 2.34 mg/L, the sensitivity to present a bilateral anomaly was 69% with a high specificity of 86%. This value may discriminate in case of kidney anomalies neonates with lower renal func-tion at birth. However, the sample size was not sufficient to validate this cut-off.
In conclusion, CysC values in neonates presenting a unilateral kidney anomaly were similar to controls whereas CysC was significantly increased in infants pre-senting a bilateral kidney anomaly. Although we are aware that the validity of CysC in neonates will not be complete without a correlation with a gold standard, CysC may be a useful marker, readily available at birth on cord blood in neonates prenatally diagnosed with congenital renal diseases, to identify those susceptible to present de-creased renal function.
Conflict of interest statement. None declared.
(See related article by Filler et al. Cystatin C for the assessment of GFR in neonates with congenital renal anomalies. Nephrol Dial Transplant 2012; 27: 3382–3384.)
References
1. Feldman H, Guignard JP. Plasma creatinine in thefirst month of life. Arch Dis Child 1982; 57: 123–126.
2. Guignard JP, Drukker A. Why do newborn infants have a high plasma creatinine? Pediatrics 1999; 103: e49.
3. Miall LS, Henderson MJ, Turner AJ et al. Plasma creatinine rises dramatically in thefirst 48 hours of life in preterm infants. Pediatrics 1999; 104: e76.
4. Bokenkamp A, Dieterich C, Dressler F et al. Fetal serum concentrations of cystatin C and beta2-microglobulin as predictors of postnatal kidney function. Am J Obstet Gynecol 2001; 185: 468–475.
5. Cataldi L, Mussap M, Bertelli L et al. Cystatin C in healthy women at term pregnancy and in their infant newborns: relationship between maternal and neonatal serum levels and reference values. Am J Peri-natol 1999; 16: 287–295.
6. Filler G, Priem F, Vollmer I et al. Diagnostic sensitivity of serum cystatin for impaired glomerular filtration rate. Pediatr Nephrol 1999; 13: 501–505.
7. Laterza OF, Price CP, Scott MG. Cystatin C: an improved estimator of glomerularfiltration rate? Clin Chem 2002; 48: 699–707. 8. Mussap M, Plebani M. Biochemistry and clinical role of human
cy-statin C. Crit Rev Clin Lab Sci 2004; 41: 467–550.
9. Filler G, Bokenkamp A, Hofmann W et al. Cystatin C as a marker of GFR—history, indications, and future research. Clin Biochem 2005; 38: 1–8.
10. Finney H, Newman DJ, Thakkar H et al. Reference ranges for plasma cystatin C and creatinine measurements in premature infants, neonates, and older children. Arch Dis Child 2000; 82: 71–75. 11. Harmoinen A, Ylinen E, Ala-Houhala M et al. Reference intervals
for cystatin C in pre- and full-term infants and children. Pediatr Nephrol 2000; 15: 105–108.
12. Andersen TB, Eskild-Jensen A, Frokiaer J et al. Measuring glomer-ular filtration rate in children; can cystatin C replace established methods? A review. Pediatr Nephrol 2009; 24: 929–941.
13. Bahar A, Yilmaz Y, Unver S et al. Reference values of umbilical cord and third-day cystatin C levels for determining glomerular fil-tration rates in newborns. J Int Med Res 2003; 31: 231–235. 14. Bokenkamp A, Dieterich C, Schumann G. Pediatric reference values
for cystatin C revisited. Pediatr Nephrol 1999; 13: 367–368. 15. Treiber M, Pecovnik-Balon B, Gorenjak M. Cystatin C versus
creati-nine as a marker of glomerularfiltration rate in the newborn. Wien Klin Wochenschr 2006; 118(Suppl 2): 66–70.
16. Sanna-Cherchi S, Ravani P, Corbani V et al. Renal outcome in patients with congenital anomalies of the kidney and urinary tract. Kidney Int 2009; 76: 528–533.
17. Mussap M, Fanos V, Pizzini C et al. Predictive value of amniotic fluid cystatin C levels for the early identification of fetuses with ob-structive uropathies. BJOG 2002; 109: 778–783.
18. Muller F, Dreux S, Audibert F et al. Fetal serum ss2-microglobulin and cystatin C in the prediction of post-natal renal function in bilat-eral hypoplasia and hyperechogenic enlarged kidneys. Prenat Diagn 2004; 24: 327–332.
19. Dommergues M, Muller F, Ngo S et al. Fetal serum beta2-microglo-bulin predicts postnatal renal function in bilateral uropathies. Kidney Int 2000; 58: 312–316.
20. Cobet G, Gummelt T, Bollmann R et al. Assessment of serum levels of alpha-1-microglobulin, beta-2-microglobulin, and retinol binding protein in the fetal blood. A method for prenatal evaluation of renal function. Prenat Diagn 1996; 16: 299–305.
21. Armangil D, Yurdakok M, Canpolat FE et al. Determination of re-ference values for plasma cystatin C and comparison with creatinine in premature infants. Pediatr Nephrol 2008; 23: 2081–2083. 22. Perrone RD, Madias NE, Levey AS. Serum creatinine as an index of
renal function: new insights into old concepts. Clin Chem 1992; 38: 1933–1953.
23. Akbari A, Lepage N, Keely E et al. Cystatin-C and beta trace protein as markers of renal function in pregnancy. BJOG 2005; 112: 575–578.
24. Muller F, Bernard MA, Benkirane A et al. Fetal urine cystatin C as a predictor of postnatal renal function in bilateral uropathies. Clin Chem 1999; 45: 2292–2293.
25. Acar O, Uluocak N, Ziylan O et al. Is cystatin C a promising par-ameter to determine postnatal outcome of prenatally diagnosed infra-vesical obstruction? J Urol 2009; 182: 1542–1547.
26. Harmoinen A, Ylinen E, Ala-Houhala M et al. [Cystatin C–a new marker to diagnose renal insufficiency of mild degree]. Duodecim 2002; 118: 1015–1020.
27. Plebani M, Mussap M, Bertelli L et al. [Determination of blood cy-statin C in pregnant women during labor and in their newborns]. Pediatr Med Chir 1997; 19: 325–329.
28. Montini G, Cosmo L, Amici G et al. Plasma cystatin C values and inulin clearances in premature neonates. Pediatr Nephrol 2001; 16: 463–465.
29. Bariciak E, Yasin A, Harrold J et al. Preliminary reference intervals for cystatin C and beta-trace protein in preterm and term neonates. Clin Biochem 2011; 44: 1156–1159.
30. Filler G, Priem F, Lepage N et al. Beta-trace protein, cystatin C, beta (2)-microglobulin, and creatinine compared for detecting impaired
glomerular filtration rates in children. Clin Chem 2002; 48: 729–736.
31. Zappitelli M, Parvex P, Joseph L et al. Derivation and validation of cystatin C-based prediction equations for GFR in children. Am J Kidney Dis 2006; 48: 221–230.
32. Luyckx VA, Brenner BM. The clinical importance of nephron mass. J Am Soc Nephrol 2010; 21: 898–910.
33. Jose PA, Fildes RD, Gomez RA et al. Neonatal renal function and physiology. Curr Opin Pediatr 1994; 6: 172–177.
34. Yao LP, Jose PA. Developmental renal hemodynamics. Pediatr Nephrol 1995; 9: 632–637.
35. Seikaly MG, Arant BS, Jr. Development of renal hemodynamics: glomerularfiltration and renal blood flow. Clin Perinatol 1992; 19: 1–13.
36. Bertram JF, Douglas-Denton RN, Diouf B et al. Human nephron number: implications for health and disease. Pediatr Nephrol 2011; 26: 1529–1533.
Received for publication: 20.7.2011; Accepted in revised form: 30.1.2012
Nephrol Dial Transplant (2012) 27: 3482–3488 doi: 10.1093/ndt/gfr684
Advance Access publication 13 December 2011
Prevalence and prognosis of unrecognized myocardial infarctions
in chronic kidney disease
Dana V. Rizk
1, Orlando Gutierrez
1, Emily B. Levitan
2, William M. McClellan
2,3, Monika Safford
4,
Elsayed Z. Soliman
5, David G. Warnock
1and Paul Muntner
1,21
Division of Nephrology, Department of Medicine, University of Alabama at Birmingham, Birmingham, AL, USA,2Department of Epidemiology, University of Alabama at Birmingham, Birmingham, AL, USA,3Division of Nephrology, Department of Internal Medicine, Emory University School of Medicine, Atlanta, GA, USA,4Division of Preventive Medicine, Department of Medicine, University of Alabama at Birmingham, Birmingham, AL, USA and5Department of Epidemiology and Prevention,
Epidemiological Cardiology Research Center (EPICARE), Wake Forest University School of Medicine, Winston-Salem, NC, USA Correspondence and offprint requests to: Dana V. Rizk; E-mail: [email protected]
Abstract
Background. Unrecognized myocardial infarctions (UMIs) are common in the general population but have not been well studied in patients with chronic kidney disease (CKD). The purpose of this study was to deter-mine the prevalence and prognosis for mortality of UMI among adults with CKD.
Methods. The current study included 18 864 participants in the population-based REasons for Geographic And Racial Differences in Stroke (REGARDS) study who com-pleted a baseline examination including a 12-lead electro-cardiogram (ECG). UMI was defined as the presence of myocardial infarction (MI) by Minnesota ECG classi fi-cation in the absence of self-reported or recognized MI (RMI). Estimated glomerularfiltration rate (eGFR) was cal-culated using the Chronic Kidney Disease Epidemiology Collaboration equation and albuminuria using albumin-to-creatinine ratio from a spot urine sample. All-cause
mortality was assessed over a median 4 years of follow-up. Results. The prevalence of UMI was 4, 6, 6 and 13% among participants with eGFR levels of≥60, 45–59.9, 30– 44.9 and <30 mL/min/1.73m2, respectively, and 4, 5, 7 and 10% among participants with albuminuria levels of <10, 10–29.9, 30–299.9 and ≥300 mg/g, respectively. Compared to those with no MI, the multivariable adjusted hazard ratio for all-cause mortality associated with UMI and RMI was 1.65 [95% confidence interval (CI): 1.09–2.49] and 1.65 (95% CI: 1.20–2.26), respectively, among individuals with an eGFR <60 mL/min/1.73m2 and 1.49 (95% CI: 1.03– 2.16) and 1.88 (95% CI: 1.40–2.52) among individuals with albuminuria≥30 mg/g.
Conclusion. UMIs are common among individuals with an eGFR <60 mL/min/1.73m2and albuminuria and associ-ated with an increased mortality risk.
Keywords: chronic kidney disease; coronary artery disease; mortality
© The Author 2011. Published by Oxford University Press on behalf of ERA-EDTA. All rights reserved. For Permissions, please e-mail: [email protected]