HAL Id: hal-02391575
https://hal.archives-ouvertes.fr/hal-02391575
Submitted on 22 Mar 2021
HAL is a multi-disciplinary open access
archive for the deposit and dissemination of
sci-entific research documents, whether they are
pub-lished or not. The documents may come from
teaching and research institutions in France or
abroad, or from public or private research centers.
L’archive ouverte pluridisciplinaire HAL, est
destinée au dépôt et à la diffusion de documents
scientifiques de niveau recherche, publiés ou non,
émanant des établissements d’enseignement et de
recherche français ou étrangers, des laboratoires
publics ou privés.
loading and cell delivery
Caroline Ladurantie, Mathilde Coustets, Georges Czaplicki, Pascal Demange,
Serge Mazères, Stéphanie Dauvillier, Justin Teissié, Marie-Pierre Rols, Alain
Milon, Vincent Ecochard, et al.
To cite this version:
Caroline Ladurantie, Mathilde Coustets, Georges Czaplicki, Pascal Demange, Serge Mazères, et al.. A
protein nanocontainer targeting epithelial cancers: rational engineering, biochemical characterization,
drug loading and cell delivery. Nanoscale, Royal Society of Chemistry, 2019, 11 (7), pp.3248-3260.
�10.1039/c8nr10249j�. �hal-02391575�
Please do not adjust margins
Caroline Ladurantie
a†, Mathilde Coustets
a,b†, Georges Czaplicki
a, Pascal Demange
a, Serge Mazeres
a, Stéphanie
Dauvillier
a, Justin Teissié
a, Marie-Pierre Rols
a, Alain Milon
a, Vincent Ecochard
a, Grégori Gross
a,cand Laurent
Paquereau
a*
Abstract
The development of drug delivery and imaging tools is a major challenge in human health, in particular in cancer pathologies. This work describes the optimization of a protein nanocontainer, belonging to the lectin protein family, for its use in epithelial cancers diagnosis and treatment. Indeed, it specifically targets a glycosidic marker, the T antigen, which is known to be characteristic of epithelial cancers. Its quaternary structure reveals a large hydrated inner cavity able to transport small therapeutic molecules. Optimization of the nanocontainer by site directed mutagenesis allowed controlling loading and release of confined drugs. Doxorubicin confinement was followed, both theoretically and experimentally, and provided a proof of concept for the use of this nanocontainer as a vectorization system. In OVCAR3 cells, a human ovarian adenocarcinoma cell line that expresses the T antigen, the drug was observed to be delivered inside late endosomes/lysosomes. These results show that this new type of vectorization and imaging device open new exciting perspectives in nano-theranostic approaches.
1 Introduction
Drug delivery systems have been extensively studied over the last decades to limit the side effects of chemotherapeutic treatments, in particular in cancer pathologies. Different types of molecules of either synthetic or natural origin were used as drug-carrier platforms. Among these macromolecular assemblies, protein-based platforms display characteristics that make them very good candidates for nanomedicine applications1. Indeed, they can show good biocompatibility and biodegradability
coupled with low toxicity. A variety of proteins have been used as drug delivery systems. They constitute macromolecular assemblies of different types including virus-like particle-based nanocages2, 3 from plant viruses4, 5 or bacteriophages MS26 and Q
β7 and natural
structure-a. Institut de Pharmacologie et Biologie Structurale, IPBS, Université de Toulouse, CNRS, UPS, 205 Route de Narbonne, BP64182, 31077 Toulouse, France. E-mail : [email protected]
b.Present address: Urosphere, Parc technologique du canal, Canal Biotech II, 3 rue des satellites 31400 Toulouse, France.
c.Present address: GTP Technology, Bâtiment Gould – 52 l’Occitane, 31670 Labège Cedex-France.
† These authors contributed equally to the work.
Electronic Supplementary Information (ESI) available: [details of any supplementary information available should be included here]. See DOI: 10.1039/x0xx00000x
Nanoscale
Accepted
based nanocages such as ferritin/apoferritin8-10, small heat shock proteins11-13, vault proteins14-16 and a number of another cage
structures17, 18. These protein cargos display geometries as diverse as microspheres, nanoparticles, minirods, hydrogels, films and
protein cages17. Drug loading in these protein-based nanocages is realized through non-covalent or covalent attachments. For the
non-covalent association, drugs are generally packaged inside an internal cavity through the affinity of the cage for molecules. The encapsulation of drugs is enabled by a disassembly/reassembly phenomenon triggered by an environmental change such variations of salt concentration, pH, temperature or osmotic shock. For example, ferritin/apoferritin cages are separated into subunits at acidic pH, allowing the dissociation of the nanocage, which can be reversibly reassembled by increasing the pH19, 20.
The covalent attachment of drugs can be realized on specific amino acids side chains localized into the interior cavity or onto the surface of the protein nanocage. Obviously, the attachment of a drug onto the external surface may completely eliminate the protective effect of the nanocage and thus the control of drug release21.
The efficacy of drug delivery requires targeting specific cells such as tumour cells and thus functionalizing protein-based nanocages accordingly. This functionalization can be carried out either genetically or chemically. The protein nature of these assemblies greatly facilitates genetic modifications. For instance, an addressing peptide such as the RGD peptide can easily be recombinantly fused to the nanocage subunits to target integrin receptors and enhance transport to tumoral cells22, 23. Chemical functionalization
consists in grafting, in different ways, a specific moiety allowing cellular addressing. It can be a small ligand like folic acid which has been widely used to target cancer cells24, 25, aptamers26, cell-penetrating peptides27, 28 and affibodies29. This targeting requires
identifying a relevant membrane surface marker of the pathology. This marker allows both the detection and delivery of therapeutic molecules to tumour cells, the so-called theranostic approach. The majority of these markers are membrane proteins whose expression rate is up-regulated in cancer pathologies. Among these, the mucin protein family serves both as membrane and circulating markers in adenocarcinomas. For example, MUC1 and MUC16 are the classic markers of breast and ovarian carcinoma and their circulating forms, CA15.3 and CA125 respectively, are used as blood markers30-33. In healthy epithelial tissues,
mucins are highly O-glycosylated proteins. In contrast, carcinoma cells express truncated immature O-glycans through different mechanisms leading to incomplete O-glyscosylations34. These immature O-glycans are represented by the disaccharide
Thomsen-Friedenreich antigen (T antigen: Gal1-3GalNAc1-O-Ser/Thr) or its direct precursor (Tn: Gal-NAc1-O-Ser/Thr)35, 36. Therefore,
carcinoma cells can be targeted by specific recognition of these modified immature O-glycans. This specific recognition can be achieved with a well-known class of carbohydrate-binding proteins, the lectins37, 38.
We isolated from a higher edible mushroom, Xerocomus chrysenteron, a protein belonging to the lectin family, which presents the characteristics of a potential drug delivery system. Indeed, this Xerocomus chrysenteron lectin (XCL) belongs to a group of proteins that selectively recognizes the T antigen39. The binding of XCL to the T antigen expressed by membrane proteins was determined
by ITC experiments and presented a high affinity with dissociation constants of 1.6µM and 0.38µM for fetuin and asialofetuin, respectively40. After its binding on cell surface markers, XCL was quickly endocytosed by a clathrin-dependent mechanism to end
up in late endosomes/lysosomes. This cellular binding was totally blocked in presence of a competitive sugar highlighting the need of T antigen binding to achieve cellular uptake of the protein41. The resolution of its 3D structure revealed that the tetrameric
assembly of the XCL protein displays a complex network of protomer-protomer interfaces and generated a large, hydrated inner cavity of 1nm3, which may became accessible to solutes after conformational changes of the protein42. These intrinsic properties
led us to investigate XCL as a new protein nanocontainer device for specific delivery of drugs. We deciphered and described the opening mechanism of the XCL homotetramer allowing access to its inner cavity. Several mutants were generated to control this reversible opening and their biochemical properties were studied. Finally, in silico experiments of docking and molecular dynamics gave guidelines to explore experimentally the loading of doxorubicin and its specific delivery to human adenocarcinoma cells.
2 Experimental
2.1 Protein preparation.All site-directed mutagenesis were made using the Quickchange mutagenesis kit (Stratagen). Recombinant proteins (XCL and its mutants, T12C, A38C and T12C/A38C) were produced and purified as previously described39. An additional purification step was
achieved by size exclusion chromatography using a Sephacryl S300 column 600mmx26mm, equilibrated with buffer A (50mM phosphate, 100mM NaCl) pH7.2 and run at a 1.5 mL per minute flowrate. The purified proteins were finally dialyzed against buffer A and concentrated on a VIVASPIN 15R column (Sartorius, 10000 MWCO).
2.2 Labelling of protein
For labelling with FITC and RITC, XCL or A38C (30µM) were incubated at 25°C in the dark during 1h with continuous stirring in buffer A (pH 9) with either 1mM FITC (Sigma) or 1mM RITC (Sigma) solubilized in the same buffer. The reaction was stopped by the addition of 10 mM Tris–HCl (pH 9). The labeled protein samples were passed through a Sephadex G-25 column (Sigma) previously equilibrated with buffer A (pH 8.5). The stoichiometry of labeling was determined spectrophotometrically at pH 8.5. The protein-bound dye concentrations were calculated using the following extinction coefficients: 494 nm = 77000 cm-1 M-1 for FITC
Nanoscale
Accepted
Please do not adjust margins
and 560 nm = 85000 cm-1 M-1 for RITC. Protein concentrations after labeling were calculated using 280 nm = 120000 cm-1 M-1 with a
previous correction from the absorption of the probes at this wavelength. The labelling stoichiometry was 4 moles of FITC and 0.9 moles of RITC per mole of tetramer protein, respectively.
For labelling with Alexa 647, A38C (30µM) was incubated overnight at room temperature in the dark with continuous stirring in a medium composed of 100mM sodium bicarbonate (pH 8.5) and the reactive dye at a concentration of 80µM. The labeled protein samples were purified through a Bio-Gel P30 Gel (Biorad) previously equilibrated with buffer A (pH 8.5). The yield of labeling was determined by spectrophotometry. The protein-bound dye ratio was calculated using the following extinction coefficient for Alexa Fluor 647: 650 nm = 239000 cm-1 M-1 (Molecular probes handbook). The typical labeling ratio was 1-2 moles of Alexa Fluor 647 dye
per mole of nanocontainer.
2.3 FRET experiments
2.3.1 Equilibrium experiment. Fluorescence resonance energy transfer (FRET) was used to highlight the exchange between XCL
monomers. The exchange reaction was initiated by mixing an equal volume of 1µM XCL-RITC (or buffer alone as a reference) and 1µM XCL-FITC at 25°C in buffer A pH 8.5. After one-hour incubation, the emission spectrum of donor and acceptor (500-650nm) was recorded upon excitation of donor at 468nm using a Photon Technology International QM-4 spectrofluorometer. The same experimental condition was used with A38C-RITC and A38C-FITC.
2.3.2 Kinetic experiment.Fluorescence resonance energy transfer was used to determine the rate of XCL subunits exchange. The reaction was initiated by mixing an equal volume of 1µM XCL-RITC and 1µM XCL-FITC at 25°C in buffer A pH 8.5. Excitation wavelength was set to 468nm. Rhodamine fluorescence emission at 580 nm was recorded every 0.5 seconds. Fluorescence intensity was normalized using the following equation:
Fnorm (t) =
F(t) ― F0
F∞― F0
where F(t) is the 580nm raw fluorescence value considered, F0 is the initial fluorescence value, and F∞ the final fluorescence
intensity value when steady-state is reached. Kinetic data were fitted using GOSA software43. The data were best fitted with a
double exponential rise i.e. two dissociation steps, using the following equation: 𝐹 = 1 ―
[
𝑎 × 𝑒― 𝑘1𝑡+ (1 ― 𝑎) × 𝑒― 𝑘2𝑡]
where
a is the proportion of molecule following the slower dissociation k1 is the kinetic constant of the slower dissociation
k2 is the kinetic constant of the faster dissociation
2.4 Size exclusion chromatography, SEC.
SEC experiments were performed on a GE-healthcare Superose 12 PC 3.2/30 column. Buffer A (pH7.2 or indicated pH) was used as elution buffer on a column equilibrated with the same buffer. The flow rate was set at 0.5mL/min. Bovine serum albumin and Ribonuclease A were used to calibrate the column with elution volumes of 12.6 mL and 15.5 mL, respectively.
2.5 Isothermal titration calorimetry, ITC.
ITC was performed using a VP-ITC microcalorimeter from Microcal Inc. (Northampton, MA). XCL was prepared in buffer A and dialysis against the same buffer was realised overnight. This dialysis buffer was then used in ITC measurements to limit dilution effects. Calorimetric dilution experiments were done following instrumental procedures at 25°C with a stirring speed of 300rpm and a 296µl computer-controlled injection microsyringe. After an initial delay of 500min, small volume (5µl) of concentrated XCL (40µM) were injected 25 times in the cell reaction (1.437ml) at an interval of 1200 seconds, into the dialysis buffer solution. The experimental data were fitted to a theoretical dissociation curve using software supplied by Microcal (Origin), in terms of a simple tetramer-dimer equilibrium model to give an apparent equilibrium constant (Kdiss) and an enthalpy of dissociation (Hdiss per mole
of dimer).
𝐓 𝟐 𝐃; 𝐊𝐝 𝐢 𝐬 𝐬 =
[ 𝐃 ] 𝟐 [ 𝐓 ]
2.6 Differential Scanning Fluorimetry, DSF
DSF experiment were performed into a white/clear 96-well PCR plate (Bio-Rad) with 10µM of protein in buffer A (pH7.2 or at the indicated pH) and 5X SYPRO Orange (Invitrogen) as dye. PCR plates were sealed with optical quality sealing tape (Bio-Rad). Fluorescence
Nanoscale
Accepted
intensity was measured (CFX ConnectTM Real-Time PCR detection System, Bio-Rad) with the 480/500 excitation and 560/580
emission filters for each temperature increment (from 20°C to 95°C with 0.3°C step). Analysis was realized with CFX Manager software (BioRad) and melting temperature was determined by plotting –d(RFU)/dT vs T, where RFU is the relative fluorescence intensity and T, the temperature.
2.7 Docking and Molecular Dynamic simulations
Docking was done using the AutoDock Vina program44. Input files were prepared with the MGLTools v1.5.6 software45 . The docking
program was run on a cluster with 200 CPUs, each of which generated 20 poses, thus creating a pool of 4000 poses. The pose with the best score was selected for subsequent molecular dynamics simulations. For this purpose, we have used the Amber 14 software suite46. The topology for the ligand was based on the GAFF force field, for the protein on the ff03 force field. The system was
initially minimized, then equilibrated at 300K and finally a production run of 20 ns was launched in order to verify the stability of the complex. The trajectory was analyzed by in-house software to determine persistent intermolecular contacts. The energy of the intermolecular interaction was determined by the MMPBSA.py script47.
2.8 Loading of molecules
Doxorubicin (Sigma)(500µM) was incubated protected from light at room temperature for 24h, with A38C (50µM) equilibrated in buffer A (pH7.2) in a final volume of 1.5ml. For loading in the reduced form of A38C, 1mM of DTT was added to the mix. For loading in oxidized form 10mM of GSSG was added to the mix. Free doxorubicin and DTT were simultaneously removed with two successive gel filtrations on PD miditrap (Dutcher) and pd10 columns G25 (Sigma) equilibrated with buffer A pH 7.2. The purification efficiency was verified beforehand by loading the column with 500µM of doxorubicin. Eluted protein was concentrated to 500µl with Amicon ultra 2 (Merck Millipore). In some case, two successive dialysis of the loaded protein were realized overnight against 300ml of buffer A (pH7.2). Loading rates were estimated by measuring the absorbance at 280nm and 490nm with using the following extinction coefficients 280 nm = 120000 cm-1 M-1 for the protein and 490 nm = 10800 cm-1 M-1 for the doxorubicin.
𝐿𝑜𝑎𝑑𝑖𝑛𝑔 𝑅𝑎𝑡𝑒 (%) = [𝐷𝑜𝑥𝑜] [𝑃𝑟𝑜𝑡𝑒𝑖𝑛] 𝑥 100
2.9 Cell delivery and dose response experiments
Human ovarian adenocarcinoma cell line NIH-OVCAR3 (OVCAR-3) were obtained from American type culture collection (ATCC®, HTB-161, Manassas, VA). OVCAR-3 cells were routinely cultured in RPMI 1640 medium (Eurobio, CM1RPM00K) containing 10% fetal bovin serum (Sigma, F7524) supplemented with 1% penicillin-streptomycin (Sigma, P0781), 2mM Glutamine (Eurobio, CSTGLU00), 10µg/mL human Insulin (Sigma, I9278) and 20ng/mL human recombinant epidermal growth factor (Sigma, E9644). Cells were cultured as monolayers at 37°C in a humidified 5% CO2 atmosphere. Cells were regularly checked for mycoplasma.
For confocal localization experiments, OVCAR-3 cells were seeded on four wells cover-glass Lab-TEK devices (Nunc) at 5.105 cells
per well. Once plated (9h), 0.8µM of nanocontainer containing the doxorubicin and 320nM of empty nanocontainer labelled with alexa647 were added to the culture medium. For free doxorubicin localization, 0.4µM (equivalent concentration to the loaded doxorubicin inside the nanocontainer) of doxorubicin was added to the culture medium. Cells were incubated for 15 hours at 37°C (5% CO2) before removing the medium and washing cells with phosphate buffer saline (PBS, Eurobio). A similar experiment was
realized in presence of 2mM Fetuin (Sigma F2379) (+F) as competitor. Nanocontainer containing the doxorubicin (0.8µM) and empty nanocontainer labelled with Alexa647 (230nM) were pre-incubated with 2mM Fetuin for 3h directly in culture medium. Afterwards, the pre-incubation mix was added to the cells for a 15h incubation at 37°C (5% CO2) before removing the medium and
washing cells with phosphate buffer saline (PBS, Eurobio). Fluorescence images were acquired using an Olympus FV-1000 confocal microscope with 60X oil PLAPON OSC objective. Images were processed to filter the noise (PureDenoise plugin) with Fiji software, and this filter was similarly applied to all images.
For dose response experiments, OVCAR-3 cells were seeded on a 12 wells plate at 106 cells per well. Once plated (24h), various
concentrations (0.4; 0.8; 1.2; 1.6 and 3.2µM) of nanocontainer containing the doxorubicin or 3.2µM of empty nanocontainer were added to the culture medium (1ml). Cells were incubated for 24h at 37°C (5% CO2) before removing the medium and washing cells
with phosphate buffer saline (PBS, Eurobio). Fresh culture medium was added and cells were cultured 48 hours more at 37°C (5% CO2). Afterwards, cells were washed and trypsinized. To assess viability, once harvested cells were counted and results were
expressed in % of cell survival regarding the control condition (OVCAR-3 cells alone). Then, cells were collected by centrifugation and resuspended in PBS supplemented with 5µg/mL propidium iodide, 0.1% Triton X100 and 2.5% SVF. Cells were incubated 20 min at room temperature in the dark before flow cytometry analysis. FACS data were acquired with FACSCalibur cytometer (BD Bioscience) and cell cycle analysed using Modfit software.
2.10 Statistical analysis and molecular representations
Nanoscale
Accepted
This journal is © The Royal Society of Chemistry 20xx J. Name., 2013, 00, 1-3 | 5
Please do not adjust margins
Data analysis was performed by using GraphPad Prism 6.0 program (GraphPad Software, Inc., La Jolla, CA, USA) and data were expressed as means ± SEM for the number of experiments indicated in the legends of the figures. Multiple comparisons were performed using one-way analysis of variance (ANOVA) followed by Bonferroni multiple comparison post-test: *p < 0.05, **p < 0.01, ***p < 0.001 and****p < 0.0001.
All molecular illustrations were made with PyMOL48.
3 Results and discussion
3.1 Highlighting an exchange between protomer subunits.
Structural RX resolution demonstrated that XCL self-organizes as a homotetramer with a complex network of protomer-protomer interfaces which generate a large inner hydrated cavity of 1nm3 (Fig 1A)‡42. Previous studies (analytical ultracentrifugation and
dynamic light scattering, Fig S1) showed systematically that XCL appeared tetrameric in solution. The aim is to validate the use of this protein as a nanocontainer. We tested whether an increase in temperature could displace the tetramer/dimer equilibrium. We chose this parameter because it does not modify the protonation state of the lateral chains likely to interact with a ligand. DOSY NMR experiments did not reveal any shift in this equilibrium with temperature at a define pH (data not shown). So, we looked for a more sensitive method to investigate if spontaneous exchange between tetrameric and dimeric forms could be highlighted. The XCL oligomerization equilibrium was characterized through fluorescence energy transfer (FRET) between two populations of XCL, labelled separately with FITC and RITC on lysine side chains. FRET provides information on molecular processes occurring at distances in a range of 10 to 100 Å49. As observed on the XCL structure (Fig 1B), minimal and maximal distances of two
є-amino groups of lysines belonging to two different protomers and exposed to the surface of the protein are 21 Å and 67 Å, respectively and thus both in the typical range allowing FRET measurements since the Förster radius for this donor–acceptor pair is 55 Å.
The fluorescence emission spectra of XCL-FITC (black dashed line) and XCL-RITC (black continuous line) were recorded separately after being excited at 468nm (Fig 1C). The donor and the acceptor labeled protein were mixed and incubated at room temperature.
Figure 1 A) Structure representation (ribbon diagram) showing the overall organisation of the homotetrameric protein. The individual subunits are differently coloured and marked A to D. Insert shows the loops (ribbon representation) of chain A and chain D closing the upside cavity (surface representation). B) Minimal and maximal distances between є-amino group of lysines belonging to different protomers. Minimum and maximum distances are indicated. C) FRET experiment realized by mixing XCL-FITC and XCL-RITC for 1hour at room temperature. Samples were excited at 468nm and emission fluorescence were recorded between 500 and 650 nm. FRET net corresponds to fret raw minus the contribution of rhodamine.
Nanoscale
Accepted
A decrease of the fluorescence intensity corresponding to the fluorescence of FITC, and simultaneously an increase of the fluorescence intensity of RITC were observed, indicating the existence of energy transfer between the fluorescent dyes (Fig 1C, red and blue lines). In this figure, net FRET corresponds to the measured raw FRET minus the direct participation of RITC (acceptor) when excited at the donor wavelength. This analysis underestimates the FRET since the FITC labelling ratio is 4 times higher than that of the RITC one. As the transfer efficiency depends on the inverse sixth-power of the donor–acceptor distance and the dimensions of the XCL molecule are in the order of this Förster radius, the occurrence of energy transfer could only be possible if FITC-XCL monomers and RITC-XCL monomers have been reshuffled and finally belonged to the same tetramer. These results demonstrated a dynamic exchange between dimers constituting the protein. The access to the inner cavity of the protein can therefore be spontaneously achieved. However, as the purpose of this study is to use this tetrameric protein as a drug nanocontainer, the opening mechanism must be controlled in vitro.
3.2 Design of XCL variants by directed evolution
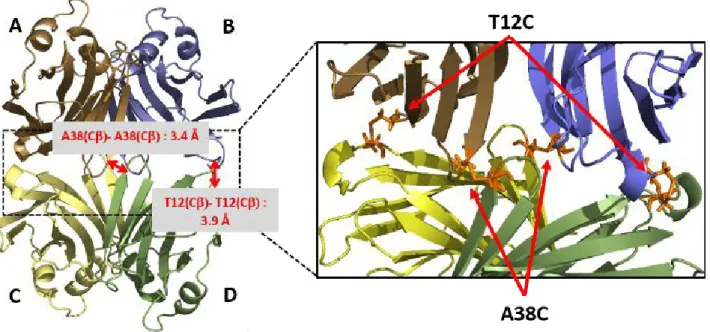
In order to control the stability and the dynamic of XCL's quaternary structure, we have designed variants of XCL in which monomers are covalently bonded. We adopted a strategy involving the formation of inter monomer disulfide bridges by substituting selected residues by cysteines. To minimize the number of substitutions we selected amino acids that were close to their counterparts in opposite monomers. According the X-ray structure of XCL (Fig 2), two amino-acids, threonine 12 and alanine 38, displayed such a propensity. The distance between C of threonine 12 and its counterpart is 3.9 Å and 3.4 Å for alanine 38 and its counterpart. These distances were in the typical range for C of cysteines involved in a disulfide bridge50. Furthermore, the side
chains of these residues were localized at the surface of the protein and expected accessible to oxidative and reductive agents. Energy minimizations using the COOT software51 showed that the orientation of the side chain of cysteines in place of T12 and A38
and their structural environment were compatible with the formation of a disulfide bridge. In addition, the position of these residues does not interfere with the formation of the T antigen binding site (Fig S2).
These two mutants introduced different stabilizing constraints in the tetrameric assembly. The T12C mutant presents covalent bonds between monomers A and C and between monomers B and D (Fig 2). The engineered T12C tetramer can split into two dimers, A/C and B/D. The inter-chain disulfide bonds of the A38C mutant provided two types of structural constraints. On one hand, the additional link reduced the capacity of the loops, which are closing the cavity, to move freely. Thus, it should restrain the leakage of a confined small molecule. On the other hand, the addition of those disulfide bonds in a crosswise manner implied that the dissociation of oxidized A38C tetramers would be possible only if all interfaces between protomers were broken to generate the dimers A/D and B/C. Finally, the double mutant (T12C/A38C) should combine these constraints and make it possible to obtain a better stability.
3.3 Properties of the variants: the emergence of the nanocontainer
The effective oxidation of disulfide bridges for each mutant has been tested by DSF. The oxidization was carried out spontaneously and rapidly (few hours) in an oxygenated buffer without any oxidizing agents (Fig S3A), which implied that the disulfide bonds
Figure 2 Schematic representation of the position of disulfide bridges on the tetramer protein. (Left) Position of mutated residues, A38C and T12C, and theoretical distance between the lateral chains of cysteines. Only one of each bridge is shown. (Right) Due to the symmetry of the protein, each mutation introduces 2 disulfide bridges.
Nanoscale
Accepted
Please do not adjust margins
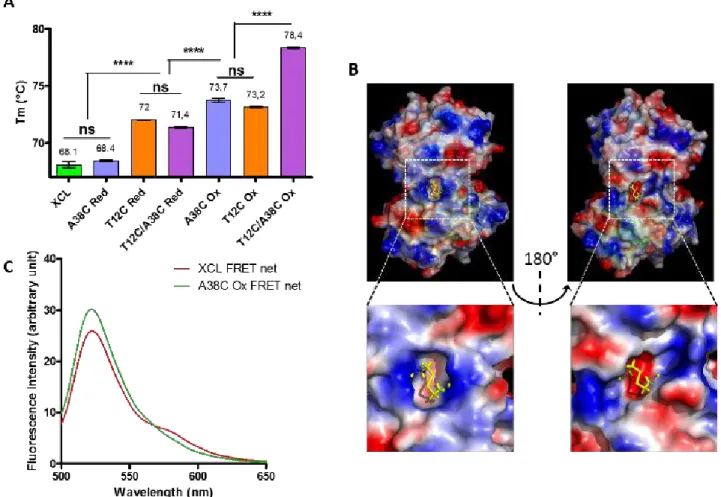
formation took place during the purification steps of the protein. This spontaneous reactivity of cysteines validated the design strategy of the different mutants. The single mutations under oxidative conditions (T12C Ox and A38C Ox) showed a Tm value increase of 5°C compared to the wild type protein XCL (from 68°C to 73°C) (Fig 3A). The presence of the four disulfide bridges in the double mutant (T12C/A38C Ox) led to an additional thermo-stability provided by each single mutant, with a Tm value increase of 10°C compared to the wild type protein (from 68°C to 78°C). The introduction of disulfide bonds increased the Tm in all cases, thus the global strategy of mutagenesis was successful in terms of thermo-stability.
The possibility of using this protein as a nanocontainer requires the ability to effectively reduce disulfide bridges to return to the spontaneous opening conditions of the wild type protein. Several reduction conditions were tested (Fig S3B) and the reversible formation of these disulfide bonds was assessed (Fig 3A). In the presence of DTT as reducing agent, the A38C variant was fully reduced. In contrast, the mutants T12C and T12C/A38C, in their reduced forms, presented a lower Tm than that of oxidized T12C but not returning to the level of XCL. To understand this behavior, which could only be due to a lack of complete reduction of the disulfide bridge common to these two mutants (the T12C position), we have analyzed in silico the environment of this bridge on each side of the protein. An asymmetry in surface charges in the vicinity of this disulfide bond on each side was observed (Fig 3B). In addition, the bridges in one side was buried more deeply in the structure than its equivalent on the other side, which explained the difference in accessibility or effectiveness of the reducing agent. This observation showed that the structural symmetry of the protein is not perfect, in particular at the interfaces between the A/C monomers on one hand and B/D on the other hand, and that under the experimental conditions tested it was not possible to recover the thermal behavior of the wild type protein.
Consequently, in order to generate a protein nanocontainer, only the A38C mutant had a complete oxidation and reduction capacity. We therefore verified whether this mutation held the protein in a closed form, i. e. to block its spontaneous opening. The dynamic behavior of oxidized A38C tetramers was investigated by FRET experiments. The superposition of fluorescence emission spectrum of XCL and oxidized A38C is shown in figure 3C. This experiment highlighted that A38C Ox dimers were not able to reshuffle and thus this mutant remained in a tetrameric state. Therefore, considering the higher thermo-stability and the oxydo-reduction properties, the A38C mutant is a suitable candidate for a protein nanocontainer i) a blocking of its spontaneous opening in an oxidized form which also maintained in place the loops allowing access to the internal cavity and ii) a complete reversibility of its disulfide bridges.
Figure 3 A) DSF experiments were realized with indicated protein under oxidative (Ox) or reducing (Red) conditions. Tm are indicated above columns. n≥5 independent experiments. B) Surface charges analysis showing the disulfide bridges T12C on each face of the protein. C) FRET experiment: samples were excited at 468nm and emission fluorescence were recorded between 500 and 650 nm. The graph shows the superposition of FRET net for XCL and A38C Ox.
Nanoscale
Accepted
This journal is © The Royal Society of Chemistry 20xx J. Name., 2013, 00, 1-3 | 8
3.4 Biochemical characterization of the nanocontainer
We explored several characteristics of this nanocontainer with different objectives: i) quantifying the association dynamics by estimating the apparent equilibrium constant ii) determining the behavior of the nanocontainer at an acidic pH corresponding to the lysosomes compartment iii) and finally deciphering the most likely mechanism of tetramer formation in order to predict in
silico the loading mode inside the nanocontainer. In order to deepen the biochemical characterization of this nanocontainer we
explored two central parameters: the estimation of the apparent equilibrium dissociation constant of the tetramer and its kinetics of formation.
3.4.1 Apparent equilibrium dissociation constant. The reversible dissociation equilibrium of XCL, previously highlighted by FRET,
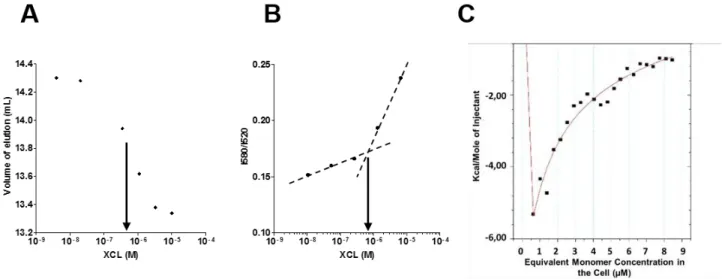
between tetramer and dimer should be shifted to dissociation after dilution and thus allowing the estimation of an apparent global dissociation constant. Several methods have been used to address this aspect, during which we used XCL in place of A38C reduced form to avoid a possible oxidization during the experiment. Equilibrium displacement was assessed by size exclusion chromatography (SEC). At a concentration of 10µM, XCL displayed an elution volume of 13.2mL close to the elution volume of BSA as expected for a tetrameric species (Fig S4A). We performed several injections using varying concentrations of XCL and observed the elution of the protein as a single peak. This peak was shifted toward longer elution volumes as the concentration was lowered, indicating a smaller molecular weight. In this experiment, the existence of a balance between tetrameric and dimeric forms should lead to an elution profile with two peaks. Nevertheless, Yu et al. demonstrated by numerical simulation that, depending on association rate, dissociation rate, flow rate and separation characteristics of the column, two populations of molecules exchanging can lead to a single elution peak in size exclusion chromatography52. When volumes of elution were plotted against XCL
concentrations, a transition was observed in the micromolar range (Fig 4A).
The energy transfer efficiency should diminish upon dilution of the protein. We took advantage of this phenomenon for the determination of the apparent dissociation equilibrium constant of XCL tetramers. The FITC-XCL/RITC-XCL mix was diluted at different concentrations and incubated 1 hour at room temperature in order to reach steady state. Fluorescence spectra were recorded with a 468 nm excitation wavelength (Fig S4B). To sensitively determine the decrease in the transfer of energy and normalize fluorescence intensity, the I580/I520 ratio was calculated for each concentration and plotted versus XCL concentration
(Fig 4B). A transition in energy transfer was observed in the micromolar range which was consistent with previous results obtained by SEC experiments.
Finally, to improve the measurement of the tetramerization equilibrium constant and also determine the thermodynamic parameters of XCL tetramerization, we used isothermal titration calorimetry53. In this method, a concentrated solution of XCL was
diluted into the buffer, and the heat of dissociation to dimers was measured (Fig S4C). The amount of heat released upon each injection is governed by the enthalpy change from tetramer to dimer and the tetramer-dimer equilibrium constant. Fitting the data presented in figure 4C yielded a Kdiss of 4.5 µM and a tetramerization enthalpy change of -16.6 kilocalories per mole of
tetramer (Fig 4C). It must be noticed that the enthalpy change observed during the dissociation of the tetramer into dimers had a negative value indicating an exothermic process. Most of polymeric proteins display an endothermic behavior although exothermic dissociations have already been reported53. Comparing our results to those previously recorded in the literature, it appeared that
the enthalpy change obtained was in the typical range for the dissociation of an oligomeric protein of this size54, 55. However, the
equilibrium dissociation constant was low compared to other polymeric proteins, which was coherent with the great stability of this oligomeric structure.
Figure 4 A) SEC was carried out with a concentration range between 10µM and 4nM of XCL. Elution volume (UV absorbance 280nm) was plotted in function of XCL concentration. The arrow indicates the inflexion point of experimental curve. B) FRET was measured for different concentrations of FITC-XCL and RITC-XCL mix. exc = 468nm. I580/I520 (i.e. IRhod/IFluo) was plotted in function of XCL concentration. Dashed lines represented the linear regression fits. The arrow indicates the break point
between the two slopes. C) ITC was realized with 25 automatic injections (5µl) of XCL (40µM) in phosphate buffer. The integrated curve shows the experimental point (▪) and the best fit (red line, monomer-dimer equilibrium model).
Nanoscale
Accepted
Please do not adjust margins
The exchange between tetrameric and dimeric forms highlighted by these three methods, which gave similar dissociation equilibrium constants in the µM range, demonstrated that XCL tetramers permanently undergo an exchange between dimers and tetramers.
3.4.2 Acidic behavior, oligomerization kinetic and opening mechanism
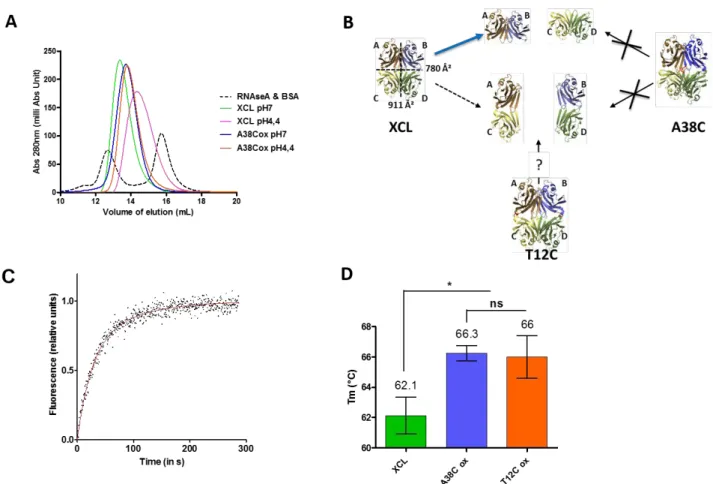
The evidence of the protein opening at acidic pH was initially carried out to ensure that if a therapeutic molecule is confined inside the cavity of the nanocontainer, it would be delivered within the lysosomes once addressed to cells and internalized (see section 3.6)41. Experimentally, size exclusion chromatography analysis showed that XCL was eluted in its tetrameric form at pH 7 (Fig 5A
and Fig S5). When the experiment was carried out at pH 4.4, corresponding to lysosome acidic conditions, the presence of dimers was revealed. Therefore, the acidic lysosome environment leads to a destabilization of the tetrameric form of the native protein. We also analyzed, in the same conditions, the behavior of A38C in its oxidized form. In non-reductive conditions, A38C was insensitive to pH 4.4 and remained in its tetrameric form.
These different behaviors at acidic pH between XCL and A38C provided information that also enabled us to elucidate the dominant opening mechanism of the nanocontainer. We knew that the interactions between the interfaces that made up the tetramer were not equivalent (Fig 5B, left). Indeed, A/B and C/D dimers included an interface that buried 780 Ų from solvent whereas A/C and B/D dimers buried 911 Ų42. This structural characteristic was also highlighted by FRET kinetic experiments. Time course of
oligomerization was studied by mixing FITC-XCL and RITC-XCL and we determined the fluorescence emission intensity at 580 nm as a function of time (Fig 5C). The fluorescence intensity of RITC increased reaching a steady state more than 300 seconds after the mixing, indicating a slow exchange between oligomer subunits. The rise of fluorescence at 580 nm, and thus of energy transfer between fluorescein and rhodamine, was the result of two consecutive phenomena: firstly, the dissociation of tetramers into dimers and secondly their re-association. Considering the shape of the curve (Fig 5C), no time-lag was observed in the initial phase, which implied that the rate of re-association was much greater than the rate of dissociation. The data were best fitted with a double exponential rise and the following constants were obtained: a=0.39; k1=0.72min-1; k2=2.52min-1. This double exponential
behavior suggested that XCL could follow two distinct dissociation pathways leading to different dissociation rates, but one interface between dimers seemed to dissociate 3.5 times faster than the other.
The XCL tetrameric protein could theoretically be opened in two ways: either by breaking the interfaces between the A/C and B/D dimers (Fig 5B, dashed black arrow) or between the A/B and C/D dimers (Fig 5B, blue arrow), but it was expected that the predominant mechanism corresponded to the weakest interface split (Fig 5B, blue arrow). This dimer formation was obtained experimentally at pH 4.4 for XCL while in this condition the A38C mutant in its oxidized form remained tetrameric and therefore could not lead to the formation of dimers (Fig 5B, black arrow).
To determine which of the two interfaces of the tetramer dissociates first, we compared the behavior of the T12C mutant with those of XCL and A38Cox. As the A/C and B/D interfaces of the mutant T12C are secured by a disulfide bridge, only the formation of A/B and C/D dimers is possible. Thus, DSF experiments were performed at pH 4.5 and Tm values of 62.1°C and 66.3°C were obtained for XCL and A38C, respectively (Fig 5D). A Tm value of 66°C, very close to that of A38C, was obtained for the T12C oxidized mutant, indicating the absence of dimer formation under these conditions. Therefore, the predominant opening mechanism of the nanocontainer leads to the formation of A/B and C/D dimers. The in silico docking experiments were then carried out on these dimers.
Nanoscale
Accepted
3.5 The nanocontainer loading: proof of concept
In order to validate this device as a nanocontainer, we tested the confinement of doxorubicin (413 Å3), a small therapeutic
molecule already used in clinics, inside the cavity (1000 Å3). Doxorubicin was detected by spectrophotometry (490nm) which
allowed us to estimate loading rates of this molecule inside the nanocontainer.
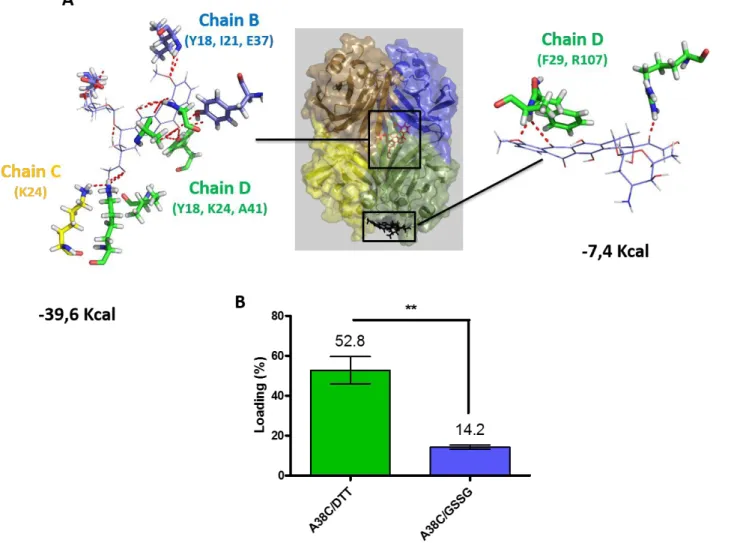
To ensure that doxorubicin was a good candidate for validation of this nanocontainer, we first analyzed by docking and molecular dynamic simulations whether doxorubicin was able to interact with the lateral chains of amino acids lining the cavity. Based on the opening mechanism of the tetramer, in silico docking was realized on the A/B dimer. The best docking hits were used to realize molecular dynamic studies (over 20ns) on the tetramer. Doxorubicin interacted in the inner cavity and outside of the nanocontainer with persistent contacts. The potential energies of these interactions, calculated with Amber software, for the outer and the inner binding were -7.4Kcal.mol-1 and -39.6Kcal.mol-1, respectively (Fig 6A). Therefore, this significant difference in energy
presupposes a highly stronger affinity for the residues lining the cavity. Indeed, the confinement within the cavity involved interactions between doxorubicin and residues belonging to three protein chains (chains B, C and D). It is interesting to note that these interactions must participate in the stabilization of the nanocontainer (tetrameric form) since 3 chains out of the 4 constituting the tetramer are involved. In contrast, only few polar contacts are predicted in the outside binding of the doxorubicin to the nanocontainer's D chain.
Figure 5 A) SEC was performed at two different pH values with XCL and the A38C oxidized mutant. BSA (66KDa, elution volume 12.3ml) and RNAse A (13.7KDa, elution volume 16ml) were used as references. B) Schematic representation of the opening possibilities of the nanocontainer at pH 4.5. XCL can generate two types of dimers (left) with a theoretical prevalence for the mechanism breaking the interface of 780 Ų (blue arrow). At this pH value the nanocontainer A38C remained in tetrameric form (right). The T12C mutant is secured by disulfide bridges and therefore only the formation of A/B and C/D dimers is in theory possible (middle). C) FRET kinetic was initiate by mixing an equal volume of FITC-XCL and RITC-XCL at 25°C. Fluorescence emission at 580nm was recorded every 0.5 second (exc=468nm). The curve shows the experimental points (●) and the best fit (red line) (GOSA Software). D) DSF was performed at pH 4.5 with XCL and the oxidized T12C and A38C mutants. n≥5 independent experiments.
Nanoscale
Accepted
Please do not adjust margins
These in silico results led us to experimentally test the loading of doxorubicin inside the nanocontainer. The nanocontainer (50µM) was incubated with doxorubicin (500µM i.e. 3.10-4 molecule per nm3) for 24h. Assuming that only one doxorubicin can be loaded
per nanocontainer, the rate of confinement was evaluated by measuring the absorbance of doxorubicin per mole of protein after the purification of the nanocontainer from free doxorubicin (and other small compounds). In presence of DTT as reducing agent, 53% of the nanocontainers were loaded (as compared with 0.03% for random confinement) (Fig 6B). The stability of the complex was checked by overnight dialysis and no decrease of the loading rate was observed (data not shown). These high loading rates were directly related to the affinity of interaction between doxorubicin and the lateral chains of the residues lining the cavity. In order to determine the outside binding, oxidative conditions were applied by the addition of GSSG (10mM) during incubation, thus preventing the opening of the tetramer from direct reduction of disulfide bridges by doxorubicin (Fig S6)56. In this condition, a
loading rate of 14.2% was observed which might correspond to binding of doxorubicin onto the nanocontainer surface.
3.6 Targeted cell delivery
Figure 6 A) Docking and molecular dynamic were realized with doxorubicin inside and outside of the protein. The polar contacts of doxorubicin with protomers and the energies of interactions are indicated. B) Doxorubicin was incubated for 24h with A38C in presence of DTT (A38C/DTT) or in presence of GSSG (A38C/GSSG). n≥5 independent
experiments.
Nanoscale
Accepted
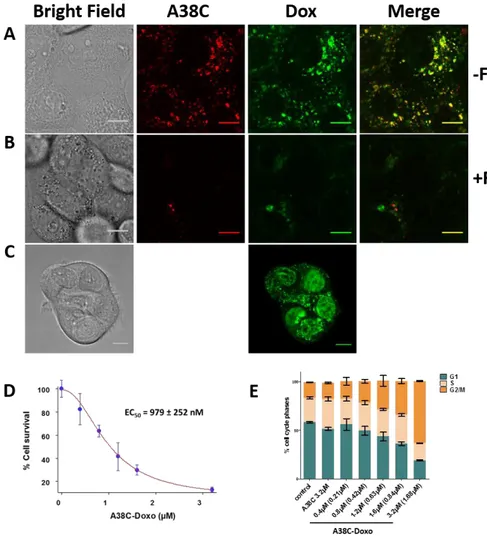
Finally, we analyzed the delivery efficiency of doxorubicin loaded into the nanocontainer cavity. For this purpose, we used OVCAR3 cells, a human ovarian adenocarcinoma cell line that expresses the T antigen57. The internalization of XCL in epithelial human cells
by clathrin dependent endocytosis and its localization in late endosomes/lysosomes after internalization were previously described41. In a first instance, a mix of Alexa-647 labelled nanocontainer (320nM) and doxorubicin-loaded nanocontainer (0.8µM,
loading ratio 53%) was incubated for 15h with the cells and the fluorescence of Alexa-647 and doxorubicin were analyzed by confocal microscopy (Fig 7A). The Alexa-647 (A38C) fluorescence signals showed a vesicular localization in living cells, which corresponds to the known late endosomes/lysosomes accumulation of the nanocontainer. The exactly same pattern was observed with doxorubicin fluorescence signal (Dox). This result indicated that the nanocontainer determined the localization of doxorubicin inside the cells. When the same experiment was performed in the presence of fetuin as a competitor, a very strong decrease of the fluorescent signals, for both Alexa-647 and doxorubicin, was observed (Fig 7B). Therefore, the uptake of doxorubicin inside the
cells was entirely dependent of the nanocontainer binding on T antigen. For the same incubation time, when the cells were incubated with free doxorubicin, the fluorescence signal was mainly found in the nucleus as expected (Fig 7C). In a second set of experiments, the nanocontainer loaded with doxorubicin (loading ratio of 53%) was incubated at increasing concentrations with cells for 24h, and cells were further cultured for 48h. Surviving cells (only 13% of cells were still adherent for the higher
Figure 7 A) OVCAR-3 cells were incubated 15h with 0.8µM of the nanocontainer loaded with doxorubicin (53% loading) and with 320nM A38C-Alexa647 nanocontainer. Fluorescence of Alexa-647 (A38C) and doxorubicin (Dox) were analysed by confocal microscopy. B) The same experiment was realized in presence of 2mM Fetuin (+F) as competitor. C) OVCAR-3 cells were incubated 15h with 0.4µM of doxorubicin alone (equivalent dose of doxorubicin loaded inside the nanocontainer). D) Increasing concentration of A38C loaded with doxorubicin (A38C-Doxo, 53% loading) were incubated with OVCAR-3 cells for 24h. 48h later, cells were harvested and incubated with propidium iodide buffer. Cell survival was analysed by counting. Experimental points were fitted with GOSA software to determine the EC50. n≥3 E) Survival cells were analysed by FACS for their cell cycle phases (Modfit software). Control are untreated cells; A38C: unloaded nanocontainer; A38C-Doxo: nanocontainer loaded with doxorubicin; F: Fetuin. Concentrations referred to protein concentrations and doxorubicin in brackets. n≥3. Scale bar = 10µm.
Nanoscale
Accepted
Please do not adjust margins
concentration) were harvested, counted and analyzed by FACS for cell cycle phases analysis. The cell counts were fitted with GOSA software to determine an EC50 (979nM) (Fig 7D). Cell cycle analysis showed that the higher concentration tested of the empty A38C nanocontainer (3.2µM) did not modify cell cycle phases and the same profile was observed for the control cells (Fig 7E and Fig S7). The cells incubated with the highest loaded nanocontainer concentration showed a 1.9 fold increase of G2/M phases, which was observed concomitantly with a 3 fold decrease of G1 phase. As the nanocontainer ends up located in lysosomes which represents the cells’ waste disposal system displaying acid hydrolase enzymes, an acidic pH (4.5) and a reducing environment, the free doxorubicin was released inside these vesicles. Therefore, the nanocontainer allows the release of doxorubicin. The protonation state of doxorubicin at lysosomal pH allows it to pass through the vesicular membrane into the cytoplasm before accessing the nucleus during cell division12, 58, 59. These results showed that cells were blocked in their division which corresponded
to the known inhibitory action of doxorubicin60.
Conclusions
We used a multidisciplinary approach to validate a new type of protein nanocontainer. Its intrinsic characteristics allow it to target adenocarcinoma cells thanks to its four T antigen recognition sites. Its three-dimensional structure characteristics make it a potential transporter of small therapeutic molecules. Rational engineering based on the 3D structure of this protein has made it possible to obtain a mutated variant. The opening and closing of the A38C mutant can be easily controlled and so allow access to its internal cavity. Cell delivery is of doxorubicin is totally dependent of the nanocontainer targeting and leads to the blocking of cell cycle, attended effect of doxorubicin, without toxicity of the nanocontainer itself. Future developments will partly concern the loading of other classes of therapeutic molecules currently used in chemotherapy. To go further in the development of this nanocontainer and generalize its use as a theranostic tool, it will also be necessary to test its efficiency as a probe and drug delivery system.
Conflicts of interest
The authors have no conflicts to declare.
Acknowledgements
Financial support for this project was provided by the Région Occitanie (grants n°08005117 and 09006150), the Direction de la Recherche et de la Valorisation of Toulouse III University (grant n°08-126) and the SATT-Toulouse Tech Transfer (grant n°M 13-004). We would like thank the Imaging Core Facility TRI-IPBS and the IBiSA Integrated Screening Platform of Toulouse (PICT, IPBS, CNRS - Université de Toulouse).
Notes and references
‡ RCSB Protein Data Bank access codes 1XI0 and 1X99.
1 1. M. Uchida, M. T. Klem, M. Allen, P. Suci, M. Flenniken, E. Gillitzer, Z. Varpness, L. O. Liepold, M. Young and T. Douglas,
Adv Mater, 2007, 19, 1025-1042.
2 2. T. Douglas and M. Young, Science, 2006, 312, 873-875.
3 3. Y. Ma, R. J. Nolte and J. J. Cornelissen, Advanced drug delivery reviews, 2012, 64, 811-825. 4 4. J. A. Speir, S. Munshi, G. Wang, T. S. Baker and J. E. Johnson, Structure, 1995, 3, 63-78.
5 5. C. Porta, V. E. Spall, K. C. Findlay, R. C. Gergerich, C. E. Farrance and G. P. Lomonossoff, Virology, 2003, 310, 50-63. 6 6. B. J. Cargile, S. A. McLuckey and J. L. Stephenson, Jr., Analytical chemistry, 2001, 73, 1277-1285.
7 7. A. E. Ashcroft, H. Lago, J. M. Macedo, W. T. Horn, N. J. Stonehouse and P. G. Stockley, Journal of nanoscience and
nanotechnology, 2005, 5, 2034-2041.
8 8. H. A. Hosein, D. R. Strongin, M. Allen and T. Douglas, Langmuir : the ACS journal of surfaces and colloids, 2004, 20, 10283-10287.
9 9. P. Sanchez, E. Valero, N. Galvez, J. M. Dominguez-Vera, M. Marinone, G. Poletti, M. Corti and A. Lascialfari, Dalton
Trans, 2009, 800-804.
10 10. Z. Wang, Y. Dai, O. Jacobson, F. Zhang, B. C. Yung, P. Zhang, H. Gao, G. Niu, G. Liu and X. Chen, Nanoscale, 2018, 10, 1135-1144.
Nanoscale
Accepted
11 11. M. Murata, S. Narahara, T. Kawano, N. Hamano, J. S. Piao, J. H. Kang, K. Ohuchida, T. Murakami and M. Hashizume,
Molecular pharmaceutics, 2015, 12, 1422-1430.
12 12. R. Toita, M. Murata, K. Abe, S. Narahara, J. S. Piao, J. H. Kang, K. Ohuchida and M. Hashizume, International journal
of nanomedicine, 2013, 8, 1989-1999.
13 13. R. Toita, M. Murata, K. Abe, S. Narahara, J. S. Piao, J. H. Kang and M. Hashizume, Chem Commun (Camb), 2013, 49, 7442-7444.
14 14. V. A. Kickhoefer, Y. Garcia, Y. Mikyas, E. Johansson, J. C. Zhou, S. Raval-Fernandes, P. Minoofar, J. I. Zink, B. Dunn, P. L. Stewart and L. H. Rome, Proceedings of the National Academy of Sciences of the United States of America, 2005, 102, 4348-4352.
15 15. C. Y. Lai, C. M. Wiethoff, V. A. Kickhoefer, L. H. Rome and G. R. Nemerow, ACS nano, 2009, 3, 691-699.
16 16. U. K. Kar, M. K. Srivastava, A. Andersson, F. Baratelli, M. Huang, V. A. Kickhoefer, S. M. Dubinett, L. H. Rome and S. Sharma, PloS one, 2011, 6, e18758.
17 17. A. Maham, Z. Tang, H. Wu, J. Wang and Y. Lin, Small, 2009, 5, 1706-1721.
18 18. E. J. Lee, N. K. Lee and I. S. Kim, Advanced drug delivery reviews, 2016, 106, 157-171. 19 19. G. Liu, J. Wang, H. Wu and Y. Lin, Analytical chemistry, 2006, 78, 7417-7423.
20 20. G. Liu, J. Wang, S. A. Lea and Y. Lin, Chembiochem : a European journal of chemical biology, 2006, 7, 1315-1319. 21 21. A. A. Aljabali, S. Shukla, G. P. Lomonossoff, N. F. Steinmetz and D. J. Evans, Molecular pharmaceutics, 2013, 10,
3-10.
22 22. Z. Zhen, W. Tang, H. Chen, X. Lin, T. Todd, G. Wang, T. Cowger, X. Chen and J. Xie, ACS nano, 2013, 7, 4830-4837. 23 23. K. M. Choi, K. Kim, I. C. Kwon, I. S. Kim and H. J. Ahn, Molecular pharmaceutics, 2013, 10, 18-25.
24 24. G. Destito, R. Yeh, C. S. Rae, M. G. Finn and M. Manchester, Chemistry & biology, 2007, 14, 1152-1162. 25 25. Y. Ren, S. M. Wong and L. Y. Lim, Bioconjugate chemistry, 2007, 18, 836-843.
26 26. G. J. Tong, S. C. Hsiao, Z. M. Carrico and M. B. Francis, Journal of the American Chemical Society, 2009, 131, 11174-11178.
27 27. F. Heitz, M. C. Morris and G. Divita, British journal of pharmacology, 2009, 157, 195-206.
28 28. L. C. Wyatt, A. Moshnikova, T. Crawford, D. M. Engelman, O. A. Andreev and Y. K. Reshetnyak, Proceedings of the
National Academy of Sciences of the United States of America, 2018, 115, E2811-E2818.
29 29. N. K. Lee, E. J. Lee, S. Kim, G. H. Nam, M. Kih, Y. Hong, C. Jeong, Y. Yang, Y. Byun and I. S. Kim, Journal of Controlled
Release, 2017, 267, 172-180.
30 30. R. C. Bast, Jr., M. Feeney, H. Lazarus, L. M. Nadler, R. B. Colvin and R. C. Knapp, The Journal of clinical investigation, 1981, 68, 1331-1337.
31 31. T. L. Klug, R. C. Bast, Jr., J. M. Niloff, R. C. Knapp and V. R. Zurawski, Jr., Cancer research, 1984, 44, 1048-1053. 32 32. A. Ravaioli, G. Pasini, A. Polselli, M. Papi, D. Tassinari, V. Arcangeli, C. Milandri, D. Amadori, M. Bravi, D. Rossi, P. P.
Fattori, E. Pasquini and I. Panzini, Breast cancer research and treatment, 2002, 72, 53-60. 33 33. B. W. Yin and K. O. Lloyd, The Journal of biological chemistry, 2001, 276, 27371-27375. 34 34. D. J. Gill, H. Clausen and F. Bard, Trends in cell biology, 2011, 21, 149-158.
35 35. G. Konska, J. Guillot, M. De Latour and Y. Fonck, International journal of oncology, 1998, 12, 361-367. 36 36. J. Liu, B. Yi, Z. Zhang and Y. Cao, Frontiers of medicine, 2016, 10, 204-211.
37 37. B. Liu, H. J. Bian and J. K. Bao, Cancer letters, 2010, 287, 1-12.
38 38. G. Poiroux, M. Pitie, R. Culerrier, E. Lafont, B. Segui, E. J. Van Damme, W. J. Peumans, J. Bernadou, T. Levade, P. Rouge, A. Barre and H. Benoist, PloS one, 2011, 6, e23315.
39 39. V. Trigueros, A. Lougarre, D. Ali-Ahmed, Y. Rahbe, J. Guillot, L. Chavant, D. Fournier and L. Paquereau, Biochimica et
biophysica acta, 2003, 1621, 292-298.
40 40. L. Damian, D. Fournier, M. Winterhalter and L. Paquereau, BMC biochemistry, 2005, 6, 11.
41 41. F. Francis, C. Marty-Detraves, R. Poincloux, L. Baricault, D. Fournier and L. Paquereau, European journal of cell
biology, 2003, 82, 515-522.
42 42. C. Birck, L. Damian, C. Marty-Detraves, A. Lougarre, C. Schulze-Briese, P. Koehl, D. Fournier, L. Paquereau and J. P. Samama, Journal of molecular biology, 2004, 344, 1409-1420.
43 43. J. Czaplicki, G. Cornelissen and F. Halberg, Journal of applied biomedicine, 2006, 4, 87-94. 44 44. O. Trott and A. J. Olson, Journal of computational chemistry, 2010, 31, 455-461.
45 45. G. M. Morris, R. Huey, W. Lindstrom, M. F. Sanner, R. K. Belew, D. S. Goodsell and A. J. Olson, Journal of
computational chemistry, 2009, 30, 2785-2791.
46 46. D. A. Case, T. E. Cheatham, 3rd, T. Darden, H. Gohlke, R. Luo, K. M. Merz, Jr., A. Onufriev, C. Simmerling, B. Wang and R. J. Woods, Journal of computational chemistry, 2005, 26, 1668-1688.
47 47. B. R. Miller, 3rd, T. D. McGee, Jr., J. M. Swails, N. Homeyer, H. Gohlke and A. E. Roitberg, Journal of chemical theory
and computation, 2012, 8, 3314-3321.
48 48. The PyMOL Molecular Graphics System, Version 1.3, Schrödinger, LCC.
Nanoscale
Accepted
Please do not adjust margins
49 49. P. Wu and L. Brand, Analytical biochemistry, 1994, 218, 1-13.
50 50. C. Czaplewski, S. Oldziej, A. Liwo and H. A. Scheraga, Protein engineering, design & selection : PEDS, 2004, 17, 29-36.
51 51. P. Emsley, B. Lohkamp, W. G. Scott and K. Cowtan, Acta crystallographica. Section D, Biological crystallography, 2010, 66, 486-501.
52 52. C. M. Yu, S. Mun and N. H. Wang, Journal of chromatography. A, 2006, 1132, 99-108. 53 53. S. Barranco-Medina and K. J. Dietz, Methods in enzymology, 2009, 466, 409-430.
54 54. S. D. Burrows, M. L. Doyle, K. P. Murphy, S. G. Franklin, J. R. White, I. Brooks, D. E. McNulty, M. O. Scott, J. R. Knutson, D. Porter and et al., Biochemistry, 1994, 33, 12741-12745.
55 55. M. Lovatt, A. Cooper and P. Camilleri, European biophysics journal : EBJ, 1996, 24, 354-357.
56 56. S. Vandenwijngaert, M. Swinnen, A. S. Walravens, M. Beerens, H. Gillijns, E. Caluwe, R. E. Tainsh, D. I. Nathan, K. Allen, P. Brouckaert, J. Bartunek, M. Scherrer-Crosbie, K. D. Bloch, D. B. Bloch, S. P. Janssens and E. S. Buys, Antioxidants &
redox signaling, 2017, 26, 153-164.
57 57. K. W. Chen, A. Gentry-Maharaj, M. Burnell, C. Steentoft, L. Marcos-Silva, U. Mandel, I. Jacobs, A. Dawnay, U. Menon and O. Blixt, J Proteome Res, 2013, 12, 1408-1418.
58 58. P. Mohan and N. Rapoport, Molecular pharmaceutics, 2010, 7, 1959-1973. 59 59. R. J. Lee, S. Wang, M. J. Turk and P. S. Low, Bioscience reports, 1998, 18, 69-78. 60 60. J. Murai, International journal of clinical oncology, 2017, 22, 619-628.
61