HAL Id: hal-01359994
https://hal.archives-ouvertes.fr/hal-01359994
Submitted on 5 Sep 2016
HAL is a multi-disciplinary open access
archive for the deposit and dissemination of
sci-entific research documents, whether they are
pub-lished or not. The documents may come from
teaching and research institutions in France or
abroad, or from public or private research centers.
L’archive ouverte pluridisciplinaire HAL, est
destinée au dépôt et à la diffusion de documents
scientifiques de niveau recherche, publiés ou non,
émanant des établissements d’enseignement et de
recherche français ou étrangers, des laboratoires
publics ou privés.
Research on tables and graphs in academic articles:
Pitfalls and promises
James Hartley, Guillaume Cabanac, Marcin Kozak, Gilles Hubert
To cite this version:
James Hartley, Guillaume Cabanac, Marcin Kozak, Gilles Hubert. Research on tables and graphs
in academic articles: Pitfalls and promises. Journal of the Association for Information Science and
Technology, ASIS&T/Wiley, 2015, 66 (2), pp.428-431. �10.1002/asi.23208�. �hal-01359994�
To link to this article :
DOI:10.1002/asi.23208
URL :
http://dx.doi.org/10.1002/asi.23208
To cite this version :
Hartley, James and Cabanac, Guillaume and
Kozak, Marcin and Hubert, Gilles Research on tables and graphs in
academic articles: Pitfalls and promises [Brief Communication].
(2015) Journal of the Association for Information Science and
Technology (JASIST), vol. 65 (n° 2). pp. 428-431. ISSN 2330-1635
O
pen
A
rchive
T
OULOUSE
A
rchive
O
uverte (
OATAO
)
OATAO is an open access repository that collects the work of Toulouse researchers and
makes it freely available over the web where possible.
This is an author-deposited version published in :
http://oatao.univ-toulouse.fr/
Eprints ID : 15157
Any correspondence concerning this service should be sent to the repository
administrator:
[email protected]
BRIEF COMMUNICATION
Research on Tables and Graphs in Academic Articles:
Pitfalls and Promises
James Hartley
School of Psychology, Keele University, Staffordshire ST5 5BG, United Kingdom. E-mail: [email protected]
Guillaume Cabanac
Computer Science Department, University of Toulouse, IRIT UMR 5505 CNRS, 118 route de Narbonne, Toulouse cedex 9 F-31062, France. E-mail: [email protected]
Marcin Kozak
Department of Quantitative Methods in Economics, Faculty of Economics, University of Information Technology and Management, Rzeszów, Sucharskiego 2, Rzeszów 35-225, Poland. E-mail: [email protected]
Gilles Hubert
Computer Science Department, University of Toulouse, IRIT UMR 5505 CNRS, 118 route de Narbonne, Toulouse cedex 9 F-31062, France. E-mail: [email protected]
Many papers have appeared recently assessing the effects of using tables and graphs in scientific publica-tions. In this brief communication, we assess some of the methodological difficulties that have arisen in this context. These difficulties encompass issues of data availability, suitability of indicators, nature and purpose of tables and graphs, and the role of supplementary information.
Introduction
There has been a flurry of recent research on tables and graphs in academic papers. The idea that such devices support scholarly communication is not new, but how they do it still needs to be studied further. These matters have been further complicated by technical possibilities arising from computer-based publishing, which support not only the construction of standard tables and graphs but also the con-struction of nonstandard ones. Interactive tables and graphs, for example, allow a reader to change the layout of a table or
graph to obtain additional information that is impossible to convey in static publishing. Thus counting tables and graphs and measuring their effects have become important topics in scholarly communication, a field of study that affects the development of every scientific discipline.
Some examples of recent research in this field can be listed as follows. Tartanus, Wnuk, Kozak, and Hartley (2013) showed that the more graphs there were in agricul-tural journals, the higher the journals’ impact factors. Hartley and Cabanac (2014) showed that men used more graphs than women in scientific articles but not in articles in the social sciences. Cabanac, Hartley, and Hubert (2014) showed that multiauthor papers featured more tables and graphs than did single-author papers in both social science and science journals. Hegarty and Pratto (2010) showed that the layouts of many graphs and tables were unwittingly sexist (with the results for men appearing on the left of or above the results for the women and, if colors were used, in blue and pink)!
These examples of research on tables and graphs in science communication are, of course, incomplete, but they reflect the diversity of this research. Here we do not wish to debate where this research will or should go. What we do wish to do, however, is to note that all of these studies have
something in common, and this is a concern with method-ological issues relating to how tables and graphs are counted and measured. Because such issues of measurement affect (sometimes strongly) the interpretations and conclusions drawn from research, we consider them in this brief com-munication as separate but important elements in this field. This article thus addresses several overlapping issues that provide difficulties for researchers in the field of counting tables and graphs. These issues include the following:
Issue 1. How to circumvent technical aspects of obtaining information on tables and graphs from scientific articles?
Issue 2. How to measure the sizes of tables and graphs, and thus by implication the amount of their contributions? Issue 3. How to distinguish between static and interactive
tables and graphs?
Issue 4. How to distinguish between the purposes of different forms of tables and graphs?
Issue 5. How to consider supplementary tables and graphs pub-lished online in addition to those within the main body of an article?
Issue 6. Are the statistically significant results obtained in these data of practical concern?
Issue 1: How To Circumvent Technical Aspects of Obtaining Information on Tables and Graphs From Scientific Articles?
Now that there are thousands of articles containing tables and graphs available electronically, it may seem easy to count them. All one has to do is to search for tables and graphs in an appropriate database. However, there are several difficulties here. First, we must have access to the full-text versions of these articles, which, in the case of some journals, requires a subscription. Second, even if we do have access, we usually cannot simply download thousands of articles without permission. However, there are at least two ways in which we can overcome these problems.
1. We can use preprint platforms (e.g., ArXiV,1
PeerJ Pre-Prints2) or articles published in open access journals (e.g., PLOS ONE3) that allow people to text-mine articles legally. Unfortunately, these platforms have only appeared recently, so they are not suitable for longitudinal studies.
2. We can file applications with major publishers, for example, to be granted the right to text-mine a subset of their library. For instance, Elsevier grants permission to authors through its Content Syndication (ConSyn) program4(e.g., as acknowledged in JASIST by Chen, Hu, Milbank, & Schultz, 2013). Elsevier also promotes text-mining research via its Bibliometric Research Program.5 CrossRef is also currently developing “a standard API to
retrieve the full text of scholarly documents for text and data mining” called Prospect.6
Next, so that we can easily count the numbers of tables and graphs, journals have to publish their articles in a markup language, such as XML or HTML, if we want to retrieve this information automatically. Other formats, such as PDF, may need to be processed by optical recognition software (OCR). Of course, manual counting is also possible (as was done by Tartanus et al., 2013). Although time-consuming and tedious, manual counting is most efficient for collecting precise data on tables and graphs (e.g., sizes, forms, variations, kinds of data the items represent, and so on).
Finally, there are different kinds of tables and graphs, and simply labeling them as one or the other does not take this complexity into account. Complexity is lost if we only use computer databases to search for items that are termed “tables” or “figures.” How do we distinguish between line-graphs, barcharts, photoline-graphs, and drawings—when they are all labeled “figures?” How do we count panels and/or boxes positioned in the text as opposed to those placed in Appendices? How do we discard authors’ pictures, as pub-lished in the biographies provided at the end of some articles?
Issue 2: How to Measure the Sizes of Tables and Graphs, and Thus by Implication the Amount of Their Contributions?
Tables (and graphs) differ in their size and in the amount of information they contain. Some “super” tables (Tufte, 1983, p. 179) can spread over two or three pages, and so can some trellis displays (Becker, Cleveland, & Shyu, 1996). In addition, how should we treat two identical graphs if one of them is simply made larger than the other by zooming out (which can be important when the proportion of the total page area devoted to graphs is employed as a measure of graph usage)? Two such graphs, although presenting the same amount of data, can provide different amounts of infor-mation: too small a graph can be difficult to read, but too large a graph can be irritating.
Cleveland (1984) devised ways of measuring the size of tables and figures by estimating (a) how many lines of text these features would need to be printed in prose and/or (b) the proportion of the total page area devoted to graphs in a particular document. Nonetheless, such methods are not often used today. Indeed, in our research (and in that of others), the numbers of tables and figures present in articles have simply been counted, without measuring their size, making our studies less refined than we would like.
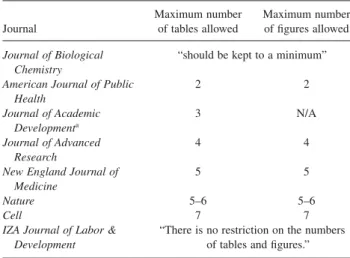
Furthermore, some journals limit the numbers of tables and graphs that authors can include in their articles. This might strongly affect research on the number of these items per article. Table 1 shows how these limitations can vary, but
1http://arxiv.org/
2https://peerj.com/preprints/ 3http://www.plosone.org/ 4http://consyn.elsevier.com/
electronic searches currently do not take this variation into account. Perhaps one should instead consider the ratio of the number of published items to the maximum number of pub-lished items in a given journal? To the best of our knowl-edge, this idea has not yet been discussed in the relevant literature.
Kozak (2009) and Kozak and Hartley (2012) discussed how small tables could be converted into what Tufte (1983, p. 178) called “text-tables” and presented in the text without being described, or printed, as a table. Table 1, for example, could be shortened and simply printed in the text as follows:
A range in the number of tables and figures that can be included in some journals is as follows:
Journal Maximum number of tables allowed Maximum number of figures allowed American Journal of Public Health 2 2 Journal of Advanced Research 4 4 Nature 5–6 5–6
How do we treat such text-tables? As regular tables? If so (recalling the first issue mentioned earlier), would an auto-matic retrieval of tables from scientific articles succeed in counting text-tables as tables?
Issue 3: How to Distinguish Between Static and Interactive Tables and Graphs?
As mentioned earlier, tables and graphs in computer-based texts can also be interactive. Their use is very different from that of static tables and graphs for various reasons.
Back in 1987, Becker and Cleveland (1987, p. 127) wrote, “It would be hard to overemphasize the importance of this new medium [high-interaction graphical methods] for data display.” An interactive table in which a reader can change the order of rows by just the click of a mouse can provide very different information from a static table representing the same data.
Although human−computer interaction is not new in the sciences (Dix, Finlay, Abowd, & Beale, 2004), research on interactive tables and graphs is new, and clearly inter-active tables and graphs should not be treated in the same way as static ones. Treating them as separate items is one thing, but methods of analyzing them is another. We are not aware of any study that has investigated interactive tables and graphs in the same way as the previously-cited studies on static items. At present this domain of research lacks its own specific methods, which, quite likely, will differ from those for static tables and graphs. Not only are interactive tables and graphs published in electronic format but they also offer various other possibilities, depending on the software used by the authors and the users.
Issue 4: How To Distinguish Between the Purposes of Different Forms of Tables and Graphs?
If counting the numbers of tables and graphs is difficult, what can we say about distinguishing between their actual purposes? There are several practical guides here (e.g., Adelheid & Pexman, 2010a,b; Few, 2012) as well as more academic texts (e.g., Harris, 1999; Kosslyn, 2006) and articles (e.g., Meyer, Shamo, & Gopher, 1999; Smith, Best, Stubbs, Archibald, & Roberson-Nay, 2002). Although tables seem more common than graphs, some authors suggest that transforming tables into graphs can lead to a better under-standing of the data (e.g., Gelman, Pasarica, & Dodhia, 2002; Kastellec & Leoni, 2007). This is undoubtedly true in some cases but surely not in all.
Most journals require data to be presented in either a table or a graph, but not in both. However, Kozak and Hartley (2013), against the recommendations of a referee, successfully used both a graph and a table from the same data set to illustrate different features of their data. Thus we need different ways of classifying tables and graphs accord-ing to their purpose.
Undoubtedly, some ways of tabulating and graphing data are better than others (see, for example, Kozak, Wnuk, Tartanus, & Hartley, 2012). Simply counting the numbers and sizes of tables and graphs cannot help us much in this regard, but maybe different forms of classification can. Adelheid and Pexman (2010a,b), for example, present 20 kinds of tables and 19 kinds of figures simply for people to copy in American Psychological Association (APA) journals, but others have produced more sophisticated schemes reflecting the purposes of these materials (e.g., Desnoyers, 2011).
TABLE 1. Examples of journals with restrictions on the numbers of tables and figures allowed in submitted articles.
Journal Maximum number of tables allowed Maximum number of figures allowed Journal of Biological Chemistry
“should be kept to a minimum”
American Journal of Public Health 2 2 Journal of Academic Developmenta 3 N/A Journal of Advanced Research 4 4
New England Journal of Medicine
5 5
Nature 5–6 5–6
Cell 7 7
IZA Journal of Labor & Development
“There is no restriction on the numbers of tables and figures.”
Note. The examples are selected to show the range of possibilities. The list is not exhaustive.
Issue 5: How To Consider Supplementary Tables and Graphs Published Online in Addition to Those Within the Main Body of an Article?
Borrego and Garcia (2013) studied 72 scholarly journals in library and information science, and 78% of these included supplementary materials. These materials contained summa-ries of the literature, usually in the form of tables, as well as additional results, usually in the form of tables and figures. Among these supplementary materials, about 35% of the articles included tables, about 11% presented illustrations, and about 11% included figures. Furthermore, many journals publish supplementary spreadsheet files that can also contain both tables and graphs. This leads to additional research problems with how they should be treated in comparison with regular tables published as supplementary materials. Issue 6: Are the Statistically Significant Results Obtained in These Data of Practical Concern?
Finally, practitioners should bear in mind that, although statistically significant results have been found in recent studies of tables and graphs, these findings might be attrib-utable largely to the high numbers of examples counted in some of these studies. Practically speaking, however, these differences are often very small. In the study reported by Cabanac et al. (2014), for example, the mean difference in the number of graphs produced by individuals compared with those produced by groups was only that of 0.99 graph. The practical importance of the findings also has to be con-sidered with regard to the research question at stake, a view expressed by many authors in the general context of inter-preting statistical analyses (e.g., Keen, 1992; Kozak, 2008; Reese, 2004; Schneider, 2013).
Concluding Remarks
The number and variety of issues raised in this paper on research with tables and graphs in academic articles show that methodological studies are needed. We do not claim that the list of problems we have raised is complete, but we do claim that these methodological gaps require attention. References
Adelheid, A.M.N., & Pexman, P.M. (2010a). Displaying your findings: A practical guide for creating figures, posters and presentations, 6th ed. Washington, DC: American Psychological Association.
Adelheid, A.M.N., & Pexman, P.M. (2010b). Presenting your findings: A practical guide for creating tables, 6th ed. Washington, DC: American Psychological Association.
Becker, R.A., & Cleveland, W.S. (1987). Brushing scatterplots. Techno-metrics, 29(2), 127–142. doi: 10.1080/00401706.1987.10488204 Becker, R.A., Cleveland, W.S., & Shyu, M.-J. (1996). The visual design and
control of trellis display. Journal of Computational and Graphical Sta-tistics, 5(2), 123–155. doi: 10.1080/10618600.1996.10474701 Borrego, Á., & Garcia, F. (2013). Provision of supplementary materials in
library and information science scholarly journals. Aslib Proceedings, 65(5), 503–514. doi: 10.1108/AP-10–2012-0083
Cabanac, G., Hartley, J., & Hubert, G. (2014). Solo versus collaborative writing: Discrepancies in the use of tables and graphs in academic
articles. Journal of the Association for Information Science and Technol-ogy, 65(4), 812–820.
Chen, C., Hu, Z., Milbank, J., & Schultz, T. (2013). A visual analytic study of retracted articles in scientific literature. Journal of the American Society for Information Science and Technology, 64(2), 234–253. doi: 10.1002/asi.22755
Cleveland, W.S. (1984). Graphs in scientific publications. The American Statistician, 38(4), 261–269. doi: 10.2307/2683400
Desnoyers, L. (2011). Toward a taxonomy of visuals in science communi-cation. Technical Communication, 58(2), 119–134.
Dix, A., Finlay, J.E., Abowd, G.D., & Beale, R. (2004). Human-computer interaction, 3rd ed. Essex, United Kingdom: Pearson Education. Few, S. (2012). Show me the numbers: Designing tables and graphs to
enlighten. Burlingame, CA: Analytics Press.
Gelman, A., Pasarica, C., & Dodhia, R. (2002). Let’s practice what we preach: Turning tables into graphs. The American Statistician, 56(2), 121–130. doi: 10.1198/000313002317572790
Harris, R.L. (1999). Information graphics: A comprehensive illustrated reference. New York: Oxford University Press.
Hartley, J., & Cabanac, G. (2014). Do men and women differ in their use of tables and graphs in academic publications? Scientometrics, 98(2), 1161–1172. doi: 10.1007/s11192-013-1096-3
Hegarty, P., & Pratto, F. (2010). Interpreting and communicating the results of gender-related research. In J.C. Chrisler & D.R. McCreary (Eds.), Handbook of gender research in psychology (pp. 191–211). New York: Springer. doi: 10.1007/978-1-4419-1465-1_10
Kastellec, J.P., & Leoni, E.L. (2007). Using graphs instead of tables in political science. Perspectives on Politics, 5(4), 755–771. doi: 10.1017/ S1537592707072209
Keen, E.M. (1992). Presenting results of experimental retrieval compari-sons. Information Processing & Management, 28(4), 491–502. doi: 10.1016/0306–4573(92)90006-L
Kosslyn, S.M. (2006). Graph design for the eye and mind. Oxford, United Kingdom: Oxford University Press.
Kozak, M. (2008). Correlation coefficient and the fallacy of statistical hypothesis testing. Current Science, 95(9), 1121–1122.
Kozak, M. (2009). Text-table: An under-valued and under-used tool for communicating information. European Science Editing, 35(4), 103– 105.
Kozak, M., & Hartley, J. (2012). Presenting numerical values within sen-tences and text tables. Journal of the American Society for Information Science and Technology, 63(1), 108–113. doi: 10.1002/asi.21623 Kozak, M., & Hartley, J. (2013). Publication fees for open-access journals:
Different disciplines—different methods [Brief Communication]. Journal of the American Society for Information Science and Technol-ogy, 64(12), 2591–2594. doi: 10.1002/asi.22972
Kozak, M., Wnuk, A., Tartanus, M., & Hartley, J. (2012). Key variables come first! How best to design a correlation table when there is one key variable. Journal of Information Science, 38(4), 399–403. doi: 10.1177/ 0165551512445159
Meyer, J., Shamo, M.K., & Gopher, D. (1999). Information structure and the relative efficacy of tables and graphs. Human Factors, 41(4), 570– 587. doi: 10.1518/001872099779656707
Reese, R.A. (2004). Does significance matter? Significance, 1(1), 39–40. doi: 10.1111/j.1740-9713.2004.00009.x
Schneider, J.W. (2013). Caveats for using statistical significance tests in research assessments. Journal of Informetrics, 7(1), 50–62. doi: 10.1016/ j.joi.2012.08.005
Smith, L.D., Best, L.A., Stubbs, D.A., Archibald, A.B., & Roberson-Nay, R. (2002). Constructing knowledge: The role of graphs and tables in hard and soft psychology. American Psychologist, 57(10), 749–761. doi: 10.1037/0003-066X.57.10.749
Tartanus, M., Wnuk, A., Kozak, M., & Hartley, J. (2013). Graphs and prestige in agricultural journals. Journal of the American Society for Information Science and Technology, 64(9), 1946–1950. doi: 10.1002/ asi.22868
Tufte, E.R. (1983). The visual display of quantitative information. Chesh-ire, CT: Graphics Press.