HAL Id: hal-01920572
https://hal.inria.fr/hal-01920572
Submitted on 13 Nov 2018
HAL is a multi-disciplinary open access
archive for the deposit and dissemination of
sci-entific research documents, whether they are
pub-lished or not. The documents may come from
teaching and research institutions in France or
abroad, or from public or private research centers.
L’archive ouverte pluridisciplinaire HAL, est
destinée au dépôt et à la diffusion de documents
scientifiques de niveau recherche, publiés ou non,
émanant des établissements d’enseignement et de
recherche français ou étrangers, des laboratoires
publics ou privés.
Integrated analysis highlights APC11 protein expression
as a likely new independent predictive marker for
colorectal cancer
Youenn Drouet, Isabelle Treilleux, Alain Viari, Sophie Léon, Mojgan
Devouassoux-Shisheboran, Nicolas Voirin, Christelle de la Fouchardiere,
Brigitte Manship, Alain Puisieux, Christine Lasset, et al.
To cite this version:
Youenn Drouet, Isabelle Treilleux, Alain Viari, Sophie Léon, Mojgan Devouassoux-Shisheboran, et al..
Integrated analysis highlights APC11 protein expression as a likely new independent predictive marker
for colorectal cancer. Scientific Reports, Nature Publishing Group, 2018, 8 (1),
�10.1038/s41598-018-25631-1�. �hal-01920572�
Integrated analysis highlights
APC11 protein expression as a likely
new independent predictive marker
for colorectal cancer
Youenn Drouet
1,2, Isabelle Treilleux
3, Alain Viari
4,5, Sophie Léon
3, Mojgan Devouassoux-
Shisheboran
6,7,8,9,10,11,12, Nicolas Voirin
1,13, Christelle de la Fouchardière
6, Brigitte Manship
6,
Alain Puisieux
6,7,8,9,10,11, Christine Lasset
1,2,9& Caroline Moyret-Lalle
6,7,8,9,10,11After a diagnosis of colorectal cancer (CRC), approximately 50% of patients will present distant metastasis. Although significant progress has been made in treatments, most of them will die from the disease. We investigated the predictive and prognostic potential of APC11, the catalytic subunit of APC/C, which has never been examined in the context of CRC. The expression of APC11 was assessed in CRC cell lines, in tissue microarrays (TMAs) and in public datasets. Overexpression of APC11 mRNA was associated with chromosomal instability, lymphovascular invasion and residual tumor. Regression models accounting for the effects of well-known protein markers highlighted association of APC11 protein expression with residual tumor (odds ratio: OR = 6.51; 95% confidence intervals: CI = 1.54–27.59; P = 0.012) and metastasis at diagnosis (OR = 3.87; 95% CI = 1.20–2.45; P = 0.024). Overexpression of APC11 protein was also associated with worse distant relapse-free survival (hazard ratio: HR = 2.60; 95% CI = 1.26–5.37; P = 0.01) and worse overall survival (HR = 2.69; 95% CI = 1.31– 5.51; P = 0.007). APC11 overexpression in primary CRC thus represents a potentially novel theranostic marker of metastatic CRC.
Colorectal cancer (CRC) is the third most frequent cancer and the fourth cause of cancer-related mortality world-wide1. Patient survival is highly dependent on the stage of CRC at the time of diagnosis but approximately 50%
of the patients will be concerned by distant metastasis development, either present at diagnosis (20%) or occur-ring after the curative-intent surgery of the primary tumor. The most frequent sites affected by metastatic CRC (mCRC) are the liver and lung1. The current first-line standard-of-care for mCRC relies on the combination of
cytotoxic chemotherapy (5FU/FA, oxaliplatin, irinotecan) and biologic agents (anti VEGF(R) or anti-EGFR mon-oclonal antibodies) guided by the molecular profile of the tumor. Surgery or local tumor ablation may also play a role in the treatment of mCRC patients, especially those with oligometastatic disease.
Several biomarkers, mostly predictive, are routinely used for mCRC2,3. Activating RAS mutations (KRAS and
NRAS), present in nearly 50% of mCRC cases, are negative predictive markers of anti-EGFR inhibitor efficacy
(cetuximab, panitumumab) and RAS testing is now mandatory in all mCRC patients, from the first-line meta-static setting. V600E-BRAF mutation is a significant negative poor-prognostic marker for patients with mCRC and may be a negative predictive factor for anti-EGFR therapies.
1Centre Léon Bérard, Département de Santé Publique, Lyon, F-69008, France. 2CNRS UMR 5558, Laboratoire de
Biométrie et Biologie Evolutive, Lyon, F-69373, France. 3Centre Léon Bérard, Service d’Anatomopathologie, Lyon,
F-69008, France. 4INRIA Grenoble-Rhône-Alpes, 655 Avenue de l’Europe, 38330, Montbonnot, Saint Martin, France. 5Synergie Lyon Cancer, Plateforme de Bioinformatique ‘Gilles Thomas’ Centre Léon Bérard, Lyon, France. 6Centre
Léon Bérard, Lyon, F-69008, France. 7INSERM U1052, Cancer Research Center of Lyon, Lyon, F-69008, France. 8CNRS UMR 5286, Cancer Research Center of Lyon, Lyon, F-69008, France. 9Université de Lyon, Lyon, F-69622,
France. 10Université Lyon1, ISPB, Lyon, F-69008, France. 11LabEx DEVweCAN, Université de Lyon, F-69000, Lyon,
France. 12Hôpital de la Croix Rousse, Hospices Civils de Lyon, Lyon, F-69008, France. 13Hospices Civils de Lyon,
Hôpital Edouard Herriot, Service d’Hygiéne, Epidémiologie et Prévention, Lyon, F-69437, France. Christine Lasset and Caroline Moyret-Lalle contributed equally to this work. Correspondence and requests for materials should be addressed to C.M.-L. (email: caroline.moyret-lalle@lyon.unicancer.fr)
Received: 1 November 2017 Accepted: 17 April 2018 Published: xx xx xxxx
www.nature.com/scientificreports/
Biomarkers of chemotherapy sensitivity and toxicity including DPD (Dihydro Pyrimidine Dehydrogenase) and UGT1A1 (UDP-Glucuronosyl Transferase 1A1) are optionally evaluated in the management of patients with mCRC4. Other biomarkers like APC or TP53 are not routinely used for a prognostic or therapeutic purpose in
mCRC5,6. Immune checkpoint (PD1-PDL1) inhibitors have also given rise to interesting results in high level
microsatellite instability (MSI-H) mCRC patients7,8. Despite these improvements, the median overall survival for
mCRC patients is limited, reaching 30 months in hyperselected patients9–11.
More recently, a molecular re-classification of CRCs, namely the consensus molecular subtypes (CMS), has been developed by Guinney and colleagues12. Of these new categories, CMS1 appears to represent the previously
designated microsatellite-instable (MSI) subtype, while the “canonical” (CMS2) and “mesenchymal” (CMS4) subtypes most likely encompass the previously described chromosomal instability (CIN) or microsatellite-stable (MSS) subtypes. A final category, the “metabolic” (CMS3), shows a disruption of metabolic pathways that con-tains KRAS activating mutations known to induce metabolic adaptation. The CMS2 and CMS4 subtypes interest-ingly display elevated somatic copy number alterations (SCNA) and cell cycle mRNA gene set over enrichment for the CMS2, similar to the MSS subtype characterized by aneuploidy, multiple chromosomal rearrangements and an accumulation of somatic mutations12.
It is now admitted that these chromosomal instabilities and ensuing CIN+/SCNA+ tumors may arise from dysregulated cell cycle mechanisms, such as the proteolysis of key cell cycle elements (mitotic oscillators)13,14.
Indeed, cell division, including mitosis, is governed by the degradation of different regulatory proteins by ubiquitin-dependent proteolysis. The anaphase-promoting complex/cyclosome (APC/C) is a specific E3 ubiquitin ligase complex that is essential for chromosome segregation, exit from mitosis, and the subsequent stable isolation of the G1 phase to control entry into the S phase (Fig. 1)15. More recently, APC/C has been involved in regulation
of genomic integrity, apoptosis, metabolism, neurodifferentiation and development through degradation of spe-cific proteins16,17. Mitotic cyclins and securin are key proteosomal targets of APC/C and known to be dysregulated
in cancer. Abnormal expression of cyclin B1 or securin is considered to be a major factor in the development of polyploidy18,19. APC/C is a large multiprotein E3 ligase complex which consists of three sub-complexes16: the
cat-alytic one contains APC2, APC10 and the RING-H2 finger protein APC11, the scafolding subcomplex platform corresponds to APC1, APC4 and APC5 subunits and a tetratricopeptide repeat (TPR) arm composed of APC3, APC6, APC7 and APC8 subunits, interacting with one of the two co-activators (Cdc20 or Cdh1). On the plat-form, the APC1 subunit represents the bridge between the catalytic portion and the TPR arm. The activity of the Figure 1. Regulation and function of APC/C. The activator of APC/C, CDC20 (cell division cycle 20) is inhibited by MCC (Mad2, BubR1, Mad1, Mad3) sequestration until all of the spindles have attached to kinetochores at metaphase; this system is referred to as the SAC (spindle activated checkpoint). Once all of the chromosomes are bi-orientated on a metaphase plate, the SAC is extinguished. Release from SAC activates APC/CCDC20. APC2/APC11 catalytic E3 sub-complex activity promotes proteolysis by poly-ubiquitination of APC/C targets, such as cyclin B, leading to anaphase onset. APC/C then switches its activator from CDC20 to Cdh1. The newly formed APC/CCdh1 complex drives mitotic exit by targeting CDC20 for destruction. During the G1 phase, APC/CCdh1 targets several regulators of DNA replication, such as Geminin. After the degradation of its substrates in G1, APC/C catalyzes the auto-ubiquitination of the APC11 subunit, which confers E3 activity, and its E2 ubiquitin-conjugating enzyme UbcH10, leading to APC/CCdh1 inactivation.
complex and recruitment of substrates are dependent on the co-activator subunit. Mechanistically, it was shown that a heterodimeric complex of APC2 and APC11 is sufficient to catalyze the ubiquitination of human securin and cyclin B120 with APC11 regulating the interface with E2 enzymes21. The activity of the APC/C complex is
repressed by the mitotic checkpoint complex (MCC) composed of at least four subunits, including Mad2, Bub3 and BubR1 which sequesters the Cdc20 subunit and induces the spindle activated chekpoint (SAC)22. Alterations
in MAD2, BUBR1 and BUB1 expression were reported in cancer, and inherited mutations in the BUBR1 gene are proposed to cause CIN and to predispose to cancer23. After long considering the SAC as a safeguarding
mecha-nism, it is now admitted that a sustained SAC may lead alternatively to cell death or aneuploidy. A better under-standing of the co-activator function stressed the Janus face of APC/C in cancer with Cdc20 playing a pro-tumor role in numerous cancer types including CRC24, while Cdh1 is now considered as a tumor suppressor25,26. To date,
very few studies have reported alterations in the APC/C core subunits in cancer26–28. Our group was the first to
determine the gene status of nine APC/C subunits (APC2, APC3, APC4, APC5, APC6, APC7, APC8, APC10 and
APC11) in cancer cells of different human tissue origins, and identified the presence of several heterozygote
muta-tions in platform and TPR arm subunits genes (APC4, APC6 and APC8) in cell lines of CRC origin25. We have
shown that the transient expression of a truncated mutant of APC8 subunit leads to abnormal levels of APC/C targets such as cyclin B1 and disturbs the cell cycle progression of colon epithelial cells through mitosis25. Further
investigation of the APC/C subunits mRNA expression revealed a significant association of APC11 expression with the CRC cell lines (data not shown). The APC11 subunit appears of particular interest since it plays a central role in binding to the acceptor ubiquitin and enhances diubiquitin formation by the E2 protein Ube2S21. Very
recently, Sansregret et al.28 have reported a total of 132 missense mutations in APC/C subunits in cancer with the
vast majority of them (93) affecting APC/C structure’s subunits while only 3 out of 132 occurred in the APC11 gene. Moreover, in contrast to the other catalytic core subunit APC2, which was shown to be down-regulated in various cancer types, APC11 expression has never been investigated previously in cancer.
In the current study, based on different mRNA and protein expression analyses (RT-qPCR, western blot, TMA of 82 primary colorectal cancer tissues, CCLE29 and TCGA30 datasets), we aimed at delineating the involvement of
APC11 expression in CRC tumorigenesis. Overexpression of APC11 is significantly correlated with chromosomal instability (while no association was found for the expression of the other catalytic subunits APC2 and APC10). A significant association is observed between APC11 expression and lymphovascular invasion and residual tumor. High levels of APC11 protein in primary colorectal tumors is specifically correlated with metastasis at diagno-sis. Using multifactorial analyses and multivariable regression models we also show, that alongside well-known markers involved in CRC tumorigenesis, namely Ki67, p53, E-cadherin, Bcl2, MLH1, MSH2, and DCC26, APC11
appears as an independent and potentially important new predictive factor.
Results
APC11 expression in CRC cell lines.
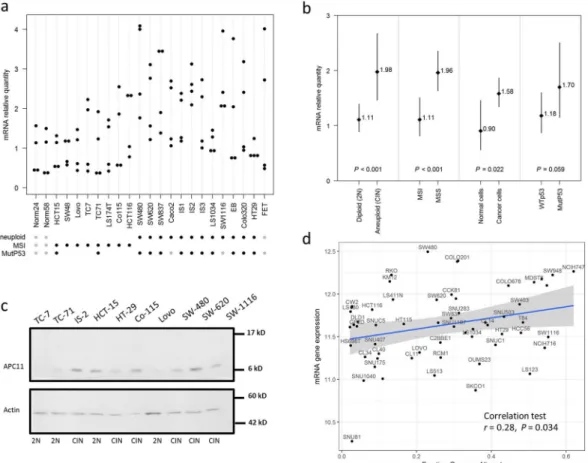
mRNA expression. We assessed the expression of APC11, thecat-alytic subunit of APC/C, in 21 CRC cell lines by RT-qPCR. We found a significant association between APC11 mRNA expression levels and ploidy/microsatellite status (Fig. 2a,b). Indeed, a significantly higher mean APC11 mRNA expression was observed in aneuploid compared to diploid and near diploid colon cancer cell lines (CIN: mean mRNA = 1.904; 95% CI = 1.386–2.616; vs. Diploid: mean mRNA = 0.999; 95% CI = 0.774–1.291; P for comparison <0.001), and MSI cell lines exhibited a lower mean level of APC11 (MSI: mean mRNA = 1.11; 95% CI = 0.817–1.508; vs. MSS: mean mRNA = 1.962; 95% CI = 1.635–2.355; P for comparison <0.001). Mean lev-els of APC11 mRNA in cancer cells were also higher than in immortalized epithelial cells (normal cells: mean mRNA = 0.904; 95% CI = 0.561–1.458; vs. cancer cells: mean mRNA = 1.583; 95% CI = 1.344–1.864; P for com-parison = 0.022). Though not statistically significant, the expression of APC11 also appeared to be associated with
TP53 gene status with mutated TP53 cell lines exhibiting higher mean levels of APC11 mRNA than TP53 WT
(mutated TP53: mean mRNA = 1.70; 95% CI = 1.152–2.507; vs. TP53 WT: mean mRNA = 1.18; 95% CI = 0.872– 1.60; P for comparison = 0.059). Similar observations were made in the Cancer Cell Line Encyclopedia (CCLE) dataset29 (Fig. 2d), where a significant correlation was found between APC11 mRNA expression and the FGA
sta-tus (Fraction Genome Altered) in 59 CRC cell lines (r = 0.28, P = 0.034). No correlation with the FGA stasta-tus was observed for the other catalytic subunits APC2 and APC10 (Supplemental Fig. S1). Akin results were obtained when restricting the analysis to the subset of the 42 TP53 wild-type-expressing CRC cell lines (data not shown). Moreover, no correlation was found between TP53 mutational status and APC11 mRNA expression in CCLE dataset (Supplemental Fig. S4a).
Protein expression. Semi-quantitative Western blot analysis of APC11 protein levels in colon cancer cell lines
revealed a 60% concordance between mRNA and protein levels (Figs 2c and S2). Four out of the 6 aneuploid colon cancer cell lines displayed high levels of APC11 protein, while 3 out of the 4 diploid cell lines showed lower levels of APC11 protein, comparable to levels found in the immortalized epithelial cell line HME-1 (Figs 2c and S2).
Thus, APC11 expression is associated with chromosomal instability in CRC cell lines.
APC11 expression in primary colorectal tumors.
mRNA expression from TCGA datasets repository. Asignificant correlation between high expression of APC11 mRNA and high levels of FGA was observed in the primary CRC datasets from TCGA repository (r = 0.21, P < 0.001, Fig. 3a). The expression of APC10 mRNA was not significantly correlated with the FGA status, while decreased APC2 mRNA levels appeared associated with the extent of FGA, though not notably (APC10: r = −0.01, P = 0.73; APC2: r = −0.07, P = 0.076, Supplemental Fig. S3). Similar results were obtained when restricting the analysis to the subset of 506 samples harboring a TP53 wild-type gene status (data not shown). Moreover, no correlation was found between TP53 mutational status and
www.nature.com/scientificreports/
Clinical significance of mRNA expression. In TCGA CRC datasets, APC11 mRNA elevated levels were
signifi-cantly associated with lymphovascular invasion (P < 0.001, Fig. 3b) and with residual disease (P = 0.0071, Fig. 3c) but not with AJCC tumor stages (Fig. 3d). Overall survival analyses did not show any significance for APC11 mRNA expression as a predictive marker for patients with M0 or M1 disease (Fig. 3e,f). Similar analyses were performed for APC10 and APC2 subunits. APC2 and APC10 mRNA levels were found associated with lympho-vascular invasion, but no correlation was observed with residual disease, AJCC tumor stage, and overall survival, either for APC10 or APC2 (Supplemental Figs S5 and S6).
Protein expression in a series of 82 patients with primary CRC. The expression of the E3 ligase catalytic subunit
APC11 protein was investigated using TMA consisting of 486 samples, including 191 pairs of cancer samples and corresponding normal mucosa26. Owing to a lack of clear staining of certain samples, only 82 tumor samples were
deemed reliable and were analyzed. Examples of IHC results are shown in Fig. 4. Analysis of normal mucosa tis-sues revealed a uniform expression of the APC11 protein in the cytoplasm of luminal cells (corresponding to 50% stained cells) and a heterogeneous expression in myoepithelial or in stromal cells (Fig. 4a). In CRC cells, APC11 showed variable expression patterns; some tumors were negative for APC11 staining, others displayed a lower percentage of labeled cells (<50% stained cells), whereas others yet showed a higher percentage of stained cells than normal tissues (>50% stained cells) (Fig. 4b).
Hence, expression of the APC11 protein appears to be dysregulated in this cohort of primary colorectal tumors. Figure 2. APC11 expression in CRC cell lines and statistical correlations with clinical and biological features. (a) Relative levels of APC11 mRNA were measured using real-time RT-PCR. The ratios of APC11/reference genes of four independent RT-PCR are depicted individually in the figure. Individual cell lines genetic status is indicated by dots at the bottom of the panel, grey dots indicate missing data. (b) The results of the statistical analysis of the individual data presented in panel (a) are displayed using a graphical representation. For each case, the number indicates the mean expression and the bars the 95% confidence intervals estimated by a random effects model. (c) Western blot analysis in colon cancer cell lines. The signal intensity of APC11 was normalized against actin. In the figure, are reported the cropped gel/blots for each protein evaluation. The black boxed indicate the cropped regions. Uncropped full-length gel/blots are presented in Fig. S2 (see Supplemental information). Relative protein expression was estimated using the Quantity One software (BioRad, Marnes-la-Coquette, France). (d) APC11 mRNA expression in 59 CRC cell lines from CCLE according to the fraction of genome altered (FGA) calculated with a threshold value of 0.3. The coefficient of correlation r is displayed with the corresponding P value; The regression line from a linear model (blue line) and its 95% confidence interval (grey area) are also displayed. Abbreviations: MSS, microsatellite stable; MSI, microsatellite instable.
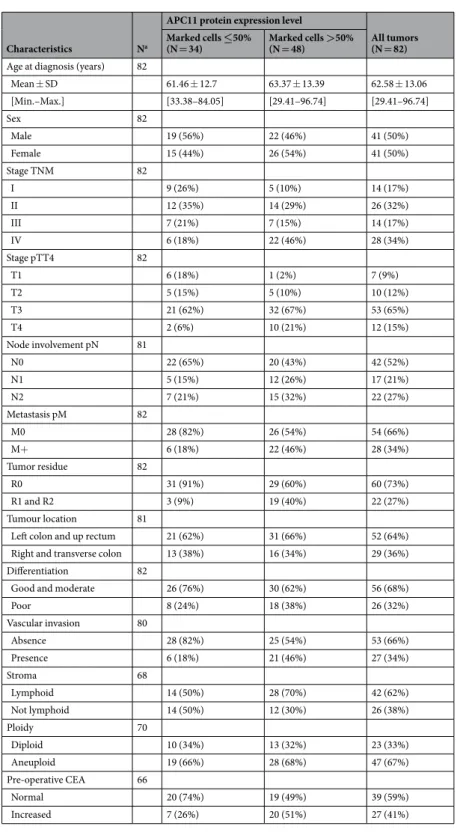
Clinical significance of protein expression. Baseline characteristics of the series of 82 patients stratified
accord-ing to their APC11 expression level are given in Tables 1 and 2. Mean age at CRC diagnosis was 62 years, with approximately half of the patients diagnosed with nodal involvement and one third with metastases. As expected, no apparent selection bias was found by comparing the 82 and 109 patients who could and could not be charac-terized based on APC11 tumor expression (Table S1).
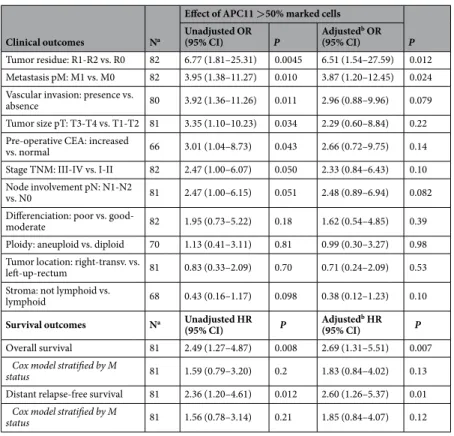
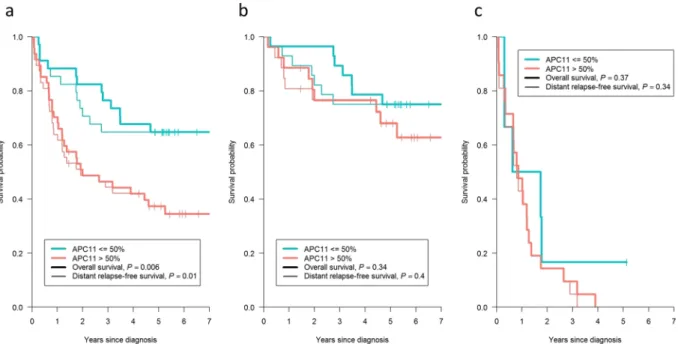
Unadjusted and adjusted logistic regression models (Table 3) identified likely statistical associations between elevated APC11 protein expression (>50% marked cells) and the presence of tumor residue after surgery (adjusted Odds ratio, OR = 6.51; 95% CI = 1.54–27.59; P = 0.012), metastasis at diagnosis (adjusted OR = 3.87; 95% CI = 1.20–12.45; P = 0.024), and indicated possible associations with vascular invasion (adjusted OR = 2.96; 95% CI = 0.88–9.96; P = 0.079), node involvement (adjusted OR = 2.48; 95% CI = 0.89–6.94; P = 0.082), TNM stage (adjusted OR = 2.33; 95% CI = 0.84–6.43; P = 0.10), pre-operative CEA (adjusted OR = 2.66; 95% CI = 0.72–9.75; P = 0.14) and tumor size (adjusted OR = 2.29; 95% CI = 0.60–8.84; P = 0.22). Of note, the adjusted ORs were slightly lower but remained close to unadjusted ORs, suggesting the relative independence of APC11 compared to the combined effect of the other protein markers. Survival analyses showed that patients with a high level of APC11 protein expression also had a worse overall survival (OS) (adjusted Hazard ratio, HR = 2.69; 95% CI = 1.31–5.51; P = 0.007) and a worse distant relapse-free survival (DRFS) (adjusted HR = 2.60; 95% CI = 1.26–5.37; P = 0.01) (Table 3 and Fig. 5a). However, Cox models stratified according to the presence of metastasis at diagnosis (Table 3) and Kaplan Meier graphs separating patients with M0 disease (Fig. 5b) from patients with M1 disease (Fig. 5c) showed that these poorer survival rates in patients with elevated APC11 levels probably came from their metastatic statuses at diagnosis rather than metastatic relapses.
In order to supplement the above results obtained from logistic regression models, we also performed a Multiple Correspondence Analysis (MCA), which offered a remarkable picture highlighting the correlations Figure 3. APC11 mRNA expression in primary CRC from the TCGA repository and statistical correlations with clinical and biological features. Data of the TCGA READ cohort (rectum adenocarcinoma, N = 174) and the TCGA COAD cohort (colon adenocarcinoma, N = 499) were combined. (a) APC11 mRNA expression according to the fraction of genome altered (FGA) calculated with a threshold value of 0.2. The coefficient of correlation r is displayed with the corresponding P value. The regression line from a linear model (blue line) and its 95% confidence interval (grey area) are also displayed. Panels (b–d) show respectively the APC11 mRNA expression according to lymphovascular invasion, residual tumor status, and AJCC tumor stage. Panels (e–f) show the Kaplan-Meier curves of overall survival according to APC11 mRNA expression stratified using quantiles, for patients with M0 disease (N = 457, panel e) and patients with M1 disease (N = 86, panel f).
www.nature.com/scientificreports/
between protein markers and clinicopathological data (Fig. 6). The 8 protein markers could be organized into two groups: the first being constituted of E-cadherin, Bcl2, MLH1, MSH2, DCC and P53 (principal contributors of Dim 1), and the second of APC11 and Ki67 (principal contributors of Dim 2). Interestingly, when projecting clinical and histopathological data, a diagonal of the disease’s severity emerged, ranging from good prognosis cri-teria projected in the top right-hand corner (e.g., T1-T2) to bad prognosis cricri-teria in the bottom left-hand corner (e.g., M1), illustrating that APC11 is correlated with clinical outcome independently of the other protein markers as previously suggested by multivariable regression models.
Association between protein levels and simplified CMS group classification. We designed a simplified classification
based on the molecular and clinical characterization of the CMS groups recently published by Guinney et al.12
(see Supplemental Methods for details). The resulting study-specific CMS classification is depicted in Table S3 and Fig. S7. OS and DRFS were worse for the study-specific CMS groups 1 and 4 (Fig. S8). The APC11 protein expression level was not associated with the study-specific CMS classification and thus appeared as a likely inde-pendent marker (Fisher’s exact test: P = 0.39, Table S3).
Discussion
In the present work we uncovered a novel and likely predictive marker of colorectal cancer, namely APC11, the key enzymatic subunit of the anaphase promoting complex, using an innovative integrated analysis incorporating relevant protein markers and clinical variables. Through multivariable regression models and multiple corre-spondence analysis (MCA), we evaluated the potential role of APC11 as a prognostic marker independent of 7 key CRC biomarkers. These included (i) MLH1 and MSH2, since they represent major markers for identifying MSI+ colorectal tumors. Indeed, it was previously shown that lower MLH1 and MSH2 protein levels were asso-ciated with reduced recurrence rates and better survival27. (ii) Deleted in colorectal cancer (DCC), the expression
of which is highly associated with the CIN genotype in CRC. As DCC is also subjected to epigenetic silencing31
and not only to loss of heterozygosity (LOH), it appears relevant to analyze its deregulation in CRC at the protein level. In colorectal tumorigenesis, loss of DCC expression follows the activation of the KRAS oncogene and is associated with a transition from intermediate adenoma to late adenoma32. DCC gene location corresponds to
one of the most frequent genetic abnormalities that occur in advanced CRC, namely LOH in the 18q21 region. However, the 18q allelic imbalance (AI) may be a non-specific surrogate marker for CIN making it difficult to take into account a lower expression pattern of DCC as a predictive biomarker. Different studies have demonstrated that CIN was associated with a worse prognosis in CRC33. (iii) P53 could be a relevant biomarker in CRC, since
mutations in TP53 gene resulting in protein overexpression, are frequently observed in CRC and often associ-ated with CIN. (iv) Cancer cell proliferation was assessed using the nuclear proliferation marker Ki67 protein Figure 4. Immunohistochemical analysis of APC11 protein expression in normal and colorectal cancer tissues. (a) APC11 staining is restricted to the cytoplasm of epithelial normal colon cells. (b) High APC11-intensity staining is seen in the cytoplasm of colorectal cancer cells. The images are shown at 40X magnification.
expression. (v) Bcl2 protein expression, because it was surprisingly shown that low Bcl2 levels were correlated with an increase in the number of relapses in stage II CRC, and high levels of Bcl2 protein seem to be associated with slower local tumor growth34. (vii) Lastly, E-cadherin down-regulation was shown to be strongly associated
with the invasive potential of the tumor and mCRC35.
From our analyses, APC11 protein expression appeared to be independent of the other known protein mark-ers studied, and thereby might be a new independent predictive marker. Indeed, we found that patients exhibiting high levels of APC11 protein had poor clinical outcomes and survival rates, even after statistical adjustment for the effects of the other markers.
Characteristics Na
APC11 protein expression level
All tumors (N = 82) Marked cells ≤50%
(N = 34) Marked cells >50% (N = 48)
Age at diagnosis (years) 82
Mean ± SD 61.46 ± 12.7 63.37 ± 13.39 62.58 ± 13.06 [Min.–Max.] [33.38–84.05] [29.41–96.74] [29.41–96.74] Sex 82 Male 19 (56%) 22 (46%) 41 (50%) Female 15 (44%) 26 (54%) 41 (50%) Stage TNM 82 I 9 (26%) 5 (10%) 14 (17%) II 12 (35%) 14 (29%) 26 (32%) III 7 (21%) 7 (15%) 14 (17%) IV 6 (18%) 22 (46%) 28 (34%) Stage pTT4 82 T1 6 (18%) 1 (2%) 7 (9%) T2 5 (15%) 5 (10%) 10 (12%) T3 21 (62%) 32 (67%) 53 (65%) T4 2 (6%) 10 (21%) 12 (15%) Node involvement pN 81 N0 22 (65%) 20 (43%) 42 (52%) N1 5 (15%) 12 (26%) 17 (21%) N2 7 (21%) 15 (32%) 22 (27%) Metastasis pM 82 M0 28 (82%) 26 (54%) 54 (66%) M+ 6 (18%) 22 (46%) 28 (34%) Tumor residue 82 R0 31 (91%) 29 (60%) 60 (73%) R1 and R2 3 (9%) 19 (40%) 22 (27%) Tumour location 81
Left colon and up rectum 21 (62%) 31 (66%) 52 (64%) Right and transverse colon 13 (38%) 16 (34%) 29 (36%) Differentiation 82
Good and moderate 26 (76%) 30 (62%) 56 (68%)
Poor 8 (24%) 18 (38%) 26 (32%) Vascular invasion 80 Absence 28 (82%) 25 (54%) 53 (66%) Presence 6 (18%) 21 (46%) 27 (34%) Stroma 68 Lymphoid 14 (50%) 28 (70%) 42 (62%) Not lymphoid 14 (50%) 12 (30%) 26 (38%) Ploidy 70 Diploid 10 (34%) 13 (32%) 23 (33%) Aneuploid 19 (66%) 28 (68%) 47 (67%) Pre-operative CEA 66 Normal 20 (74%) 19 (49%) 39 (59%) Increased 7 (26%) 20 (51%) 27 (41%)
Table 1. Clinical and histopathological characteristics at diagnosis of our series of 82 patients with colorectal cancer, stratified by APC11 expression level. aNumber of patients with available data.
www.nature.com/scientificreports/
Guinney et al.12 proposed to categorize CRC into 4 consensus molecular subtypes (CMS); the CMS1 (14%)
called MSI-like corresponds to CRC tumors with mutations in mismatch repair (MMR) genes, such as MLH1 and is also enriched in the CpG island methylation phenotype (CIMP). CMS1 displays mutations in the BRAF gene, shows strong immune activation and infiltration, and worse survival after relapse. The CMS2 subtype, called canonical (37%), contains tumors of epithelial phenotype exhibiting CIN, with WNT and Myc activation. The CMS3 subtype, called metabolic (13%), corresponds to tumors with an epithelial phenotype and dysregulations in their metabolic pathways, and is enriched in KRAS mutations and a mixed MSI+/CIN genetic status. Finally, the CMS4 subtype, called mesenchymal (23%), frequently harbors a CIN genetic status, displays prominent TGF β pathway activation, stromal infiltration, angiogenesis and worse OS and relapse free-survival (RFS). Here, we designed a study-specific CMS classification, compiling and selecting 12 discriminating binary key elements of the CMS classification (Table S2). Our results suggest that the expression of the APC11 protein in primary CRC might be independent of the CMS subtypes (Table S3). Moreover, our study-specific CMS subtyping for OS and DRFS match the OS and RFS presented by Guinney et al.12 for CMS 2, 3 and 4, but not for CMS1. As in our study
DRFS encompasses both RFS and SAR (survival after relapse), which are considered separately in Guinney et
al., this may explain the divergence between the two studies. This discrepancy might also be due to
misclassi-fications in our study-specific CMS subtyping. Notably, our study-specific CMS classification resulted in 21% of “Indeterminate” tumor samples compared to only 7% in the work by Guinney et al. (See Supplemental data). Evaluating the interest of APC11 with regards to the current CMS classification requires further studies and at this point, APC11 expression can’t be considered as a key element to refine or modify molecular CRC classification.
We also characterized the levels of APC11 regarding the chromosomal alterations status of CRC, includ-ing analyses of experimental data and public CCLE29 and TCGA30 datasets, and identified a strong correlation
between high levels of APC11 and chromosomal instability. In the CMS classification, enriched cell cycle and proteasome transcriptomic signatures were found both in the CMS2 canonical subtype (CIN) and in the CMS1 MSI immune subtype12. Over-enrichment of mutations in cancer drivers is seen in CMS1, with the exception of
the 2 tumor suppressor genes APC and TP53. APC mutations are significantly enriched in CMS2, while TP53 mutations are enriched both in CMS2 and CMS4 subtypes, highly associated with CIN status. Loss of the tumor suppressor APC leads to CIN by disrupting the function of the MCC and limiting kinetochore-microtubule interactions. The involvement of p53 in sensing mitotic failure has been largely described in particular in the regulation of MAD1 expression. Nevertheless, the relationship between p53 and APC/C was much less scru-tinized. Interestingly, it was shown that p53/p21-genotoxic stress induction at G2 phase triggers APC/C-Cdh1 activation17. APC/C-Cdh1 activation upon replication stress is also p53/p21-dependent36, and has been involved
in DNA damage response by shutting down DNA repair machinery after DNA repair completion17. In turn, as a
feedback mechanism, it was reported that APC/C-Cdc20 activates the degradation of p2137. These results suggest
that p53 inactivation may abrogate the APC/C-Cdh1 activation response and may render cancer cells more per-missive to Cdc20 overexpression. A recent study has shown that 39% (vs 28%) of tumors with an APC/C mutation
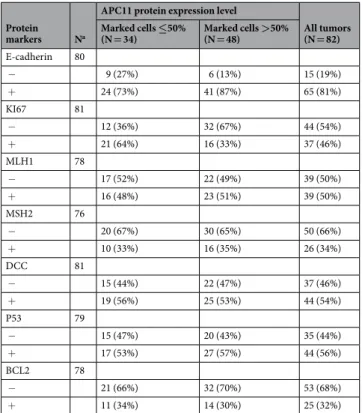
Protein
markers Na
APC11 protein expression level
All tumors (N = 82) Marked cells ≤50% (N = 34) Marked cells >50% (N = 48) E-cadherin 80 − 9 (27%) 6 (13%) 15 (19%) + 24 (73%) 41 (87%) 65 (81%) KI67 81 − 12 (36%) 32 (67%) 44 (54%) + 21 (64%) 16 (33%) 37 (46%) MLH1 78 − 17 (52%) 22 (49%) 39 (50%) + 16 (48%) 23 (51%) 39 (50%) MSH2 76 − 20 (67%) 30 (65%) 50 (66%) + 10 (33%) 16 (35%) 26 (34%) DCC 81 − 15 (44%) 22 (47%) 37 (46%) + 19 (56%) 25 (53%) 44 (54%) P53 79 − 15 (47%) 20 (43%) 35 (44%) + 17 (53%) 27 (57%) 44 (56%) BCL2 78 − 21 (66%) 32 (70%) 53 (68%) + 11 (34%) 14 (30%) 25 (32%)
Table 2. Immunohistochemistry characterization of the 82 colorectal cancer tissues, stratified by APC11 protein expression level. aNumber of patients with available data.
also harbors a TP53 mutation in a cohort of nine cancer types analysed28. In CRC cell lines, high expression of
APC11 appeared to be associated with mutated TP53 in our first analyses by RT-qPCR (P = 0.059), however this result could not be replicated in public datasets.
Alongside the presence of mutations, variation in some APC/C core subunits expression may disrupt the sto-chiometry of the complex thus affecting chromosome stability during tumor progression. Very few studies have reported alteration in APC/C core subunits expression in cancer. Shi and Huo38 have performed APC11 siRNA
in HEK293T cells and shown that reduced APC11 levels by over 50% led to a decrease number of cells in G2/M phase and a higher number in G1 phase, while overexpression of APC11 led to an increase in the number of cells in G2/M. Complete inhibition of APC/C core subunits expression has been shown to be detrimental for cell sur-vival as it was reported that KO models of the three catalytic subunits APC2, APC10 and APC11 were embryonic lethal39–41. Of note, complete ablation of APC/C activity causes cohesion fatigue in cells harboring a functional
SAC, which results in a mitotic cell death. Rather a complete inhibition of APC/C activity, a reduction in this ubiquitin ligase E3 activity in cancer cells together with SAC impairment may induce mild delays in mitosis. p53 inactivation and dysregulated APC/C may confer a selective advantage in SAC impaired tumors by reducing the rate of segregation errors to reach an equilibrium and to keep genomic instability at a sustainable ratio28.
Thus, APC/C alterations may occur late in tumor progression following CIN onset. Down or up-regulation of APC/C core subunits expression may have the same impact in cancer cells as it was reported that both CDC27 overexpression and CDC27 haploinsufficiency in CRC are correlated with poor patient survival42. CDC27
haplo-insufficiency is one of the 23 cancer driver genes identified in CRC30,43. APC2 mRNA expression was also
inves-tigated in different types of cancer and decreased levels were associated with cancer progression44. It was shown
that APC2 deficiency results in mdm2 protein increased levels and subsequent p53 inactivation44. Very little is
known about APC/C subunits transcriptional regulation; interestingly Cdc20 was shown to be transcription-ally down-regulated by the tumor suppressor protein p53 upon DNA damage45. At post-transcriptional level,
SNW1 splicing factor regulates the splicing of both APC2 and APC11 pre-mRNA46. More studies have focused
on post-translational regulation of APC/C subunits and have demonstrated that APC/C is regulated by various post-translational modifications notably phosphorylation, sumoylation, and acetylation47–50. Interestingly, it was
shown that the Polycomb Repressive Complex 1 (PRC1) subunit PSC, involved in self-renewal of cancer stem cells, interacts specifically with APC11 to ubiquitylate cyclin B cooperatively51.
So far, no previous work has reported altered APC11 expression in cancer. Incorporating APC11 protein expression into a clinical context, may allow medical oncologists to refine the selection of CRC patients who might benefit from taxane chemotherapy, which previously failed to show therapeutic advantages when admin-istered randomly, irrespective of molecular signatures. Dysregulation of the APC/C destruction pathway in SAC efficient tumors might represent a potentially important cancer-specific therapeutic vulnerability. Indeed, APC11
Clinical outcomes Na
Effect of APC11 >50% marked cells
P Unadjusted OR (95% CI) P Adjusted b OR (95% CI) Tumor residue: R1-R2 vs. R0 82 6.77 (1.81–25.31) 0.0045 6.51 (1.54–27.59) 0.012 Metastasis pM: M1 vs. M0 82 3.95 (1.38–11.27) 0.010 3.87 (1.20–12.45) 0.024 Vascular invasion: presence vs.
absence 80 3.92 (1.36–11.26) 0.011 2.96 (0.88–9.96) 0.079 Tumor size pT: T3-T4 vs. T1-T2 81 3.35 (1.10–10.23) 0.034 2.29 (0.60–8.84) 0.22 Pre-operative CEA: increased
vs. normal 66 3.01 (1.04–8.73) 0.043 2.66 (0.72–9.75) 0.14 Stage TNM: III-IV vs. I-II 82 2.47 (1.00–6.07) 0.050 2.33 (0.84–6.43) 0.10 Node involvement pN: N1-N2
vs. N0 81 2.47 (1.00–6.15) 0.051 2.48 (0.89–6.94) 0.082 Differenciation: poor vs.
good-moderate 82 1.95 (0.73–5.22) 0.18 1.62 (0.54–4.85) 0.39 Ploidy: aneuploid vs. diploid 70 1.13 (0.41–3.11) 0.81 0.99 (0.30–3.27) 0.98 Tumor location: right-transv. vs.
left-up-rectum 81 0.83 (0.33–2.09) 0.70 0.71 (0.24–2.09) 0.53 Stroma: not lymphoid vs.
lymphoid 68 0.43 (0.16–1.17) 0.098 0.38 (0.12–1.23) 0.10
Survival outcomes Na Unadjusted HR
(95% CI) P Adjusted
b HR
(95% CI) P
Overall survival 81 2.49 (1.27–4.87) 0.008 2.69 (1.31–5.51) 0.007 Cox model stratified by M
status 81 1.59 (0.79–3.20) 0.2 1.83 (0.84–4.02) 0.13
Distant relapse-free survival 81 2.36 (1.20–4.61) 0.012 2.60 (1.26–5.37) 0.01 Cox model stratified by M
status 81 1.56 (0.78–3.14) 0.21 1.85 (0.84–4.07) 0.12
Table 3. Association of APC11 >50% with clinical and survival outcomes. aNumber of patients with available
data. bAdjusted ORs and HRs were obtained from multivariable logistic and Cox regression models including
APC11, E-cadherin, KI67, MLH1, MSH2, DCC, P53 and BCL2. Abbreviations: OR, odds-ratio; CI, confidence interval; HR, Hazard ratio.
www.nature.com/scientificreports/
Figure 5. Kaplan-Meier curves presenting the probability of CRC patient survival according to APC11 protein expression. (a) All patients (n = 81). (b) Patients with M0 disease (n = 54). (c) Patients with M1 disease (n = 27).
P values displayed were calculated by the log-rank test. M1: patients with metastasis at CRC diagnosis; M0:
patients without metastasis at CRC diagnosis.
Figure 6. Multiple Correspondence Analysis (MCA) of immunohistochemical and clinical data. The MCA suggests that protein expression of APC11 is independent of other protein markers (due to their orthogonal projection on the figure). As clinical data is projected on the diagonal, the MCA also suggests that APC11 is correlated with the clinical data independently of the other protein markers. Labels used: tumor residue: R0/ R1-R2; metastasis pM: M0/M1; vascular invasion: vasc+: presence/vasc−: absence; pre-operative CEA: cea+: increased/cea−: normal; node involvement pN: N0/N1-N2; stage TNM: I-II/III-IV; tumor size pT: T1-T2/ T3-T4; differentiation: diff−: poor/diff+: good-moderate; stroma: lymph+: lymphoid/lymph−: not lymphoid; ploidy: cin+: diploid/cin−: aneuploid; tumor location: right: right-transverse/left: left-up-rectum.
overexpression may lead to mitotic cell death of taxane-treated cancer cells, suggesting that high levels of APC11 may increase drug cytotoxicity. Giovinazzi et al.52 reported that proTAME APC/C inhibitor (inhibition of
bind-ing between core APC/C, Cdc20 and substrate) prohibited mitotic exit of paclitaxel treated cells. Sackton et al.53
revealed combined use of Apcin (disruption of the interaction between Cdc20 and substrate) and proTAME to increase duration of mitosis and block its exit. APC/C inhibitors therapies should be carefully considered since the APC/C inhibitor proTAME can rescue segregation errors in SAC impaired cells28,52. Conversely,
func-tional APC/C in SAC impaired tumors may increase CIN to a lethal level. Clinical management of CRC is still based on TNM classification for therapeutic decisions, and APC11 protein expression may thus provide a novel, cost-effective, immunohistochemistry-based means of improving personalized therapeutic strategies.
Methods
Cell lines.
Twenty-one different colon cancer cell lines were included in this study (Table S4). Twelve were obtained from the American Type Culture Collection (http://www.atcc.org), EB was kindly provided by Philip Shaw (IUP, Lausanne, Switzerland), and Co-115, Isreco1 (IS1), Isreco2 (IS2), Isreco3 (IS3), TC-7 and TC-71 by Richard Hamelin (INSERM, UMRS 938-Centre de Recherche Saint-Antoine, Paris, France). The cell lines IS1, IS2 and IS3 were derived from a primary colon carcinoma and from the corresponding liver and peritoneal metas-tases in the same patient, respectively54,55. Other cell lines were derived from human primary colon carcinomas.The HME-1 (normal human mammary epithelial) cell line was used as a control for RT-qPCR analyses (Lonza, Basel, Switzerland). Colorectal cell lines were cultured in Dulbecco’s Modified Eagle’s Medium (DMEM) with added fetal bovine serum, glutamine, penicillin and streptomycin, and were maintained in humidified 37 °C 5% CO2 incubators. Cells were grown to 90% confluence according to the ATCC protocols (http://www.atcc.org).
Total RNA isolation and cDNA synthesis. Total RNA was isolated from cells using TRI Reagent (Sigma Chemical
Co., Saint Louis, MO, USA). This RNA, which was largely free of contaminating DNA, was further purified using Phase-Lock gel tubes (Eppendorf, Le Pecq, France). Total RNA concentration was determined spectrophotomet-rically at 260 nm (Spectrophotometer UV-VIS, DU-700, Beckman Coulter Inc., Brea, California, USA), while RNA integrity was tested on a 1% agarose gel. cDNA was synthesized from 1 μg of total RNA using a first-strand cDNA synthesis kit (Amersham Pharmacia Biotech, Uppsala, Sweden), according to the manufacturer’s instruc-tions. Total RNAs from 2 normal adult colon tissues were obtained from the BioChain Institute (Newark, USA) and served as controls.
Real-time quantitative PCR (RT-qPCR) analysis. APC11 mRNA levels were assessed by conducting a two-step
RT-qPCR in a LightCycler (Roche Molecular Biochemicals, Applied Science, Basel, Switzerland). Specific primer pairs used for PCR amplification were available commercially (Roche Applied Biosystems). All reactions were performed in glass capillaries (Roche Molecular Biochemicals) using the LightCycler FastStart DNA Master PLUS SYBR Green I kit and deionized water as a negative control. The Thermocycling program was as follows: 95 °C for 10 min, (45 cycles) at 95 °C for 10 s, 55 °C for 10 s, 72 °C for 6 s, 45 °C to 95 °C by increments of 0.1 °C, followed by a cycle at 40 °C for 30 s. All standards and samples were analyzed in duplicate and experiments were repeated at least three times. Fluorescence data were analyzed with the LightCycler 4.0 software (Roche Applied Science, Basel, Switzerland). cDNA prepared from the HME-1 cell line served as a calibrator for all qPCR reactions. For relative quantification and normalization, the comparative Ct (or E- where E is the primer-dependent efficiency of the PCR) method was used. The Ct values of both the calibrator and the samples of interest were normalized using 3 housekeeping genes, PPIB, β-Actin and PGK. The primer pairs and probes were designed using the Universal Probe Library website (Roche Applied Science). Primers of each pair were located in different exons to avoid genomic amplification. Primer pairs are listed in Supplemental Table S5. For relative quantification and normali-zation, the following calculation was used:
∏
= − × −
N ETCpT C CpT S( ) ( ) (ERCpR S CpR C( ) ( )), (1)
in which N is the normalized ratio, E the efficiency, Cp the crossing point, T the target gene (APC11 with
E = 1.763), R the reference gene (PPIB with E = 2.000, ACTB with E = 1.920, PGK-1 with E = 1.994), C the
calibra-tor (HME-1) and S the unknown sample56. PCR efficiencies were calculated in triplicate using relative standard
curves derived from serial dilutions (from 1/6 to 1/60,000) of the calibrator.
Western blot analysis. Cell pellets were lyzed in RIPA buffer for 30 min on ice and then centrifuged 30 min
at 13,000 rpm at 4 °C. The protein concentration of the supernatant was determined by performing a Bradford assay using the Biorad Protein assay (Biorad, Marnes-la-Coquette, France) and BSA as a standard. Western blot analysis was performed as previously described57. APC11 antibodies (monoclonal antibodies (M01), clone
1B4-1A4 reference H00051529-M01, Abnova, Taipei, Taiwan) were diluted at 1/500 and β-actin antibodies (clone 14, Becton Dickinson) were diluted at 1/2,000. After 1 h incubation, membranes were washed 3 times with TBS 1X-Tween 0.5%. The secondary antibodies (P0217, Dako, Trappes, France) were diluted at 1/3,000 in the same buffer and incubated for 1 h. APC11 was detected at 9.8 kDa using the Lumi-LightPLUS (Roche, Applied Science, Basel, Switzerland).
Clinical samples and clinical data.
One hundred and ninety one colorectal samples were collected and arranged in tissue microarrays (TMAs), kindly provided by Dr Geneviéve Monges at the Department of Anatomic Pathology of the Paoli-Calmettes Cancer Centre (Comprehensive Cancer Center of Marseille, France). The samples were collected before therapy from 99 male and 92 female patients diagnosed with colorectal cancer between 1990 and 1998, who were undergoing surgery at the Paoli-Calmettes Centre. All of the patients gavewww.nature.com/scientificreports/
their informed consent before the removal of biological tissues for the purpose of research studies. Furthermore, the collection of human tissue samples received approval by the ethics committee“Comité de Protection des Personnes” (Paoli-Calmettes Cancer Centre of Marseille)26. Patient cohorts, tumor characteristics and
immu-nohistochemical covariates (E-cadherin, Ki67, MLH1, MSH2, DCC, p53 and Bcl2) were previously publis hed26,27,34,58,59. Information on the evolution of the tumor in terms of local or distant recurrences was registered
prospectively. Overall, complete IHC comparative data could only be obtained for 82 individuals. Normal colon tissue samples were obtained from the Institutional Biological Resources Department of the Centre Léon Bérard (Comprehensive Cancer Center of Lyon, France) (agreement number DC-2008-99). All experiments were per-formed in accordance with relevant guidelines and regulations.
Immunohistochemistry (IHC). Core specimens were taken in triplicate from formalin-fixed paraffin-embedded
colon tumors and were arranged into TMA blocks as previously described60. Normal colon tissue samples from
the Centre Léon Bérard were analyzed on full tissue sections. 5 μm TMA tissue sections were deparaffinized and rehydrated. The slides were then incubated in 5% hydrogen peroxide in sterile water to block the activ-ity of endogenous peroxidases. No antigen retrieval was performed for rabbit polyclonal anti-APC11 antibody (Ab133200, Abcam, Cambridge, UK). Slides were incubated for 1 h at room temperature with the primary anti-body diluted 1/50 in an antianti-body diluent solution (Chem Mate, Dako, Trappes, France). After rinsing in PBS, the slides were incubated with a biotinylated secondary antibody bound to a streptavidin peroxidase conjugate (Vectastain Elite ABC reagent Vector, Abcys, Paris, France). Bound antibody was detected by adding the sub-strate 3,3′-diaminobenzidine (LSAB+ subsub-strate kit for peroxidase, K675 Agilent Pathology Solutions). The sections were counterstained with hematoxylin. A pathologist and a technician analyzed IHC stained tissues independently. Both the intensity of cytoplasmic staining (3 grades) and the percentage of positive cells were assessed. The intensity of staining was graded on a 3 point scale from 0 to 2: “0” reflected lack of immunoreactiv-ity, “1” weak immunoreactivity and “2” strong immunoreactivity. Once the two investigators reached a consensus on some samples, they reviewed cases with discordant scores.
Public data from CCLE and TCGA repository.
Segmented copy-number data, mutation and mRNA expression data were obtained from the CCLE website29 for the 59 CRC cell lines with mRNA data available, andfrom the cBio Cancer Genomics Portal61 for the 174 rectal (READ) and 499 colon (COAD) tumour samples of
TCGA repository. Corresponding clinical data were extracted using the CGDS-R package provided by the cBio Cancer Genomics Portal to query the Cancer Genomics Data Server30.
Statistical analyses.
mRNA expression in cell lines experiments. The log2 mean mRNA expression of CRCcell lines was estimated using the following random effects model:
μ α ε
= + +
Y
log ( )2 ij i ij, (2)
in which Yij is the normalized APC11 RNA expression for measurement j of cell line i, μ is the overall mean across
all samples and replicates after log2 transformation, αi represents the random effects associated with cell lines and εij the unexplained error. The statistical significance of the αi term (i.e. biological variation) was estimated using
a forward likelihood profile analysis based on the likelihood ratio (LR) test. Estimations were conducted using the maximum likelihood method and the nlme library of the R software62. For likelihood ratio tests, the statistical
significance level was set at P < 0.05.
Analyses of IHC and clinical/histopathological data. The statistical association between the level of APC11 measured
by IHC and the clinical/histopathological data was assessed by logistic regression models, evaluating various clinical variables one after the other as the outcome variable (i.e., dependent variable), providing unadjusted odds-ratios (ORs) for the effect of APC11. Adjusted odds-ratios (ORs) were obtained by including 7 key biomarkers, namely E-cadherin, Ki67, MLH1, MSH2, DCC, p53 and Bcl2 as explanatory variables (i.e., independent variables) in the regression models. The positive threshold for APC11 protein expression was arbitrarily set at >50% marked cells, prior to any statistical analysis. Missing data were handled using list wise deletion for clinical/histopathological data (outcome variables) and using a multiple imputation approach for the 7 biomarkers used as adjustment vari-ables so that unadjusted and adjusted estimates were produced on the same series of patients63,64 (see details in the
Supplemental material). Kaplan-Meier curves and the log-rank test were performed to analyze OS and DRFS stratified according to the expression of APC11 and the metastatic status of patients at diagnosis. OS was defined as the time elapsed from initial diagnosis to the last observation or to death from CRC. DRFS was defined as the time elapsed from initial diagnosis to metastatic relapse or death from CRC, or last observation if the patient was alive without metastasis. Cox regression models were fitted to estimate the effect of APC11 on OS and DRFS by unadjusted and adjusted hazard ratios (HRs). A Multiple Correspondence Analysis (MCA) was performed to describe graphically and synthetically the correlations between protein data measured by IHC. Protein data were used as active variables whereas clinical and histopathological data were used as illustrative variables (i.e. not contributing to the construction of the dimensions) to offer a global and integrated picture of the protein and clinical/histopathological data.
Analyses in the CCLE and TCGA public datasets. The FGA (fraction genome altered) was calculated from
seg-mented copy-number data as the ratio of the sum of the lengths of all segments with signal above a predetermined threshold to the sum of all segment lengths. Due to contamination with non-tumour material in TCGA tumour samples, a threshold value of 0.2 was used for TCGA tumour samples and a threshold value of 0.3 was used for the CCLE cell lines which are purer65. Correlation between mRNA expression and the FGA was quantified with
the samples at the two extremes quartiles of the FGA (Q75 vs Q25). Sensitivity analyses were performed varying the threshold used for the FGA calculation from 0.1 to 0.6. Further analyses were carried out in the TCGA data. Kruskal-Wallis and Anova F-test were used to investigate statistical association between mRNA expression levels and tumour staging, lymphovascular invasion and residual tumor statuses. Kaplan-Meier curves and the log-rank test were performed to analyse Overall Survival (OS) stratified according to the expression of APC11 and the metastatic status of patients at diagnosis.
Data Availability Statement.
The datasets generated during and/or analysed during the current study are available from the corresponding author on reasonable request.References
1. Gustavsson, B. et al. A review of the evolution of systemic chemotherapy in the management of colorectal cancer. Clinical Colorectal Cancer 14, 1–10 (2015).
2. Armaghany, T., Wilson, J. D., Chu, Q. & Mills, G. Genetic alterations in colorectal cancer. Gastrointestinal cancer research: GCR 5, 19–27 (2012).
3. Nakamoto, K. et al. Expression of E-cadherin and KRAS mutation may serve as biomarkers of cetuximab-based therapy in metastatic colorectal cancer. Oncology Letters 5, 1295–1300 (2013).
4. Van Cutsem, E. et al. ESMO consensus guidelines for the management of patients with metastatic colorectal cancer. Annals of Oncology: Official Journal of the European Society for Medical Oncology 27, 1386–1422 (2016).
5. Emburgh, B. O. V. et al. Acquired RAS or EGFR mutations and duration of response to EGFR blockade in colorectal cancer. Nature Communications 7, ncomms13665 (2016).
6. Van Cutsem, E. et al. Imaging in Colorectal Cancer: Progress and Challenges for the Clinicians. Cancers 8 (2016).
7. Le, D. T. et al. PD-1 Blockade in Tumors with Mismatch-Repair Deficiency. New England Journal of Medicine 372, 2509–2520 (2015). 8. Overman, M. J. et al. Nivolumab in patients with metastatic DNA mismatch repair-deficient or microsatellite instability-high
colorectal cancer (CheckMate 142): an open-label, multicentre, phase 2 study. The Lancet. Oncology 18, 1182–1191 (2017). 9. Cremolini, C. et al. FOLFOXIRI plus bevacizumab versus FOLFIRI plus bevacizumab as first-line treatment of patients with
metastatic colorectal cancer: updated overall survival and molecular subgroup analyses of the open-label, phase 3 TRIBE study. The Lancet. Oncology 16, 1306–1315 (2015).
10. McLean, J. et al. Clinical Practice Patterns in Chemotherapeutic Treatment Regimens for Metastatic Colorectal Cancer. Clinical Colorectal Cancer 15, 135–140 (2016).
11. Ohhara, Y. et al. Role of targeted therapy in metastatic colorectal cancer. World Journal of Gastrointestinal Oncology 8, 642–655 (2016). 12. Guinney, J. et al. The consensus molecular subtypes of colorectal cancer. Nature Medicine 21, 1350–1356 (2015).
13. Keck, J. M. et al. Cyclin E overexpression impairs progression through mitosis by inhibiting APCCdh1. The Journal of Cell Biology
178, 371–385 (2007).
14. Lehman, N. L. et al. Oncogenic regulators and substrates of the anaphase promoting complex/cyclosome are frequently overexpressed in malignant tumors. The American Journal of Pathology 170, 1793–1805 (2007).
15. Schreiber, A. et al. Structural basis for the subunit assembly of the anaphase-promoting complex. Nature 470, 227–232 (2011). 16. Chang, L., Zhang, Z., Yang, J., McLaughlin, S. H. & Barford, D. Molecular architecture and mechanism of the anaphase-promoting
complex. Nature 513, 388–393 (2014).
17. Zhou, Z., He, M., Shah, A. A. & Wan, Y. Insights into APC/C: from cellular function to diseases and therapeutics. Cell Division 11, 9 (2016). 18. Kikuchi, I., Nakayama, Y., Morinaga, T., Fukumoto, Y. & Yamaguchi, N. A decrease in cyclin B1 levels leads to polyploidization in
DNA damage-induced senescence. Cell Biology International 34, 645–653 (2010).
19. Mora-Santos, M. et al. A single mutation in Securin induces chromosomal instability and enhances cell invasion. European Journal of Cancer (Oxford, England: 1990) 49, 500–510 (2013).
20. Tang, Z. et al. APC2 Cullin protein and APC11 RING protein comprise the minimal ubiquitin ligase module of the anaphase-promoting complex. Molecular Biology of the Cell 12, 3839–3851 (2001).
21. Kelly, A., Wickliffe, K. E., Song, L., Fedrigo, I. & Rape, M. Ubiquitin chain elongation requires E3-dependent tracking of the emerging conjugate. Molecular Cell 56, 232–245 (2014).
22. Izawa, D. & Pines, J. The mitotic checkpoint complex binds a second CDC20 to inhibit active APC/C. Nature 517, 631–634 (2015). 23. Suijkerbuijk, S. J. E. et al. Molecular causes for BUBR1 dysfunction in the human cancer predisposition syndrome mosaic variegated
aneuploidy. Cancer Research 70, 4891–4900 (2010).
24. Park, K.-H., Choi, S.-E., Eom, M. & Kang, Y. Downregulation of the anaphase-promoting complex (APC)7 in invasive ductal carcinomas of the breast and its clinicopathologic relationships. Breast Cancer Research 7, R238–R247 (2005).
25. Wang, Q. et al. Alterations of anaphase-promoting complex genes in human colon cancer cells. Oncogene 22, 1486–1490 (2003). 26. Bertucci, F. et al. Gene expression profiling of colon cancer by DNA microarrays and correlation with histoclinical parameters.
Oncogene 23, 1377–1391 (2004).
27. Sinicrope, F. A. et al. DNA mismatch repair status and colon cancer recurrence and survival in clinical trials of 5-fluorouracil-based adjuvant therapy. Journal of the National Cancer Institute 103, 863–875 (2011).
28. Sansregret, L. et al. APC/C Dysfunction Limits Excessive Cancer Chromosomal Instability. Cancer Discovery 7, 218–233 (2017). 29. Barretina, J. et al. The Cancer Cell Line Encyclopedia enables predictive modelling of anticancer drug sensitivity. Nature 483,
603–607 (2012).
30. The Cancer Genome Atlas Network. Comprehensive molecular characterization of human colon and rectal cancer. Nature 487, 330–337 (2012).
31. Shin, S. K. et al. Epigenetic and genetic alterations in Netrin-1 receptors UNC5c and DCC in human colon cancer. Gastroenterology
133, 1849–1857 (2007).
32. Rao, C. V. & Yamada, H. Y. Genomic instability and colon carcinogenesis: from the perspective of genes. Frontiers in Oncology 3, 130 (2013). 33. Lee, A. J. X. et al. Chromosomal instability confers intrinsic multidrug resistance. Cancer Research 71, 1858–1870 (2011). 34. Poincloux, L. et al. Loss of Bcl-2 expression in colon cancer: a prognostic factor for recurrence in stage II colon cancer. Surgical
Oncology 18, 357–365 (2009).
35. Choi, H. N. et al. Serum response factor enhances liver metastasis of colorectal carcinoma via alteration of the E-cadherin/beta-catenin complex. Oncology Reports 21, 57–63 (2009).
36. Ercilla, A. et al. New origin firing is inhibited by APC/CCdh1 activation in S-phase after severe replication stress. Nucleic Acids Research 44, 4745–4762 (2016).
37. Xie, Q. et al. CDC20 maintains tumor initiating cells. Oncotarget 6, 13241–13254 (2015).
38. Shi, Y.-J. & Huo, K.-K. Knockdown expression of Apc11 leads to cell-cycle distribution reduction in G2/M phase. Genetics and molecular research: GMR 11, 2814–2822 (2012).
39. Wirth, K. G. et al. Loss of the anaphase-promoting complex in quiescent cells causes unscheduled hepatocyte proliferation. Genes & Development 18, 88–98 (2004).
www.nature.com/scientificreports/
41. Wehman, A. M., Staub, W. & Baier, H. The anaphase-promoting complex is required in both dividing and quiescent cells during zebrafish development. Developmental Biology 303, 144–156 (2007).
42. Qiu, L. et al. Downregulation of CDC27 inhibits the proliferation of colorectal cancer cells via the accumulation of p21cip1/Waf1. Cell Death & Disease 7, e2074 (2016).
43. Lawrence, M. S. et al. Discovery and saturation analysis of cancer genes across 21 tumour types. Nature 505, 495–501 (2014). 44. He, Y., Tollini, L., Kim, T.-H., Itahana, Y. & Zhang, Y. The anaphase-promoting complex/cyclosome is an E3 ubiquitin ligase for
Mdm2. Cell Cycle 13, 2101–2109 (2014).
45. Banerjee, T., Nath, S. & Roychoudhury, S. DNA damage induced p53 downregulates Cdc20 by direct binding to its promoter causing chromatin remodeling. Nucleic Acids Research 37, 2688–2698 (2009).
46. van der Lelij, P. et al. SNW1 enables sister chromatid cohesion by mediating the splicing of sororin and APC2 pre-mRNAs. The EMBO journal 33, 2643–2658 (2014).
47. Peters, J.-M. The anaphase-promoting complex: proteolysis in mitosis and beyond. Molecular Cell 9, 931–943 (2002).
48. Peters, J.-M. The anaphase promoting complex/cyclosome: a machine designed to destroy. Nature Reviews. Molecular Cell Biology 7, 644–656 (2006).
49. Pesin, J. A. & Orr-Weaver, T. L. Regulation of APC/C activators in mitosis and meiosis. Annual Review of Cell and Developmental Biology 24, 475–499 (2008).
50. Pines, J. Cubism and the cell cycle: the many faces of the APC/C. Nature Reviews. Molecular Cell Biology 12, 427–438 (2011). 51. Mohd-Sarip, A. et al. Transcription-independent function of Polycomb group protein PSC in cell cycle control. Science (New York,
N.Y.) 336, 744–747 (2012).
52. Giovinazzi, S., Bellapu, D., Morozov, V. M. & Ishov, A. M. Targeting mitotic exit with hyperthermia or APC/C inhibition to increase paclitaxel efficacy. Cell Cycle 12, 2598–2607 (2013).
53. Sackton, K. L. et al. Synergistic blockade of mitotic exit by two chemical inhibitors of the APC/C. Nature 514, 646–649 (2014). 54. Gayet, J. et al. Extensive characterization of genetic alterations in a series of human colorectal cancer cell lines. Oncogene 20,
5025–5032 (2001).
55. Cajot, J. F., Sordat, I., Silvestre, T. & Sordat, B. Differential display cloning identifies motility-related protein (MRP1/CD9) as highly expressed in primary compared to metastatic human colon carcinoma cells. Cancer Research 57, 2593–2597 (1997).
56. Combes, J.-D. et al. Contribution of cell culture, RNA extraction, and reverse transcription to the measurement error in quantitative reverse transcription polymerase chain reaction-based gene expression quantification. Analytical Biochemistry 393, 29–35 (2009). 57. Grelier, G. et al. Prognostic value of Dicer expression in human breast cancers and association with the mesenchymal phenotype.
British Journal of Cancer 101, 673–683 (2009).
58. Sargent, D. J. et al. Defective mismatch repair as a predictive marker for lack of efficacy of fluorouracil-based adjuvant therapy in colon cancer. Journal of Clinical Oncology: Official Journal of the American Society of Clinical Oncology 28, 3219–3226 (2010). 59. Perrin, J. et al. MSH2 and MLH1 immunodetection and the prognosis of colon cancer. International Journal of Oncology 19, 891–895
(2001).
60. Ginestier, C. et al. Distinct and Complementary Information Provided by Use of Tissue and DNA Microarrays in the Study of Breast Tumor Markers. The American Journal of Pathology 161, 1223–1233 (2002).
61. Cerami, E. et al. The cBio cancer genomics portal: an open platform for exploring multidimensional cancer genomics data. Cancer Discovery 2, 401–404 (2012).
62. Pinheiro, J., Bates, D., DebRoy, S., Sarkar, D. & R Core Team. nlme: Linear and Nonlinear Mixed Effects Models R package version 3.1–131 (2017).
63. Josse, J., Chavent, M., Liquet, B. & Husson, F. Handling Missing Values with Regularized Iterative Multiple Correspondence Analysis. Journal of Classification 29, 91–116 (2012).
64. Rubin, D. B. (ed.) Multiple Imputation for Nonresponse in Surveys. Wiley Series in Probability and Statistics (John Wiley & Sons, Inc., Hoboken, NJ, USA, 1987).
65. Domcke, S., Sinha, R., Levine, D. A., Sander, C. & Schultz, N. Evaluating cell lines as tumour models by comparison of genomic profiles. Nature Communications 4, 2126 (2013).
Acknowledgements
The authors thank Geneviéve Monges for kindly providing TMA tissue sections; Eric Tabone for providing tumor biopsies; Emilie Thomas and Janice Kielbassa for bioinformatics process management; this research was supported by La Ligue Nationale Contre le Cancer (Grant R16186CC) and by PULSALYS (Grant 12L882LST).
Author Contributions
Conception or design of the work: Y.D., C.M.-L., C.L., A.P. Data acquisition: I.T., S.L., M.D., A.V. Statistical analysis: Y.D., N.V., A.V. Interpretation of data: Y.D., I.T., C.dlF., N.V., B.M., C.L, C.M.-L., A.V. Drafting the manuscript: Y.D. and C.M.-L. I.T., S.L., M.D., N.V., C.dlF., B.M., A.P., C.L., A.V. revised critically early version of the manuscript. All authors approved the final version to be published.
Additional Information
Supplementary information accompanies this paper at https://doi.org/10.1038/s41598-018-25631-1. Competing Interests: The authors declare no competing interests.
Publisher's note: Springer Nature remains neutral with regard to jurisdictional claims in published maps and institutional affiliations.
Open Access This article is licensed under a Creative Commons Attribution 4.0 International License, which permits use, sharing, adaptation, distribution and reproduction in any medium or format, as long as you give appropriate credit to the original author(s) and the source, provide a link to the Cre-ative Commons license, and indicate if changes were made. The images or other third party material in this article are included in the article’s Creative Commons license, unless indicated otherwise in a credit line to the material. If material is not included in the article’s Creative Commons license and your intended use is not per-mitted by statutory regulation or exceeds the perper-mitted use, you will need to obtain permission directly from the copyright holder. To view a copy of this license, visit http://creativecommons.org/licenses/by/4.0/.