READ THESE TERMS AND CONDITIONS CAREFULLY BEFORE USING THIS WEBSITE.
https://nrc-publications.canada.ca/eng/copyright
Vous avez des questions? Nous pouvons vous aider. Pour communiquer directement avec un auteur, consultez la première page de la revue dans laquelle son article a été publié afin de trouver ses coordonnées. Si vous n’arrivez pas à les repérer, communiquez avec nous à PublicationsArchive-ArchivesPublications@nrc-cnrc.gc.ca.
Questions? Contact the NRC Publications Archive team at
PublicationsArchive-ArchivesPublications@nrc-cnrc.gc.ca. If you wish to email the authors directly, please see the first page of the publication for their contact information.
NRC Publications Archive
Archives des publications du CNRC
This publication could be one of several versions: author’s original, accepted manuscript or the publisher’s version. / La version de cette publication peut être l’une des suivantes : la version prépublication de l’auteur, la version acceptée du manuscrit ou la version de l’éditeur.
Access and use of this website and the material on it are subject to the Terms and Conditions set forth at
Toward effective use of road foundation materials in urban pavements
Khogali, W. E. I.
https://publications-cnrc.canada.ca/fra/droits
L’accès à ce site Web et l’utilisation de son contenu sont assujettis aux conditions présentées dans le site LISEZ CES CONDITIONS ATTENTIVEMENT AVANT D’UTILISER CE SITE WEB.
NRC Publications Record / Notice d'Archives des publications de CNRC:
https://nrc-publications.canada.ca/eng/view/object/?id=562515d1-22b3-4909-9da3-2922bee456e2 https://publications-cnrc.canada.ca/fra/voir/objet/?id=562515d1-22b3-4909-9da3-2922bee456e2
Toward effective use of road foundation
materials in urban pavements
Khogali, W. E. I.
A version of this paper is published in / Une version de ce document se trouve dans : Annual Conference of the Transportation Association of Canada, Edmonton,
Alberta, 2000, pp. 1-15
www.nrc.ca/irc/ircpubs
TOWARD EFFECTIVE USE OF ROAD FOUNDATION MATERIALS IN URBAN PAVEMENTS
Walaa E.I. Khogali
National Research Council Canada, Institute for Research in Construction – Urban Infrastructure Rehabilitation Program, Canada
Paper prepared for presentation
at the Materials Testing – Innovative Methods and Applied Technology Session of the 2000 Annual Conference of the
Transportation Association of Canada Edmonton, Alberta
TOWARD EFFECTIVE USE OF ROAD FOUNDATION MATERIALS IN URBAN PAVEMENTS
ABSTRACT: The nature of road foundation materials plays a significant role in defining pavement behaviour under traffic loading. Currently, however, this role and its impact on road performance are not well established. This calls for the need to develop adequate characterization techniques for road materials. The requirement to consider relevant performance indicator(s) necessitates in the beginning reliance on a mechanical response. Mechanical responses are usually based on external loading conditions. In the case of a pavement structure, this translates into traffic and environmental conditions and constitutes an important input to the pavement design/rehabilitation process.
This paper presents recent developments in the area of road foundation materials characterization that is currently being pursued at NRC’s Institute for Research in Construction. A state-of-the-art laboratory facility was designed and built to develop effective measures to guard against road deterioration in the case of inadequate structural support provided to the asphalt surface. Using this facility, a silty sand material representing a typical subgrade and an unbound aggregate material commonly used in base and sub-base road layers were tested under various load and physical conditions.
Results obtained in the form of resilient moduli of the tested materials were analyzed using statistical techniques. The results highlighted the well-known need to control compaction quality of these road materials to effectively reduce the potential for premature failure. Furthermore, the results suggest the need for putting more emphasis on moisture effects than currently being considered. Current practice focuses on obtaining the highest possible percentage of relative field density with less emphasis being placed on controlling field moisture content. The results obtained from the mechanical test on both investigated materials show a significant drop in strength for an increase in moisture within commonly accepted ranges. These findings advocate the need to revisit the way that road foundation materials are characterized and the implication(s) that this may have on the design and rehabilitation of pavements.
1 INTRODUCTION
Within flexible pavement systems, road foundation materials commonly refer to the base, sub-base and subgrade layers that underlain asphalt concrete surface. In general terms, the functions of the base and sub-base course materials are to:
1. spread the wheel loads in order to reduce its intensity on the weak underlying subgrade; 2. provide a platform for construction equipment used during the building of the road;
3. provide support for the overlying asphalt concrete surface layer during the service life of the pavement;
4. act as drainage layer(s) to remove ingress water away from the pavement.
However, the role that road foundation materials play in defining pavement behaviour under traffic loading and its impact on road performance are still not well established. This is largely due to the inadequate measures we currently use to characterise the behaviour of these materials.
The traditional, and almost, universal parameter used to characterise road foundation materials for pavement design purposes is the California Bearing Ratio. This empirical index, at best, is an indirect measure of the undrained shear strength of the material, and as such can not
be used to simulate the effects of the traffic and environmental conditions that the road is subjected to. Alternatively, proper characterisation of the mechanical response of the materials under repeated traffic loading and in-situ environmental conditions is a true indicator of performance. Among the many parameters that exist today for characterization, the resilient modulus appears to be the most suitable candidate. This is due to the ability of this parameter to closely simulate the material in-situ conditions under traffic loading [1]. The resilient modulus, Mr, is a mechanical property of the material that describes its stress – strain relationship under
dynamic loading and specified physical conditions. In repeated triaxial load tests, Mr is defined
as the ratio of the peak cyclic deviator stress to the recoverable measured axial strain as given in equation 1 below.
Due to the non-linear behaviour of cohesive and granular materials, their resilient moduli appear to be influenced by several factors, some of which have been reported by Seed et al. [2] and other investigators [3-7]. The current paper describes a unique approach that is used to examine and quantify the effects of four of these factors on the resilient response of two road foundation materials.
The short-term goal of current study is to establish guidelines for a systematic and rational procedure for characterising road foundation materials utilising the resilient modulus test. Another, long-term objective is to develop constitutive material relations that can be used in the design and analysis of pavement structures. In the following sections, the details of a laboratory investigation and a description of a state-of-the-art test facility, which was designed and built at NRC’s Institute for Research in Construction, will be given. Using this facility, a silty sand material representing a typical subgrade and an unbound aggregate material commonly used in base and sub-base road layers were tested under various load and physical conditions. Description of the test facility is given in section 2, while the details of the laboratory investigation are given in section 3.
2 IRC TESTING FACILITY
The IRC Resilient Modulus Test System (RMTS) is a custom-designed and built testing facility for characterization of road foundation materials. The system’s hardware consists of two especially manufactured triaxial cells, a closed-loop servoelectric MTS loading system and a personal computer that controls the operation of the RMTS. One triaxial cell is used for testing cohesive materials and can accommodate cylindrical specimens that are 71mm in diameter by 142mm high. The other cell is used for testing granular materials with specimen size that is 150mm in diameter by 300mm high. Both cells are equipped with special sensors to measure both the vertical and radial deformations. Vertical displacements are measured with two linear variable differential transducers (LVDTs) that are internally mounted inside the triaxial chamber. Two non-contacting Inductive Gauging sensors (IGSs) that are placed diagonally opposite on two sides of the cylindrical specimen measure radial displacements. Figure 1 shows a schematic diagram for the 150mm-cell.
The MTS loading system applies a cyclic deviator stress that is representative of the actual traffic loading in the field. An internally mounted load cell that is placed on the top of the test specimen is used to record the applied cyclic load. During testing, the soil specimen is subjected to an all-around pressure to simulate the confinement that the material is subjected to in-situ. The
) 1 ( K K K K K K K K r d r M ε σ =
medium for the confining pressure can be air or any other fluid. This confining pressure is monitored and recorded by a pressure transducer that is externally mounted to the triaxial chamber.
3 LABORATORY INVESTIGATION 3.1 Material Selection and Properties
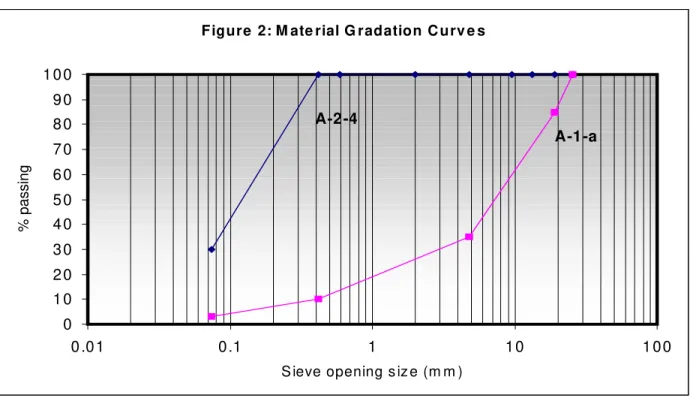
Two materials were selected for the purposes of this study. The first was a silty sand subgrade soil that classifies as A-2-4 material according to the AASHTO Procedure [8]. The second is a crushed sandy gravel base-course that classifies as A-1-a material.
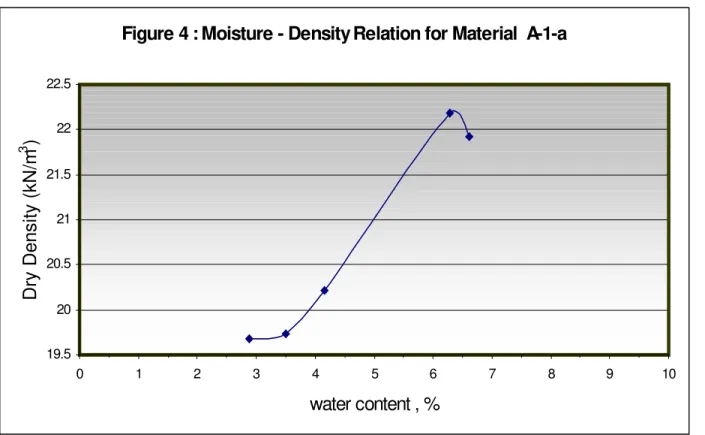
Figure 2 shows the gradation curves for the two materials. Figures 3 and 4 display the moisture – density relations for A-2-4 and A-1-a materials as obtained from the Standard Proctor Test Method [9]. The maximum dry density and optimum moisture content for material A-2-4
Dynamic Load Actuator
were found to be 15.8 kN/m3 and 17.3%, respectively. For material A-1-a, these values were found to be 22.2 kN/m3 and 6.2%, respectively.
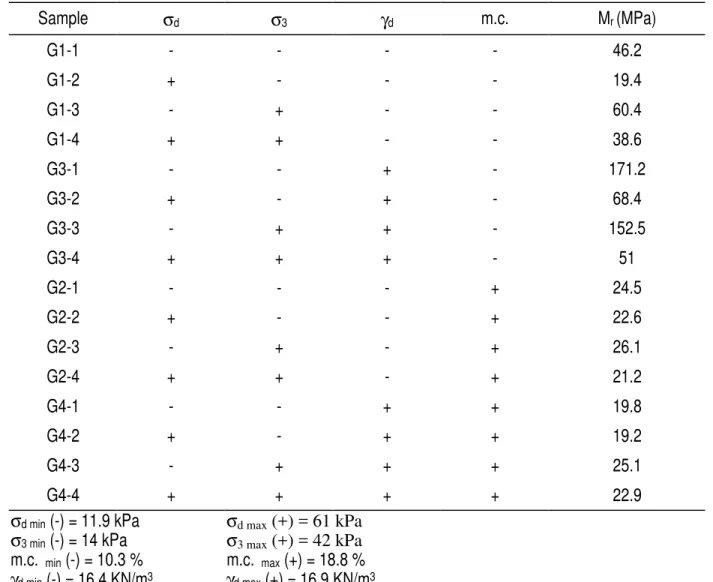
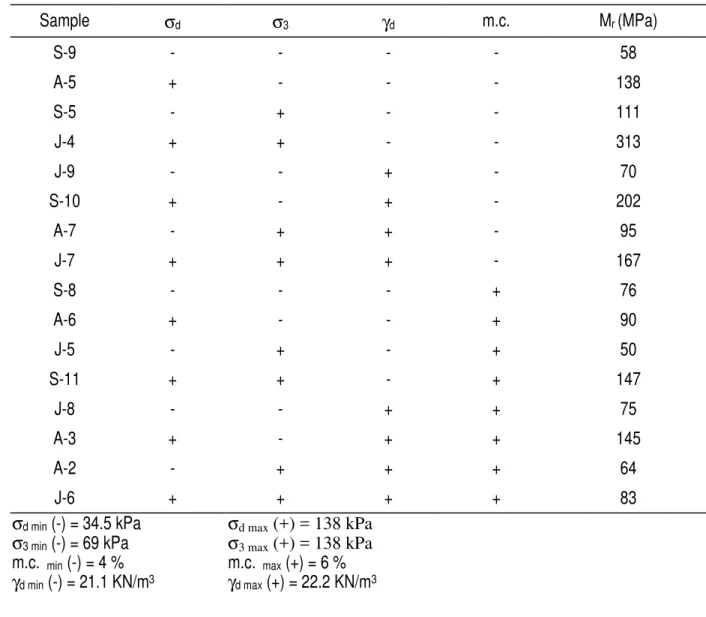
The laboratory investigation was designed to examine the influence of four test parameters on the resilient modulus of the selected materials. The four variables were the deviator stress, the confining pressure, the material dry density and the material moisture content. Using the principles of factorial design [10], a 24 factorial experiment was constructed in which two levels for each of the four independent parameters were selected. Tables 1 and 2 show the design matrices for the two investigated materials with the levels coded so that for each of the independent variables a minus sign represents the low level and a plus sign the high level. Actual values of the parameters selected are displayed at the bottom of the two tables. The resilient
Figure 2: M ate rial G radation C urv e s
0 1 0 2 0 3 0 4 0 5 0 6 0 7 0 8 0 9 0 10 0 0 .01 0.1 1 10 1 00 S ieve opening s iz e (m m ) % pas s ing A-2-4 A-1-a
Figure 3 : M oisture - Density Relation for M aterial A-2-4
14.2 14.4 14.6 14.8 15 15.2 15.4 15.6 15.8 16 10.00 12.00 14.00 16.00 18.00 20.00 22.00 24.00 26.00 28.00 W ater Content ,% Dry dens it y (KN/m3)
modulus obtained at each combination of the investigated variables is shown in the last column of each table.
3.2 Sample preparation and Test Procedure
Cylindrical specimens, 71mm in diameter by 142mm high for the A-2-4 material and 150mm in diameter by 300mm high for the A-1-a material, were prepared for testing in the RMTS. 16 samples were prepared for each material according to the test combinations shown in Tables 1 and 2. For A-2-4 material, specimens were compacted at two levels of dry density (@104% & @ 107% of maximum Proctor density), and at two levels of water content (@ 7% dry of optimum and @1.5% wet of optimum). For A-1-a material, specimens were compacted at maximum dry density and at 95% of maximum dry density and at optimum moisture content and at 2% dry of optimum, as shown in Table 2.
A haver sine loading pulse similar to the one shown in Figure 5 was used to apply the repetitive deviator stress. Loading was exerted for a period of 0.1 second, followed by a rest period of 0.9 second. This load cycle was repeated 100 times for every test specimen. The resilient modulus was computed for every load repetition and the average of the last five cycles was obtained as the representative modulus for the particular test specimen under consideration. These values are shown in the last column of each of Tables 1 and 2. Values for the Poisson’s Ratios for each material were also computed using measured radial deformations. However, this information, which is currently being analyzed, is not contained in the present paper.
Figure 4 : Moisture - Density Relation for Material A-1-a
19.5 20 20.5 21 21.5 22 22.5 0 1 2 3 4 5 6 7 8 9 10 water content , % Dr y De n s ity ( k N/m 3 )
Table 1: Design Matrix of Factorial Experiment for Material A-2-4 Sample σd σ3 γd m.c. Mr (MPa) G1-1 - - - - 46.2 G1-2 + - - - 19.4 G1-3 - + - - 60.4 G1-4 + + - - 38.6 G3-1 - - + - 171.2 G3-2 + - + - 68.4 G3-3 - + + - 152.5 G3-4 + + + - 51 G2-1 - - - + 24.5 G2-2 + - - + 22.6 G2-3 - + - + 26.1 G2-4 + + - + 21.2 G4-1 - - + + 19.8 G4-2 + - + + 19.2 G4-3 - + + + 25.1 G4-4 + + + + 22.9
σd min (-) = 11.9 kPa σd max (+) = 61 kPa
σ3 min (-) = 14 kPa σ3 max (+) = 42 kPa m.c. min (-) = 10.3 % m.c. max (+) = 18.8 % γd min (-) = 16.4 KN/m3 γd max (+) = 16.9 KN/m3
Figure 5: Typical Dynamic Repetitive Load Pulse
0 25 0 0.2 0.4 0.6 0.8 1 1.2 1.4 1.6 1.8 2 2.2 Time (sec) Lo a d Maximum Load
Table 2: Design Matrix of Factorial Experiment for Material A-1-a Sample σd σ3 γd m.c. Mr (MPa) S-9 - - - - 58 A-5 + - - - 138 S-5 - + - - 111 J-4 + + - - 313 J-9 - - + - 70 S-10 + - + - 202 A-7 - + + - 95 J-7 + + + - 167 S-8 - - - + 76 A-6 + - - + 90 J-5 - + - + 50 S-11 + + - + 147 J-8 - - + + 75 A-3 + - + + 145 A-2 - + + + 64 J-6 + + + + 83
σd min (-) = 34.5 kPa σd max (+) = 138 kPa
σ3 min (-) = 69 kPa σ3 max (+) = 138 kPa m.c. min (-) = 4 % m.c. max (+) = 6 % γd min (-) = 21.1 KN/m3 γd max (+) = 22.2 KN/m3
3.3 Analysis of Results A-2-4 Material
Results of resilient modulus tests for the 16 samples are displayed in Table 3. Columns 1 to 6 in this table contain the same data shown before in Table 1, with the exception that the actual values of the four independent variables are now displayed instead of the (-) and (+) signs used earlier. Column 7 in Table 3 contains the effect of each of the independent variables (or their interactions) on the resilient modulus parameter. For example, the value –32.8 represents the main effect of the deviator stress, σd, on Mr whereas -19.0 represents the interaction effect of σdγd on Mr. Calculation of main and interaction effects were performed using the table of
contrast method [10]. To illustrate, the main effect of σd and the interaction effect of σd=and=γd, i.e. σdγd, were calculated as follows:
Effect (σd) = (-46.2 + 19.4 - 60.4 + 38.6 - 171.2 + 68.4 - 152.5 + 51 - 24.5 + 22.6 – 26.1 + 21.2 - 19.8 + 19.2 - 25.1 + 22.9) / 8 = -32.8
Effect (σdγd) = (46.2 - 19.4 + 60.4 - 38.6 - 171.2 + 68.4 - 152.5 + 51 + 24.5 - 22.6 + 26.1 - 21.2 - 19.8 + 19.2 - 25.1 + 22.9) / 8 = -19.0
where, divisor 8 = 2 (k-1) and k = number of variables = 4
Since only 16 test runs were performed without replicates, no direct estimate of the standard error of the effects is possible. However, such an estimate can still be computed from three- and four-factor interactions since these effects can safely be assumed to be negligible, i.e.they do not represent real effects but are rather generated by noise in the data. Using the aforementioned assumption, an estimate of the Standard Error (effect) was calculated as follows:
Standard Error (effect) = [{(-0.3) 2 + (-1.4) 2 + (20.0) 2 + (9.8) 2 + (0.6) 2} / 5] 0.5 = 10.0
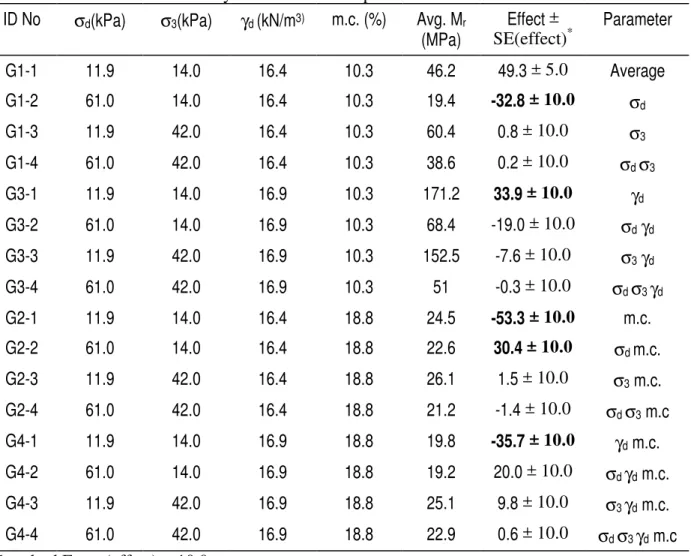
Table 3: Analysis of Factorial Experiment – A-2-4 Material ID No σd(kPa) σ3(kPa) γd (kN/m3) m.c. (%) Avg. Mr
(MPa) Effect ± SE(effect)* Parameter G1-1 11.9 14.0 16.4 10.3 46.2 49.3 ± 5.0 Average G1-2 61.0 14.0 16.4 10.3 19.4 -32.8 ± 10.0 σd G1-3 11.9 42.0 16.4 10.3 60.4 0.8 ± 10.0 σ3 G1-4 61.0 42.0 16.4 10.3 38.6 0.2 ± 10.0 σd σ3 G3-1 11.9 14.0 16.9 10.3 171.2 33.9 ± 10.0 γd G3-2 61.0 14.0 16.9 10.3 68.4 -19.0 ± 10.0 σdγd G3-3 11.9 42.0 16.9 10.3 152.5 -7.6 ± 10.0 σ3γd G3-4 61.0 42.0 16.9 10.3 51 -0.3 ± 10.0 σd σ3 γd G2-1 11.9 14.0 16.4 18.8 24.5 -53.3 ± 10.0 m.c. G2-2 61.0 14.0 16.4 18.8 22.6 30.4 ± 10.0 σd m.c. G2-3 11.9 42.0 16.4 18.8 26.1 1.5 ± 10.0 σ3 m.c. G2-4 61.0 42.0 16.4 18.8 21.2 -1.4 ± 10.0 σd σ3 m.c G4-1 11.9 14.0 16.9 18.8 19.8 -35.7 ± 10.0 γd m.c. G4-2 61.0 14.0 16.9 18.8 19.2 20.0 ± 10.0 σd γd m.c. G4-3 11.9 42.0 16.9 18.8 25.1 9.8 ± 10.0 σ3 γd m.c. G4-4 61.0 42.0 16.9 18.8 22.9 0.6 ± 10.0 σd σ3 γd m.c *
Standard Error (effect) = 10.0
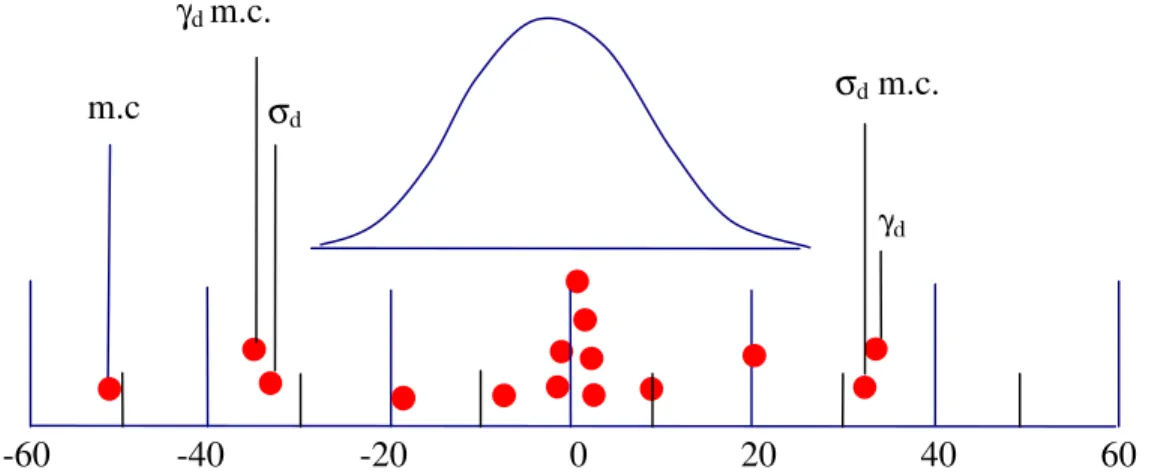
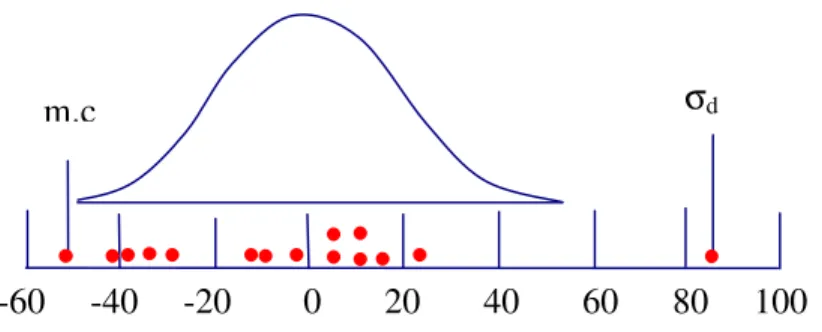
A comparison of the estimates of the effects shown in Table 3 with their standard errors (see also Figure 6) suggests that the highlighted items σσσσd ,====γγγγd , m.c. and the interactions σσσσd m.c. and γγγγd m.c. require interpretation. The remaining effects, however, seem to have no influence on the
modulus since they all fall under the t-distribution indicating that they could have been generated by the noise in the data.
Figure 6: Main effects and interactions in relation to a reference t-distribution with 5 degrees of freedom and a scale factor of 10.0 – Material A-2-4
The main effect of a variable should be individually interpreted only if there is no evidence that the variable interacts with other variables. However, in the current situation here for the A-2-4 material this seems to be not the case since there is strong interaction between σσσσd and m.c., and
also between γγγγd and m.c.. This necessitates that the interacting variables should be considered jointly.
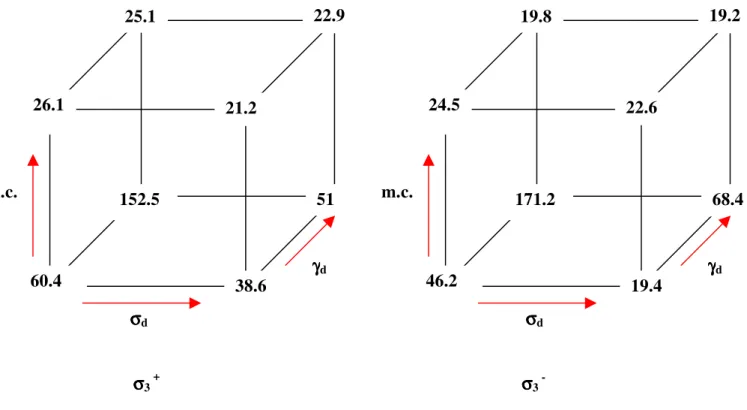
To interpret the results we obtained, a visual representation of the data contained in Table 3 is displayed in Figure 7. Using this figure, a two-way table showing the interaction between σσσσd and m.c. was obtained by averaging over levels of other variables. Similarly, another two-way table showing the interaction between γγγγd and m.c. was obtained. The two two-way tables are depicted
in Figures 8(a) and 8(b). From Figure 8(a), it is evident that increased moisture content significantly reduces the resilient modulus (a reduction of 80% to 50% over a moisture range change of 7% dry of optimum to 1.5% wet of optimum). It is also apparent that an increase in the deviator stress level produces reduction in the modulus value, however, this is only significant at lower levels of moisture contents. The effect of the deviator stress on the modulus diminishes at water content above optimum.
By examining Figure 8(b), it is clear that as the dry density of the material increases, the resilient modulus significantly increases (170% increase in Mr from its initial value as γγγγd
increases from 104% to 107% of maximum density). However, this effect is observable only at moisture contents on the dry side of the optimum. As the moisture increases beyond the optimum water content, the effect of the dry density on the modulus diminishes rapidly.
Findings obtained from the previous analysis of the effects are further substantiated upon performing regression analysis on the test data. Several regression models were postulated to describe the resilient modulus of the material, however, the model that incorporated the deviator stress, moisture content and dry density as the independent parameters appears to be the most plausible in explaining the Mr relation. Addition of other parameters into the model did not
improve the relation as measured by its R2-value and consequently these parameters were discarded from the analysis. The final form of the Mr relation is given in equation 2 below. Ln (Mr) = – 30.1 – 0.289 Ln (σd) – 1.749 Ln (m.c.) + 13.96 Ln (γd) ... (2) R2 of model = 0.76 m.c σd γd σdm.c. γd m.c. -60 -40 -20 0 20 40 60
Figure 7: A 24 design with data displayed geometrically – A-2-4 material
Figure 8: Interpretation of Test Results for Material A-2-4
(a) Two-way Table for σd and m.c. (b) Two-way Table for γdand m.c. 21.5 44.4 23.9 107.6 m.c. σσσσd 21.8 110.8 23.6 41.2 m.c. γγγγd 60.4 26.1 25.1 22.9 51 152.5 21.2 38.6 σσσσd γγγγd m.c. σσσσ3 + 46.2 24.5 19.8 19.2 68.4 171.2 22.6 19.4 σσσσd γγγγd m.c. σσσσ3
-A-1-a Material
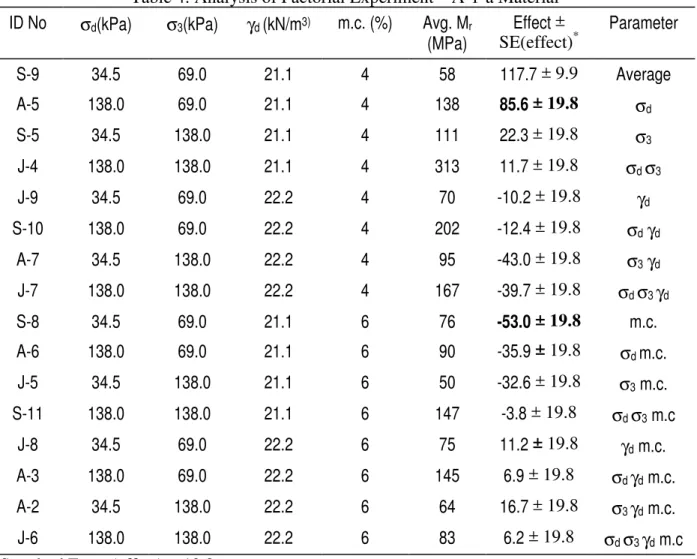
Results of resilient modulus tests for the 16 samples for A-1-a material are displayed in Table 4. This table is identical to Table 2, except that the actual values of the independent variables are now shown in columns 2 through 5. Column 7 contains an estimate of the effect of each of the independent variables together with their standard errors.
By examining Table 3 (and also Figure 9), it is evident that only the deviator stress and the soil moisture content have significant effects on the resilient modulus of this material. Other factors such as σ3 and γd appears to have no effect on Mr. Quantitatively, the effect of increasing
the deviator stress by 103.5 kPa results in an corresponding increase of 85.6 MPa in the modulus value. On the other hand, increasing the moisture content by 2% results in a decrease in the modulus value by 53 MPa.
Table 4: Analysis of Factorial Experiment – A-1-a Material ID No σd(kPa) σ3(kPa) γd (kN/m3) m.c. (%) Avg. Mr
(MPa) Effect ± SE(effect)* Parameter S-9 34.5 69.0 21.1 4 58 117.7 ± 9.9 Average A-5 138.0 69.0 21.1 4 138 85.6 ± 19.8 σd S-5 34.5 138.0 21.1 4 111 22.3 ± 19.8 σ3 J-4 138.0 138.0 21.1 4 313 11.7 ± 19.8 σd σ3 J-9 34.5 69.0 22.2 4 70 -10.2 ± 19.8 γd S-10 138.0 69.0 22.2 4 202 -12.4 ± 19.8 σdγd A-7 34.5 138.0 22.2 4 95 -43.0 ± 19.8 σ3γd J-7 138.0 138.0 22.2 4 167 -39.7 ± 19.8 σd σ3 γd S-8 34.5 69.0 21.1 6 76 -53.0 ± 19.8 m.c. A-6 138.0 69.0 21.1 6 90 -35.9 ± 19.8 σd m.c. J-5 34.5 138.0 21.1 6 50 -32.6 ± 19.8 σ3 m.c. S-11 138.0 138.0 21.1 6 147 -3.8 ± 19.8 σd σ3 m.c J-8 34.5 69.0 22.2 6 75 11.2 ± 19.8 γd m.c. A-3 138.0 69.0 22.2 6 145 6.9 ± 19.8 σd γd m.c. A-2 34.5 138.0 22.2 6 64 16.7 ± 19.8 σ3 γd m.c. J-6 138.0 138.0 22.2 6 83 6.2 ± 19.8 σd σ3 γd m.c *
Standard Error (effect) = 19.8
Findings obtained from the previous analysis for the A-1-a are again substantiated upon performing regression analysis on the test data. Several regression models were tried to describe the resilient modulus of the material, however, the model that incorporated the deviator stress and moisture content as the independent parameters appears to be the most plausible in explaining the Mr relation. The final form of the Mr relation obtained is given in equation 3
Ln (Mr) = – 4.03 + 0.541 Ln (σd) – 1.074 Ln (m.c.)...(3)
R2 of model = 0.74
Figure 9: Main effects and interactions in relation to a reference t-distribution with 5 degrees of freedom and a scale factor of 19.8 – Material A-1-a
4 SUMMARY AND CONCLUSIONS
This paper presents recent developments in the area of road foundation materials research that is currently being pursued at NRC’s Institute for Research in Construction. The paper outlines a systematic and rational approach for characterizing the material’s response to external stimuli of traffic and the surrounding environment. The approach utilises the resilient modulus as the parameter of choice for the characterisation. The premise is that the resilient modulus closely describes the material mechanical behaviour under in-situ traffic loading and environmental conditions. This mechanical behaviour can be linked to the long-term performance of the urban road system through mechanistic pavement design principles.
A state-of-the-art laboratory facility was designed and built at IRC to develop effective measures to guard against road deterioration in the case of inadequate structural support provided to the asphalt concrete surface. Using this facility, a silty sand material representing a typical subgrade and an unbound aggregate material commonly used in base and sub-base road layers were tested under various load and physical conditions.
The study involved a factorial experiment that aimed at examining the influence of four parameters on the resilient modulus of the two materials. The first material was classified as A-2-4 according to the AASHTO Classification System while the second was an A-1-a unbound granular material. Effective use of the techniques of experimental factorial design allowed the identification and quantification of the effects of the significant factors on the resilient response of the materials. For A-2-4 material, the factors were found to be the soil moisture content, the applied deviator stress and the material dry density. For A-1-a material, only the moisture content and the deviator stress were found to be significant.
Close examination of test results obtained for the A-2-4 material revealed its high sensitivity to the interaction effect between the deviator stress and the moisture content on one hand and also to the interaction effect between the moisture content and the material dry density on the other hand. At low levels of moisture content, it was found that increasing the applied deviator stress decreases the resilient modulus appreciably, however, at high levels of moisture content, the effect of the deviator stress on the modulus diminishes rapidly. The same observation was also noted for the interaction effect of moisture content and dry density with the exception that at levels of moisture content below optimum, a moderate increase in the dry density causes a significant increase in the resilient modulus.
-60 -40 -20 0 20 40 60 80 100
For A-1-a material, increasing the deviator stress produces a concurrent increase in the resilient modulus whereas moderate increase in moisture content is accompanied by a sharp decrease in the resilient modulus. No interaction effect between the moisture content and the deviator stress was observed for this material
The findings obtained for both materials were further confirmed by performing regression analysis on the test results. Two constitutive models were obtained for the investigated materials in term of its resilient modulus.
Following the research approach outlined in this paper, the Urban Road group of the Infrastructure Program at IRC is currently investigating the behaviour of a number of road foundation materials that is commonly used in the restoration of utility cuts. The aim is to reduce incidents of premature failure of the road structure through proper characterization of its constituent materials and also to be able to predict the road performance under in-service conditions.
5 ACKNOWLEDGEMENTS
The author would like to express his appreciation for the support he received from the Urban Road Group at IRC during the course of this investigation. Special thanks are due to technical officers Mr. Z. Geagea and Mr. O. Maadani for conducting the resilient modulus tests and for helping in the data reduction. Thanks are also due to Mr. M. Muslim for his help with preparing some of the drawings presented in the paper.
The author would also like to acknowledge the financial contribution provided to this project by the Urban Infrastructure Program at IRC during the development and building of the laboratory test facility.
6 REFERENCES
1. Brown, S F, 1974, Repeated Load Testing of a Granular Material, Journal of Geotechnical
Engineering Division, American Society of Civil Engineers. Vol.100, No. G77, pp 825-841.
2. Seed, H B, Mitry, F G, Monismith, C L & Chan, C K, 1967b, Factors Influencing the Resilient Deformations of Untreated Aggregate Base in Two Layer Pavements Subjected to Repeated Loadings, Highway Research Record 140, Highway Research Board 1967, pp 19-57.
3. Dehlen, G L, & Monismith, C L, 1970, The Effect of Non-linear Material Response on the Behaviour of Pavements Under Traffic, Highway Research Record 310, Highway Research Board, pp 1-16.
4. Barksdale, R G, 1971, Compressive Stress Pulse Times in Flexible Pavements for Use in Dynamic Testing, Highway Research Record 345, Highway Research Board, pp 32-44. 5. Pell, P S & Brown, S F, 1972, The Characteristics of Materials for the Design of Flexible
Pavement Structures, Proc. 3rd Int'l Conf on the Structural Design of Asphalt Pavement, London, England, pp 326-342.
6. Brown, S F, 1977, Development in Highway Pavement Engineering: chapter 2- Material Characterisation for Analytical Pavement Design, pp 41-92.
7. Cole, D, Bentley, D, Durell, G & Johnson, T, 1986, Resilient Modulus of Freeze-Thaw Affected Granular Soils for Pavement Design and Evaluation: Part 1, Laboratory Tests on Soils
from Winchendon, Massachusetts, Test Sections, CRREL Report 86-4.
8. AASHTO, 1998, Classification of Soils and Soil-Aggregate Mixtures for Highway
Construction Purposes: AASHTO Standard Test Designation M —145-91 (1995), American Association of State Highway and Transportation Officials.
9. AASHTO, 1998, The Moisture-Density Relations of Soils Using a 2.5-kg [5.5-I] Rammer and a 305-mm [12-in.] Drop: AASHTO Standard Test Designation T— 99-97, American Association of State Highway and Transportation Officials.
10. Box, G E P, Hunter, W G & Hunter, J S, 1978, Statistics for Experimenters: An Introduction to Design, Data Analysis and Model Building, Wiley Series in Probability and Mathematical Statistics.
![Figure 2 shows the gradation curves for the two materials. Figures 3 and 4 display the moisture – density relations for A-2-4 and A-1-a materials as obtained from the Standard Proctor Test Method [9]](https://thumb-eu.123doks.com/thumbv2/123doknet/14203372.480400/6.918.223.656.179.805/gradation-materials-figures-moisture-relations-materials-obtained-standard.webp)