Publisher’s version / Version de l'éditeur:
03 Trondheim Proceedings of the 17 International Conference onthPort and Ocean Engineering under Arctic Conditions POAC’03, 1, pp. 213-222, 2003-06
READ THESE TERMS AND CONDITIONS CAREFULLY BEFORE USING THIS WEBSITE. https://nrc-publications.canada.ca/eng/copyright
Vous avez des questions? Nous pouvons vous aider. Pour communiquer directement avec un auteur, consultez la
première page de la revue dans laquelle son article a été publié afin de trouver ses coordonnées. Si vous n’arrivez pas à les repérer, communiquez avec nous à [email protected].
Questions? Contact the NRC Publications Archive team at
[email protected]. If you wish to email the authors directly, please see the first page of the publication for their contact information.
NRC Publications Archive
Archives des publications du CNRC
This publication could be one of several versions: author’s original, accepted manuscript or the publisher’s version. / La version de cette publication peut être l’une des suivantes : la version prépublication de l’auteur, la version acceptée du manuscrit ou la version de l’éditeur.
Access and use of this website and the material on it are subject to the Terms and Conditions set forth at Ice Loads on the SSDC during Its Beaufort Sea Deployments Timco, Garry; Johnston, Michelle
https://publications-cnrc.canada.ca/fra/droits
L’accès à ce site Web et l’utilisation de son contenu sont assujettis aux conditions présentées dans le site
LISEZ CES CONDITIONS ATTENTIVEMENT AVANT D’UTILISER CE SITE WEB.
NRC Publications Record / Notice d'Archives des publications de CNRC: https://nrc-publications.canada.ca/eng/view/object/?id=6e5eeb8c-c6e2-4822-94b8-af391287b15a https://publications-cnrc.canada.ca/fra/voir/objet/?id=6e5eeb8c-c6e2-4822-94b8-af391287b15a
POAC ‘03
Trondheim
Proceedings of the 17 International Conference onth
Port and Ocean Engineering under Arctic Conditions POAC’03 Vol. 1, pp 213-222 Trondheim, Norway, June 16-19, 2003
ICE LOADS ON THE SSDC
DURING ITS BEAUFORT SEA DEPLOYMENTS
M. Johnston and G.W. Timco
Canadian Hydraulics Centre, Ottawa, Canada
ABSTRACT
An overview is presented of the instrumentation, ice conditions and available load information on the SSDC at four of its Beaufort Sea deployments. This paper concentrates on the Phoenix and Aurora sites, both of which were surrounded by an extensive rubble field, since those were the only sites for which load data are available. Global loads at those sites were estimated from in situ load panels. Thirteen wind-driven or thermally activated events occurred at the Phoenix and Aurora sites, resulting in global loads up to 80 MN. The corresponding Line Loads and Global Pressures were up to 1.8 MN/m and 1.2 MN/m2, respectively. Estimates of Line Load and Global Pressure showed that the presence of grounded rubble reduced the transmitted loads, whereas floating rubble did not.
INTRODUCTION
During the 1970s and 1980s there was considerable activity for oil exploration in the Canadian and American Beaufort Seas. Over 140 wells were drilled using innovative technology that evolved with time (Masterson et al., 1991). This evolution was a result of a better understanding of the Arctic environment and the need to operate in increasingly deeper waters, under extreme ice conditions. In the initial stages of exploration, knowledge of actual ice loads on wide structures was virtually non-existent. Attempts to remedy this resulted in many structures being instrumented to measure ice loads. The instrumented structures led to the development of active measurement programs, many of which yielded extremely valuable data.
The Single-Steel Drilling Caisson (SSDC) was one of the structures instrumented to measure ice loads. It is a caisson structure that was owned and operated by CANMAR, the marine arm of Dome Petroleum. The SSDC drilled two wells in the Canadian Beaufort Sea (Uviluk and Kogyuk) and four wells in the American Beaufort Sea (Phoenix, Aurora, Fireweed and
Cabot). The SSDC was exposed to a range of ice conditions at its different sites. This paper summarizes information about the ice conditions and structural loads experienced at four of those deployments. No information was available about the Fireweed and Cabot sites.
The National Research Council of Canada (NRCC) obtained information on the SSDC ice loads while compiling the NRC Ice Load Catalogue (Timco et al., 1999). The Catalogue contains over 600 events from a variety of structures. Event information includes time-series of the global loads and the corresponding ice conditions. This paper discusses the 13 events that were included in the Catalogue1, and presents anecdotal information about two additional events (quantitative data were not available for those events).
DESCRIPTION OF THE SSDC
The Single-Steel Drilling Caisson (SSDC) was a converted supertanker that underwent extensive modifications to enable its use as a support structure for year-round, exploratory drilling in the Beaufort Sea. The structure is 162 m long, 53 m wide at the stern (38 m at the bow), 25 m high and has vertical sides at the waterline.
From 1982 to 1984, the SSDC was installed in the Canadian Beaufort Sea at the Uviluk and Kogyuk sites, where it was placed upon a submerged berm. Anecdotal information about the global loads experienced during two events at the Kogyuk site is presented.
In August 1986, the SSDC was mated to a semi-submersible steel base (the “MAT”) in preparation for deployments in the American Beaufort Sea. The MAT allowed the SSDC to operate year-round in water depths of 7 to 24 m without requiring a dredged berm. The MAT was used at the four deployments in the American Beaufort Sea: Phoenix, Aurora, Fireweed and Cabot. Global loads from two of those sites are discussed here.
SSDC INSTRUMENTATION AND ICE LOADS: SITE EVALUATION
Uviluk Site (1982 to 1983)
During the summer of 1982, the SSDC was deployed at the Uviluk P-66 location in the Beaufort Sea. Since the water depth at that site was 31 m, the SSDC was placed on a sub-sea berm. The hull was outfitted with three types of load panels: MEDOF panels, Arctec panels and Weir Jones panels. Pairs of MEDOF panels (2 m²) were welded to all sides of the hull, at the waterline. MEDOF panels were also placed directly in the ice at the outer edge of the ice-berm. The Arctec shear bar panels (0.25 m², 1 m² and 2 m²) were arranged in a vertical array on the hull near the starboard midship. The Weir Jones panels were fluid filled flatjacks (8.2 m²) that were installed on the bow.
During the early part of the season, ice impacted the structure directly. Eventually, grounded rubble surrounded the SSDC and precluded the ice from interacting directly with the structure. The threshold for the ice load instrumentation was set high at the Uviluk site, in anticipation of substantial ice loads. Because the grounded rubble field shielded the structure
1
Data for the SSDC loading events were obtained (and re-analyzed) from Blanchet and Keinonen (1988), Blanchet and Weifelspuett (1988), CANMAR (1985) and Hewitt et al. (1985). Supplementary information was provided by D. Blanchet (personal communication).
from direct ice impacts, the resulting loads were below the instrumentation threshold. Three interactions with first-year ice were noted to occur at the Uviluk site, however there were no data to document load levels during those interactions.
Kogyuk Site (1983 to 1984)
At the Kogyuk N-67 exploratory well, CANMAR operated the SSDC for Gulf Canada Resources Ltd. (water depth of 28 m). The same ice load panels that had been installed on the hull of the SSDC at the Uviluk site functioned at the Kogyuk site. As at the Uviluk site, a grounded rubble field formed and shielded the SSDC from direct ice interactions. Movement of first-year, second-year and multi-year ice resulted in 11 interactions at Kogyuk (CANMAR, 1985), however no load-time series were available for those events. Two of the most notable events are summarized below, using anecdotal information (Hewitt, personal communication).
The 25 September 1983 interaction occurred shortly after set down of the SSDC, when a large multi-year ice floe impacted the port side of the bow. The 3 to 4 m thick floe was about 1.7 km in diameter and was travelling at about 0.25 m/s. During the impact, the ice failed in pure crushing (without splitting or bending). The floe came to a halt after a penetration of about 8 m. The impact was clearly felt on the structure, however no damage or movement of the SSDC was detected. Structural resistance at the time of impact was estimated to be about 175 MN. Based upon the resistance of the structure, the floe mass and its deceleration [CANMAR estimated that] the load was less than 100 MN (Hewitt, personal communication).
The event on 25 June 1984 occurred when a second-year floe impacted the stern of the SSDC at about 0.45 m/s. The floe was roughly 24 km by 13 km and was 1.5 to 2 m thick. During the event, a grounded ice rubble field formed at the stern and shielded the structure, which reduced the applied loads. The load was estimated to be less than 100 MN, based upon the MEDOF panel response (Hewitt, personal communication).
Phoenix Site (1986 to 1987)
In September 1986, the SSDC/MAT was deployed at the Phoenix site in Harrison Bay, Alaska (water depth of 17.5 m). On 30 January, the landfast ice moved about 500 m from the northeast and created a large rubble field. The rubble field, shown from an aerial perspective in Figure 1, remained intact for the rest of the winter (Blanchet and Keinonen, 1988). It was about 208 m wide, 420 m long and up to 8.5 m high. Most of the rubble was floating, however portions of it were grounded (Figure 2). After the rubble field formed, ice surrounding the structure became immobile, which allowed the 500 m long wake on the starboard side to freeze. In general, ice movement at the Phoenix site was activated by wind, thermal or tidal stresses. The rubble began to deteriorate at the end of May, as noted by the surface melt in low-lying areas.
Figure 1. Photograph showing the rubble field around the SSDC at the Phoenix site (view looking south, after Blanchet and Keinonen, 1988)
Loads at the Phoenix site were measured from load panels that were installed in the surrounding ice (panels on the hull no longer functioned). In early March, four IDEAL ice force panels (1.0 m²) were placed in rubbled ice on the north side of the SSDC and six load panels were installed in level ice beyond the rubble (Figure 2). The in situ load panels were monitored continuously from March until June, when they were removed. Information about the general ice conditions was provided by ice movement reflectors, crack displacement stations and thermistor strings. Ice conditions were also monitored from ice observations, aerial photography, ice rubble profiles and measurements of ice thickness and salinity (Blanchet and Keinonen, 1988).
N
50 m region of
floating rubble grounded rubble level first-year ice SSDC IDEAL Panels IDEAL Panels IDEAL Panels
Figure 2. Instrumentation in the ice surrounding the SSDC/MAT at the Phoenix site (shaded regions show grounded rubble)
Data from the in situ load panels (sampled at 20 Hz) were used to determine 1.5-minute averages of each panel, which were stored in a daily buffer and downloaded to disk each day. The maximum hourly averages of the panel results were used to determine creep-type loads on the SSDC, per Equation (1), after Blanchet and Keinonen (1988);
p SSDC thick incl Ideal SSDC w W x C x C x L L = (1) where
LSSDC = hourly average of load on impacted face
LIdeal = maximum hourly average ice load measured by the affected panel
Cincl = inclusion/cross-sensitivity coefficient
Cthick = through thickness coefficient
WSSDC = width of impacted face (162 m starboard, 52 m stern or 38 m bow)
wp = 0.5 m panel width
Since the ice acted on the entire face of the SSDC during the creep-type events, Equation (1) used the complete face length (WSSDC) to determine the global loads. Blanchet and Keinonen
(1988) report that the effects of cross-sensitivity and inclusion were accounted for by Cincl,
defined as 0.8. Cross-sensitivity effects refer to the inability of the panel to differentiate between normal and tangential loads. The inclusion effect refers to the phenomenon of embedding a foreign object in the ice and altering its stress field (Croasdale and Frederking, 1986). The coefficient Cthick accounted for the percent coverage of the load panel with respect
to the surrounding ice, therefore it varied for each event.
Six notable interactions occurred at the Phoenix site, all of which were thermally activated or wind-driven and caused creep-type loading. During the events, the surrounding rubbled ice pushed against the port side (162 m) of the SSDC. Global loads for those events were determined from the load panel installed in level first-year ice beyond the rubble (Figure 2). Global loads for the six events at Phoenix ranged from 25 to 74 MN.
Aurora Site (1987 to 1988)
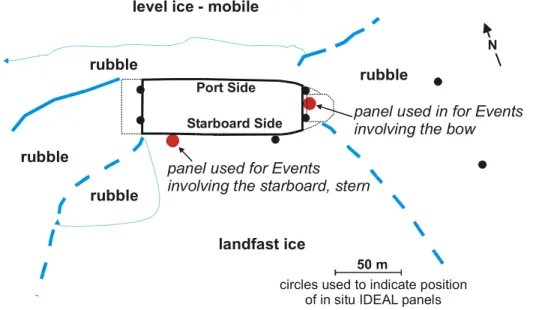
In 1988, the SSDC/MAT was deployed at the Aurora site (water depth of 21 m). Hull loads were monitored using ten in situ load panels (Figure 3). Five of the panels were installed in the rubble at the bow, two panels were installed in relatively level ice on the starboard side and three panels were located in rubble near the stern. Load panels were not installed in the ice on the port side of the SSDC because that area contained a large amount of broken ice that had not yet stabilized. Information about the ice conditions was provided by crack displacement stations, thermistor strings, ice movement reflectors and wire line devices. Ice thickness was also measured and the underside of the rubble was profiled (Blanchet and Wiefelspuett, 1988).
50 m N landfast ice rubble rubble rubble rubble
level ice - mobile
panel used in for Events involving the bow panel used for Events
involving the starboard, stern Port Side
Starboard Side
circles used to indicate position of in situ IDEAL panels
Figure 3. Instrumentation in the ice surrounding the SSDC/MAT at the Aurora site The landfast ice along the starboard side of the SSDC had stabilized by the end of November. Ice along the starboard side consisted of 1.6 m thick level ice, rafted ice and some rubble (the rubble extended less than one metre from the hull). In comparison, ice to the north, east and west of the SSDC was mobile, resulting in more dynamic ice conditions than seen at previous sites. A floating rubble field developed around the structure. It had an average height of 2 to 3 m, although some blocks were up to 4 m high. The rubble field also contained flat pans of ice with single or rafted layers. Over the season, the consolidated layer of ice at the bow and stern increased to 3.5 m (from 2.2 m) and 3.0 m (from 1.7 m) respectively.
Cracks at the Aurora site radiated in four directions at 45°, which divided the ice into four regions (the bow, starboard, stern and port sectors, Figure 3). Ice in the bow, stern and port sectors moved with the predominant wind direction (east-west). Because ice in the port sector was unstable throughout the season, daily ice movements of up to 20 m were observed. In the starboard sector, wind and thermal stresses caused the ice to move back and forth between the shoreline and structure.
Ice loads at the Aurora site were determined using the same methodology that was used at the Phoenix site (see Equation 1). Nine loading events occurred between March and June, seven of which were analyzed in detail. The Aurora events were wind-activated or thermally driven, and were mostly pure creep type events or combined creep and “racheting” type events. The 38 m bow was loaded in six of the examined events. Global loads during the bow events were determined from one of the in situ bow load panels (two of the bow panels were damaged in an earlier loading event). The seventh event at Aurora involved the starboard side (162 m). Global loads on the starboard face were determined using the in situ load panel on the starboard side of the stern.
OVERVIEW OF ICE LOADS ON THE SSDC
Global Loads
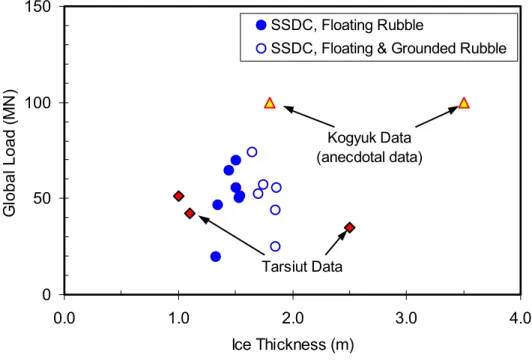
While the SSDC was at the Phoenix and Aurora sites, it experienced thirteen events. All of those events were wind-driven or thermally activated and resulted in creep-type ice movements that, typically, lasted several days. Figure 4 shows that the 13 events generated global loads from 20 to 80 MN. Anecdotal information about the two events at the Kogyuk site indicated loads of about 100 MN (Hewitt, personal communication). Compared to the creep-type events that occurred at Phoenix and Aurora, global loads at the Kogyuk site may have been higher because they occurred when floes impacted the structure at 0.25 and 0.45 m/s.
The data Figure 4 are grouped according to the presence of floating or grounded rubble. At the Phoenix site, the rubble field was a combination of grounded and floating ice (floating/grounded), whereas the rubble floated in all sectors at the Aurora site. For comparison, global loads on the Tarsiut caissons (Timco and Wright, 1999) are shown in Figure 4. The Tarsiut Caissons were also surrounded by grounded rubble and involved similar creep-type loading events, and had global loads comparable to those on the SSDC.
0 50 100 150 0.0 1.0 2.0 3.0 4.0 Ice Thickness (m) G lob al Lo ad ( M N ) . SSDC, Floating Rubble
SSDC, Floating & Grounded Rubble
Kogyuk Data (anecdotal data)
Tarsiut Data
Figure 4. Global Loads on the SSDC: Kogyuk, Phoenix and Aurora sites
(data from Tarsiut Caissons shown for comparison)
Line Loads
Figure 4 presented global loads on the SSDC, however it did not distinguish between events involving different face lengths. The six events at the Phoenix site involved the long face (port side, 162 m), whereas six of the seven events examined at the Aurora site involved the
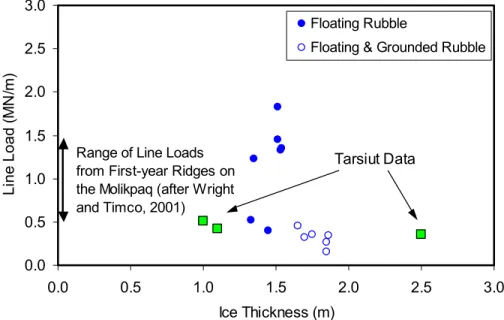
short face (bow, 38 m). A coherent approach was needed to compare the global loads determined from the different faces. This was done by presenting the global load in terms of a Line Load, or a global load per unit width. The Line Load was calculated using Equation (2); Ice the by loaded Structure of Width Load Global Measured Load Line = (2)
Figure 5 shows a plot of the Line Load at the Phoenix and Aurora sites, as a function of ice thickness. Data were categorized according to the type of rubble field (floating/grounded). Taking into account the loaded width of the structure resulted in Line Loads of 2 MN/m or less. Although the data in Figure 5 are limited, they seem to show that the presence of grounded rubble leads to a reduction in applied load. Sayed (1989) also noted that grounded ice rubble attenuated loads during ice-structure interactions.
For comparison, the loads generated on the Tarsiut caissons during similar creep-type events were included in Figure 5. The figure also shows the Line Loads on the Molikpaq that resulted from advancing ridges, with sail heights from 0.5 to 2.5 m (Wright and Timco, 2001). The comparison shows that Line Loads from level first-year ice (SSDC) can be higher than Line Loads caused by advancing ridged ice (Molikpaq). A similar trend was shown for ice crushing events on the Molikpaq (Wright and Timco, 2001).
0.0 0.5 1.0 1.5 2.0 2.5 3.0 0.0 0.5 1.0 1.5 2.0 2.5 3.0 Ice Thickness (m) Li ne Load ( M N /m ) Floating Rubble
Floating & Grounded Rubble
Range of Line Loads from First-year Ridges on the Molikpaq (after Wright and Timco, 2001)
Tarsiut Data
Figure 5: Line Loads on the SSDC (ridge loads on Molikpak shown for comparison) Global Pressure
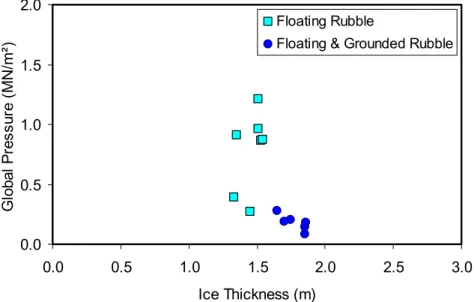
The ice load information can also be presented in terms of Global Pressure. The concept of Global Pressure was used as a simple means of comparing pressures generated on the SSDC during different events. It is emphasized that estimates of Global Pressure should only be used in a global context. Obviously, the local pressures on a structure would be considerably higher
than Global Pressures. The Global Pressure was calculated by normalizing the Line Load by the ice thickness, as shown in Equation (3),
Thickness Ice x Ice the by loaded Structure of Width Load Global Measured essure Pr Global = (3)
Figure 6 shows the Global Pressure on the SSDC as function of ice thickness. Data were categorized according to the presence of floating or grounded rubble. Based upon Equation (3), the SSDC experienced Global Pressures of 1.2 MN/m2 or less. Figure 6 also provides evidence of the load attenuation from grounded rubble.
0.0 0.5 1.0 1.5 2.0 0.0 0.5 1.0 1.5 2.0 2.5 3.0 Ice Thickness (m) G lobal P re s s ur e ( M N /m ²) Floating Rubble
Floating & Grounded Rubble
Figure 6. Global Pressures on the SSDC
SUMMARY
This paper presented an overview of the instrumentation and ice loads measured on the SSDC during its four Beaufort Sea deployments. The most reliable load measurements were obtained from the Phoenix and Aurora drill sites. The 13 events examined at those two sites were wind-driven or thermally activated interactions that resulted in creep failure of the ice. Typical event loading times were of the order of days. The maximum global load experienced at the Phoenix and Aurora sites was 80 MN. Line Loads and Global Pressures were up to 1.8 MN/m and 1.2 MN/m2, respectively. Although data on the SSDC are limited, they provide evidence of load attenuation by grounded rubble.
ACKNOWLEDGMENTS
The authors would like to acknowledge Denis Blanchet for his support in supplying CHC with the SSDC data. Thanks also to Kevin Hewitt, Archie Churcher and Bob Frederking for their helpful discussions. This work was supported by the Program on Energy Research and
Development (PERD) through the ice-structure interaction activity. PERD support is gratefully acknowledged.
REFERENCES
Blanchet, D. and Keinonen, A. (1988): Ice Load Measurements at Phoenix, Harrison Bay Winter 1986-87. CANMAR/Valmet Report. Calgary, Al., Canada. 208 pp.
Blanchet, D. and Wiefelspuett, R. (1988): Ice Load Measurements at Aurora, Beaufort Sea Winter 1987-88. CANMAR/Wartsila Report. Calgary, Al., Canada. 95 pp.
CANMAR (1985): Kogyuk Stability Monitoring Program 1983-84: Event Data, Vol. I4 - I6. Calgary, Al., Canada.
Croasdale, K.R. and Frederking, R.M.W. (1986): Field Techniques for Ice Force Measurements. Proceedings IAHR Ice Symposium. Iowa City, Iowa, USA. Vol. 2, pp. 443-482.
Hewitt, K., Berzins, W., Fitzpatrick, J. and Hogeboom, G. (1985): The Design, Installation and Performance of a Berm Supported Exploration Structure in the Beaufort Sea. Proceedings 4th Offshore Mechanics and Arctic Engineering Symposium, Dallas, Texas, USA. Vol. II, pp. 105-113.
Masterson. D., Bruce, J., Sisodiya, R. and Maddock, W.P. (1991): Beaufort Sea Exploration: Past and Future. Offshore Technology Conference paper OTC6530. Houston, Texas, USA.
Sayed, M. (1989): Transmission of Loads through Grounded Ice Rubble. Proceedings 4th IAHR State-of-the-Art Report on Ice Forces on Structures. G.W. Timco, Ed.. USA CRREL Special Report 89-5. Hanover, NH, USA. pp 259-275.
Timco, G.W., Johnston, M. and Frederking, R. (1999): The NRC Ice Load Catalogue. Proceedings 15th International Conference on Port and Ocean Engineering under Arctic Conditions. Helsinki, Finland. Vol. 1, pp. 444-453.
Timco, G.W. and Wright, B.D. (1999): Load Attenuation through Grounded Ice Rubble at Tarsiut Island. Proceedings 15th International Conference on Port and Ocean Engineering under Arctic Conditions. Helsinki, Finland. Vol. 1, pp. 454-463.
Wright, B.D. and Timco, G.W. (2001): First-year Ridge Interaction with the Molikpaq in the Beaufort Sea. Cold Regions Science and Technology. Vol. 32, pp. 27-44.