Publisher’s version / Version de l'éditeur:
https://publications-cnrc.canada.ca/fra/droits
L’accès à ce site Web et l’utilisation de son contenu sont assujettis aux conditions présentées dans le site
Internal Report (National Research Council of Canada. Institute for Research in
Construction), 2000-07-01
READ THESE TERMS AND CONDITIONS CAREFULLY BEFORE USING THIS WEBSITE.
https://nrc-publications.canada.ca/eng/copyright
NRC Publications Archive Record / Notice des Archives des publications du CNRC :
https://nrc-publications.canada.ca/eng/view/object/?id=9379b11c-3051-411c-bbc1-63c266f875d3
https://publications-cnrc.canada.ca/fra/voir/objet/?id=9379b11c-3051-411c-bbc1-63c266f875d3
NRC Publications Archive
Archives des publications du CNRC
For the publisher’s version, please access the DOI link below./ Pour consulter la version de l’éditeur, utilisez le lien DOI ci-dessous.
https://doi.org/10.4224/20386418
Access and use of this website and the material on it are subject to the Terms and Conditions set forth at
Detailed report for consortium on fire resistance and sound insulation
of floors: sound transmission and impact insulation data in 1/3 octave
bands
National Research Council Canada
Conseil national de recherches Canada
Detailed Report for Consortium on
Fire Resistance and Sound Insulation
of Floors: Sound Transmission and
Impact Insulation Data in 1/3 Octave
Bands
by A.C.C. Warnock & J.A. Birta
IRC Internal Report IR-811
July 2000
Published by
Institute for
TABLE OF CONTENTS
INTRODUCTION... 1
Areas requiring Additional Work ... 2
MEASUREMENT PROCEDURES ... 4
M59 test facility... 4
Airborne Sound — ASTM E90... 6
Impact Sound — ASTM E492... 7
CODING SYSTEM FOR SPECIMEN DESCRIPTION... 8
REPEATABILITY AND REPRODUCIBILITY... 10
Reference floor... 12
PRELIMINARY INVESTIGATIONS... 17
Effects of Joist Length... 17
Number of I-joists in floor ... 19
Sub-Floor attachment ... 21
Screw Tightness... 21
Screws vs. Construction adhesive and Nails... 22
Drying of concrete slab ... 24
Presence of cross-bracing in floors... 25
EFFECT OF STRUCTURAL AND MATERIAL CHANGES ... 26
Single layer results... 26
Ceiling layers... 26
Number of layers ... 33
Changes to the ceiling... 35
Type of gypsum board ... 35
Number of layers ... 35
Resilient channel effects... 36
Resilient metal channels versus other ceiling support methods... 39
Thickness and type of sound absorbing material ... 41
Effect of joist depth ... 44
Solid Wood Joists... 44
Steel Joist Depth ... 45
I-joist Depth... 46
Wood Truss Depth... 47
Effect of Joist Spacing... 49
Solid wood joists... 49
Steel Joists ... 50
Wood Trusses ... 51
Steel Joist floors... 52
Effect of gauge of steel ... 52
Type of Joist ... 54
Wood I-joist type... 55
Wood Truss-Joist Type ... 58
Improving floors... 59
CONSTRUCTION DETAILS... 63
Joist and beam layouts... 63
Gypsum board installation ... 63
Dimensions, Weights and Densities... 64
Solid Wood Joists... 64
Wood I-joists ... 64
Wood Trusses ... 65
Steel Joists, C section... 67
Floor Layers ... 67
Sound Absorbing Material ... 67
Metal Furring... 68
Wood furring strips and cross-bracing... 68
Gypsum Board ... 68
Concrete... 68
Young’s modulus... 69
LIST OF TABLES
Table 1: I-joist properties, STC and IIC ratings for nominally identical floors... 57
LIST OF FIGURES
Figure 1: Sections through the M59 floor testing facility. (Not to scale) ... 4
Figure 2: Insertion of floor frame between the upper and lower chambers... 5
Figure 3: Plan and section of test frame for supporting specimens. ... 6
Figure 4: Automated system for moving the microphone in each room. Two of the four loudspeakers used in each room are visible in the picture... 7
Figure 5: Repeat transmission loss tests on the same floor construction
(OSB15_GFB152_WJ184(406)_RC13(610)_G16). ... 11
Figure 6: Repeat tapping machine tests on the same floor construction
(OSB15_GFB152_WJ184(406)_RC13(610)_G16). ... 11
Figure 7: Airborne sound transmission loss for the reference floor. The graph shows the mean of 8 measurements. The error bars are the computed rebuild repeatability values. ... 13
Figure 8: Normalised impact sound pressure levels for the reference floor. The graph shows the mean of 8 measurements. The error bars are the computed rebuild repeatability values. ... 14
Figure 9: Rebuild and retest repeatability values for TL measurements for the reference floor. The dotted line excludes the anomalous result shown in Figure 5. ... 14
Figure 10: Rebuild and retest repeatability values for ISPL measurements for the
reference floor. ... 15
Figure 11: TL for repeat tests on completely rebuilt steel-joist floors... 16
Figure 15: Transmission loss for wood joist floors differing only in joist length. ... 19
Figure 16: Impact sound pressure levels for wood joist floors differing only in joist length. ... 19
Figure 17: Transmission loss for I-joist floors differing only in the number of I-joists used. ... 20
Figure 18: Impact sound pressure levels for joist floors differing only in the number of I-joists used. ... 21
Figure 19: Effect on transmission loss of loosening screws in an OSB sub-floor. ... 22
Figure 20: Effect on impact sound pressure level of loosening screws in an OSB sub-floor. ... 22
Figure 21: Effect of different screw spacing and adhesive attachment on transmission loss. The dimension following the test ID is the spacing between screws in the field of the floor. Edge spacing was half this value in each case. ... 23
Figure 22: Effect of different screw spacing and adhesive attachment on impact sound pressure level. The dimension following the test ID is the spacing between screws in the field of the floor. Edge spacing was half this value in each case... 24
Figure 23: Transmission loss data for a wood joist floor with a concrete topping at several intervals after the initial concrete pour. The STC was 48 in each case. ... 25
Figure 24: Sound transmission loss for single sheets of gypsum board suspended from wood joists on resilient metal channels spaced 610 mm o.c. The letter L denotes the lightweight, type 1500 board. ... 27
Figure 25: sound transmission loss for single and double sheets of 15.9 mm type X gypsum board... 27
Figure 26: Differences between single sheet and the double sheet transmission losses for the three types of gypsum board used in the project... 28
Figure 27: Sound transmission loss for three thicknesses of plywood and a double sheet of 13 mm plywood... 29
Figure 28: Normalized impact sound pressure levels for three thicknesses of plywood and a double sheet of 13 mm plywood. ... 29
Figure 29: Airborne sound transmission loss for 15 mm OSB on four joist types. ... 30
Figure 30: Normalized impact sound pressure level for 15 mm OSB on four joist types. 31
Figure 31: Increase in TL due to changing from a single layer of plywood to a double layer... 32
Figure 32: TL plots for the concrete slabs used in the project... 32
Figure 33: NISPL for the concrete slabs used in the project... 33
Figure 34: Increase in TL due to doubling of number of layers in the sub-floor. The first code in the legend denotes the subfloor material, the second code is the number of layers of gypsum board in the ceiling... 34
Figure 35: TL plots showing effect of changing sub-floor from one layer of 25 mm thick plywood to two layers of 13 mm plywood. ... 34
Figure 36: ISPL plots showing effect of changing sub-floor from one layer of 25 mm thick plywood to two layers of 13 mm plywood. ... 35
Figure 37: Increase in TL caused by adding a second layer of gypsum board. ... 36
Figure 38: Decrease in ISPL caused by adding a second layer of gypsum board. ... 36
Figure 39: Sound transmission loss for wood joist floors with four uniformly spaced resilient metal channel arrangements. ... 37
Figure 40: Impact sound pressure levels for wood joist floors with four uniformly spaced resilient metal channel arrangements. ... 37
Figure 41: TL versus the total length of resilient metal channels supporting the 15.9 mm gypsum board ceiling. The lines are best fits to the data. ... 38
Figure 43: TL for different methods of supporting a single sheet of 15.9 mm gypsum
board. ... 40
Figure 44: ISPL for different methods of supporting a single sheet of 15.9 mm gypsum board. ... 40
Figure 45: Dependence of STC on thickness of layer of sound absorbing material in a 235 mm wood joist floor (filled and unfilled circles), a 457 mm deep wood I-joist floor (filled and unfilled squares), and a 205 mm deep steel joist floor (filled and unfilled triangles). GFB = glass fibre batts, RFB = rock fibre batts, CFS = sprayed on cellulose fibre, CFL = blown-in cellulose fibre. The dimensions following these codes give the cavity depth. ... 42
Figure 46: Dependence of IIC on thickness of layer of sound absorbing material in a 235 mm wood joist floor (filled and unfilled circles), a 457 mm deep wood I-joist floor (filled and unfilled squares), and a 205 mm deep steel joist floor(filled and unfilled triangles). GFB = glass fibre batts, RFB = rock fibre batts, CFS = sprayed on cellulose fibre, CFL = blown-in cellulose fibre. The dimensions following these codes give the cavity depth. ... 42
Figure 47: Increase in TL due to different thicknesses of glass fibre in a 470 mm deep wood I-joist floor. The increases are relative to the 90 mm thickness... 43
Figure 48: Reduction in ISPL due to different thicknesses of glass fibre in a 470 mm deep wood I-joist floor. The reductions are relative to the 90 mm thickness... 43
Figure 49: TL for 38 mm solid wood joists with different depths... 45
Figure 50: ISPL for 38 mm solid wood joists with different depths. ... 45
Figure 51: TL for steel joist floors with different joist depths. ... 46
Figure 52: ISPL for steel joist floors with different joist depths. ... 46
Figure 53: TL for wood I-joists with different depths... 47
Figure 55: TL for wood truss floors with different truss depths and trusses spaced 488
mm o.c... 48
Figure 56: ISPL for wood truss floors with different truss depths and trusses spaced 488 mm o.c... 48
Figure 57: TL for wood truss floors with different truss depths and trusses spaced 610 mm o.c... 49
Figure 58: ISPL for wood truss floors with different truss depths and trusses spaced 610 mm o.c... 49
Figure 59: TL for solid wood joists (38 x 235 mm) with different joist spacing. ... 50
Figure 60: ISPL for solid wood joists (38 x 235 mm) with different joist spacing. ... 50
Figure 61: TL for steel joist floors with two different joist spacings. ... 51
Figure 62: ISPL for steel joist floors with two different joist spacings... 51
Figure 63: TL for wood truss floors with different spacing... 52
Figure 64: ISPL for wood truss floors with different spacing. ... 52
Figure 65: TL for three floors differing only in the metal gauge used to form the steel joists. ... 53
Figure 66: ISPL for three floors differing only in the metal gauge used to form the steel joists. ... 53
Figure 67: Transmission Loss for three floors with different joist types with 15 mm OSB subfloors, 150 mm of glass fibre batts, resilient metal channels 610 mm o.c. and a single layer of 15.9 mm gypsum board. ... 54
Figure 68: Normalised impact sound pressure levels for three floors with different joist types with 15 mm OSB subfloors, 150 mm of glass fibre batts, resilient metal
Figure 70: Normalized impact sound pressure levels for floors differing only in the type of
I-joist used... 56
Figure 71: Transmission loss spectra for two floors differing only in the orientation and type of lumber used to build the trusses. The first dimension is the width of the flange in contact with the OSB. The second is the depth of the flange. ... 58
Figure 72: Impact sound pressure level spectra for two floors differing only in the orientation and type of lumber used to build the trusses. The first dimension is the width of the flange in contact with the OSB. The second is the depth of the flange. 59 Figure 73: Transmission losses for base floor and upgraded versions. The coded descriptions in the legend identify the construction materials attached to the underside of the joists. ... 61
Figure 74: Impact sound pressure levels for base floor and upgraded versions. The coded descriptions in the legend identify the construction materials attached to the underside of the joists. ... 62
Figure 75: Construction of 356 mm deep wood trusses using 38 x 89 mm lumber. ... 65
Figure 76: Construction of 356 mm deep wood trusses using 38 x 64 mm lumber... 66
Figure 77: Construction of 457 mm deep wood trusses using 38 x 89 mm lumber. ... 66
INTRODUCTION
INTRODUCTION
The IRC Acoustics Laboratory recently completed the measurement phase of a study of airborne and impact sound transmission through typical floor constructions used in Canadian housing. A companion to an earlier summary report,1 this report provides the one-third octave band data measured in the project for airborne sound transmission loss and impact sound pressure level and some discussion of the major effects seen during the project. The report is intended for use by consultants, research workers and anyone who needs the detailed sound insulation spectra.
For convenience, much of the information from the summary report is reproduced in this report, however, readers may find the summary report useful.
In addition to the Institute for Research in Construction of the National Research Council Canada (IRC/NRCC), the work was supported by a consortium including
• Boise Cascade
• Canada Mortgage and Housing Corporation (CMHC),
• Canadian Home Builder Association (CHBA)
• Canadian Portland Cement Association (CPCA)
• Canadian Sheet Steel Building Institute (CSSBI),
• Canadian Wood Council (CWC)
• Cellulose Insulation Manufacturers Association of Canada (CIMAC),
• Forintek Canada Corporation (FORINTEK),
• Gypsum Association
• Gypsum Manufacturers of Canada (GMC),
• Louisiana-Pacific Incorporated
• Nascor Inc.
• Ontario Home Warranty Program
• Ontario Ministry of Housing
• Owens Corning Fibreglas Canada Inc. (OCFCI),
INTRODUCTION
of the specimens were approved as part of a structured series established collectively by the consortium.
The acoustical measurements included impact sound measurements using experimental, non-standard devices. These measurements were made to provide extra information that might be used to improve the existing standardized tapping machine test or to develop new test procedures. A third IRC report will deal with these experimental impact measurements in detail.
The combined set of over 190 specimens provides
• data for systematic evaluation of sound transmission through joist floor systems,
• data for development of prediction methods,
• data for development of improved constructions, and
• a consistent assembly of STC and IIC data needed by builders and regulators to select constructions suitable for party floors in multi-family dwellings.
Areas requiring Additional Work
To a large extent the project has successfully established the major parameters affecting the sound insulation of floors. Areas that need further work for building code purposes were listed in the summary report. Some are repeated here with problem areas of a more scientific nature.
• Few acoustical tests were done in the project using the 12.7 mm board. In some cases there seemed little, if any, difference between a floor with a 15.9 mm Type X gypsum board ceiling and the same floor with a 12.7 mm Type X gypsum board ceiling. More tests are needed to more clearly define the differences between these board types.
• More tests are needed with wood trusses to be sure that all variants of trusses are examined and to try to find a reason for the anomalously low impact insulation class ratings with these floors.
• More tests are needed with wood I-joist floors to try to determine why there is so much variability with these floors. The consistency obtained with solid wood joist construction suggests that there is a real physical reason for the variability but only experiment will establish what this reason is.
• More tests are needed with rock fibre batts and blown-in cellulose to more clearly define what advantage these materials have over glass fibre batts.
INTRODUCTION
• The impact insulation provided by a floor is, for the ISO tapping machine, extremely dependent on the compliance of the surface layer of the floor. Some work is being done in a separate project to study the influence of floor toppings on impact sound insulation but the topic is complicated and very extensive; more work would definitely be useful.
MEASUREMENT PROCEDURES
MEASUREMENT PROCEDURES
M59 test facility.
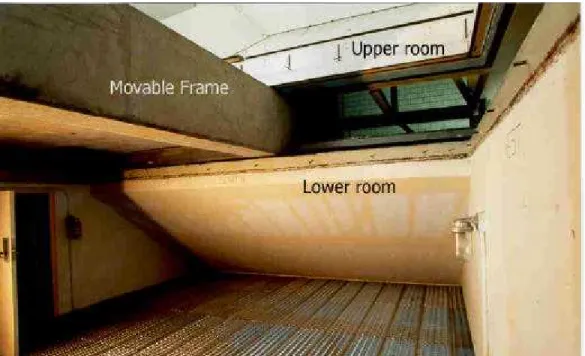
The M59 floor test facility (Figure 1) comprises two rooms2 with volumes of about 175 m3 (Room volumes change when specimens of different thicknesses are installed). The bottom room is constructed of 30 cm thick poured concrete and is supported on steel springs and neoprene placed under the floor. The upper room is constructed from steel studs and layers of particleboard. It is supported on steel columns that in turn rest on steel springs and neoprene supports.
Test specimen Concrete test frame I nflatable neoprene seals mesh floor for in-situ modifications Frame Motion Rails to support movable test frame
Test specimen
EW section
NS section
MEASUREMENT PROCEDURES
Floor specimens are constructed in one of two concrete test frames that can be removed from between the reverberation rooms and lifted by a crane to a storage area or to the floor of the main laboratory. Figure 2 shows the frame partly inserted between the rooms. The dimensions of the test frames are shown in Figure 3. The floor specimen opening measures 3.8 x 4.7 m. Gaps between the upper and lower chambers and the edges of the movable frame are sealed with inflatable gaskets. To reduce transmission around or through the frame, shields are placed over the exposed parts of the frame in the upper room after the frame and specimen are installed between the rooms. In addition to the inflatable gaskets, backer rod? and tape are used to further seal the gap between the lower room lip and the test frame.
Figure 2: Insertion of floor frame between the upper and lower chambers.
MEASUREMENT PROCEDURES 5410 mm 4957 mm 4700 mm 4883 mm 4039 mm 3785 mm 355 700 510 230 540 700 510 420
Figure 3: Plan and section of test frame for supporting specimens.
In each room a microphone is mounted at the end of a scissors-jack arrangement that is attached to a boom that turns about an axis near the middle of the ceiling. The scissors-jack moves along the boom and lowers and raises the microphone. Stepping motors set the microphone position and nine microphone positions are used in each room. (See Figure 4)
Airborne Sound — ASTM E90
Measurements of airborne sound transmission are made in accordance with ASTM E903. In the M59 floor test facility sound is generated in one room using four loudspeaker systems, each with its own noise generator and amplifier. The movable microphone in each room measures the sound pressure levels and sound decay rates at frequencies from 50 to 6300 Hz. The information collected is used to calculate sound transmission loss (TL) and sound transmission class (STC) according to ASTM E4134. Measurements are made with each room in turn serving as the source room and the two sets of results are averaged.
MEASUREMENT PROCEDURES
Figure 4: Automated system for moving the microphone in each room. Two of the four loudspeakers used in each room are visible in the picture.
Impact Sound — ASTM E492
Transmission of impact sound through floors is measured in accordance with ASTM E4925. A standardised tapping machine incorporating 5 steel-faced hammers is placed on the floor under test in four specified positions. A motor drives the hammers so they each strike the floor surface twice per second for a total rate of 10 impacts per second. Sound pressure levels and decay rates are measured in the room below. In this report, measurements are presented from 50 to 6300 Hz. The information collected is used to calculate the normalised impact sound pressure level and the impact insulation class (IIC) according to ASTM E9896. In the report normalised impact sound pressure level is referred to using the acronym ISPL. All impact sound pressure levels presented in the report are normalised.
CODING SYSTEM FOR SPECIMEN DESCRIPTION
CODING SYSTEM FOR SPECIMEN DESCRIPTION
To avoid the tedium of reading long descriptions of floor constructions a coding system is used throughout the report. Each layer in a floor is coded as follows:
• an integer representing the number of sheets of material
• a sequence of letters to indicate the material in the layer
• a number representing the thickness in mm of each sheet in the layer.
If the number of sheets in a layer is one, the leading 1 is omitted. Underbars separate layers. The coding system is applied to beam-like floor elements, such as joists and resilient metal channels, that do not constitute layers. For such elements, the number following the letters is the depth of each element—the dimension along the axis perpendicular to the plane of the floor—and the number in parentheses following the depth code is the separation between each beam-like element.
Thus the code OSB15_WJ235(406)_GFB150_RC13(610)_2G15.9 describes the following floor:
• A 15 mm thick OSB subfloor.
• 38 x 235 mm wood joists, 406 mm on centres (o.c.)
• 150 mm thick glass fibre batts in the joist cavities.
• 13 mm deep resilient metal channels screwed 610 mm o.c. perpendicular? to the joists
• Two layers of gypsum board?, 15.9 mm thick, applied to the resilient metal channels. This coding system is used in the detailed tables at the end of this report and in the computer files on the accompanying disk. The coding system simplifies computer searches for particular constructions.
In some instances in figures comparing specimens, n or xxx is used to indicate that a parameter is being varied. Thus nOSB15 indicates that the number of layers of oriented
?
In the project, all resilient metal channels were applied at right angles to the joists.
?
CODING SYSTEM FOR SPECIMEN DESCRIPTION
strandboard varies and RC13(xxx) indicates that the spacing between resilient metal channels varies.
The codes used to identify materials are given in the table below.
CAR Carpet
UND Underpad
VIN Vinyl flooring
PLY Plywood
OSB Oriented strandboard
WFB Wood fibre board
WPB Wood particle board
WJ Wood joists (solid)
SJ Steel joists
WT Wood truss-joists
WI Wood I-joists
GFB Glass fibre batts
MFB Mineral fibre batts
CFL Blown-in cellulose fibre
CFS Sprayed-on cellulose fibre (to underside of subfloor and sides of joists)
RC Resilient metal channels
UC U-channels
CC C-channels
WFUR Wood furring
REPEATABILITY AND REPRODUCIBILITY
REPEATABILITY AND REPRODUCIBILITY
For comparing test results within a series of measurements or among laboratories two concepts are important: reproducibility and repeatability.
Reproducibility is defined as the closeness of agreement between results obtained on
nominally identical test specimens with the same test method in different laboratories. This includes deviations due to systematic differences between facilities and equipment, variations in implementation of the test procedures, and uncontrolled differences in the specimen and its installation. The reproducibility is a characteristic of the test method that must be determined by an inter-laboratory comparison study. Reproducibility values are likely to depend on the kind of specimen being measured. In ISO 140, reproducibility values for measurements of airborne sound transmission loss range from 3 dB at mid-frequencies to 7 dB at low mid-frequencies (See Figure 9). Values should agree within this range 19 times out of 20. It is because of this large uncertainty that systematic studies in one laboratory (like that reported here) are needed for clear comparisons. The only reproducibility values available for ASTM E90 are for a reference steel panel and are given in ASTM E12897.
Repeatability may be defined as the closeness of agreement between independent
results obtained with the identical test specimen in the same laboratory with the same equipment and test method by the same operator within a short time period. Estimates of this repeatability can be made by running the same test several times in succession without disturbing the specimen in any way. Computer-controlled tests repeated in this manner usually show negligible variation. The repeatability so determined represents the limit associated with the measurement conditions specified by the computer program, for example, the integration time used to measure the sound pressure levels and the number of microphones used in each room. Changes in room temperature or humidity might also be a factor. This repeatability is of limited interest.
In this project, besides airborne sound transmission loss measurements, several different impact tests were routinely conducted on each floor specimen. Some of these used quite severe impacts that might have caused significant changes to the test specimen. So a more useful estimate of repeatability was obtained by running over a period of several days complete sets of all tests normally conducted. Thus any environmental effects and possible changes due to violent impacts are included in the estimate of repeatability
REPEATABILITY AND REPRODUCIBILITY
which is here termed the re-test repeatability. Tests were made in this way on the same specimen nine times over a period of 13 days. Eight of the STC ratings obtained were 50 and one was 51. Only 8 tapping machine tests were run; 4 gave IIC ratings of 45 and 4 gave ratings of 46. The airborne and impact data are plotted in Figure 5 and Figure 6.
Repeatability - tests done on the same floor construction over several days, nothing changed between tests
10 20 30 40 50 60 70 80 63 125 250 500 1 k 2k 4k Frequency, Hz Transmission Loss, dB TLF-95-159a STC 50 TLF-95-161a STC 50 TLF-95-163a STC 51 TLF-95-165a STC 50 TLF-95-167a STC 50 TLF-95-169a STC 50 TLF-95-171a STC 50
Figure 5: Repeat transmission loss tests on the same floor construction (OSB15_GFB152_WJ184(406)_RC13(610)_G16).
Repeatability - tests done on the same floor construction over several days, nothing changed between tests
20 30 40 50 60 70 80 90 63 125 250 500 1 k 2 k 4k Frequency, Hz ISPL, dB IIF-95-061 IIC 44 IIF-95-062 IIC 44 IIF-95-063 IIC 44 IIF-95-064 IIC 44 IIF-95-065 IIC 44 IIF-95-066 IIC 43 IIF-95-067 IIC 44
REPEATABILITY AND REPRODUCIBILITY
frequency range. Because the differences are confined to a small frequency range, one can say that they are not due to some program or calibration error. Instead, they must be associated with some physical change in the floor. Note that there are no such
differences for the impact tests in Figure 6. It is possible that there were physical changes as a result of the pounding from the ISO tapping machine and the other impactors used in the project, but one can only speculate. The re-test repeatability values obtained from these data are plotted in Figure 9 and Figure 10. Two values of re-test r are presented for airborne measurements: one that includes the anomalous test and one that does not.
Reference floor
Rebuild repeatability may be defined as the closeness of agreement between results
obtained with the same test method in the same laboratory on nominally identical test specimens constructed with nominally identical materials. Since the laboratory, measurement methods and equipment remain constant, any variance found reflects variations in materials and installation techniques and possible unknown effects.
To investigate rebuild repeatability, the same floor was constructed and tested eight times in the laboratory over a period of about 1 year using new materials each time. The floor construction consisted of
• a 15 mm thick OSB subfloor.
• 38 x 235 mm wood joists, 406 mm o.c.
• a layer of 152 mm thick glass fibre batts in the joist cavities.
• 13 mm deep resilient metal channels screwed 610 mm o.c. perpendicular to the joists
• one layer of Type X gypsum board, 15.9 mm thick, applied to the resilient metal channels.
The reference floor
OSB15_WJ235(406)_GFB152_RC13(610)_G15.9
This floor is referred to as the reference floor in the report and the average of the eight tests as Mean ref in the tables.
For the reference floor, Figure 7 shows the mean transmission losses and the computed rebuild repeatability values as error bars. Figure 8 gives the corresponding information for
REPEATABILITY AND REPRODUCIBILITY
the impact sound pressure levels. The retest and rebuild repeatability values are themselves displayed in Figure 9 and Figure 10.
As expected, the rebuild repeatability is greater than the re-test repeatability. It is surprising, however, to note that the reproducibility given for the ISO tapping machine test in ISO140-2 is smaller at some frequencies than the rebuild r. The reason for this becomes clear on reading the footnote in ISO 140-2 that says the reproducibility values are based on tests made by different measurement teams on the same 140 mm slab in a
single laboratory. While this may be the best information available, it is not a valid
measure of reproducibility.
The repeatability that is relevant when comparisons are being made among floors depends on whether the floors were completely rebuilt or only had minor changes made to one of them before re-testing. For minor changes, for example adding an additional layer of gypsum board, the re-test repeatability would give more appropriate estimates of the uncertainty associated with the measurement.
Reference floor OSB15_WJ235(406)_GFB152_RC13(610)_G16. Re-built with new materials each time
10 20 30 40 50 60 70 80 63 125 250 500 1k 2 k 4 k Frequency, Hz Transmission Loss, dB Mean Ref STC 52
Figure 7: Airborne sound transmission loss for the reference floor. The graph shows the mean of 8 measurements. The error bars are the computed rebuild repeatability values.
REPEATABILITY AND REPRODUCIBILITY
Reference floor OSB15_WJ235(406)_GFB152_RC13(610)_G16. Re-built with new materials each time
20 30 40 50 60 70 80 90 63 125 250 500 1 k 2 k 4k Frequency, Hz ISPL, dB
Mean Ref IIC 46
Figure 8: Normalised impact sound pressure levels for the reference floor. The graph shows the mean of 8 measurements. The error bars are the computed rebuild repeatability values.
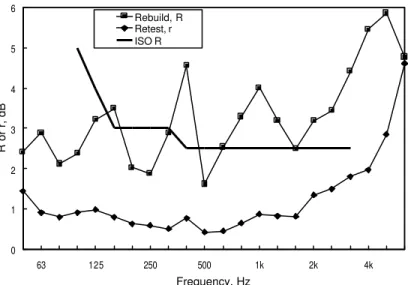
0 1 2 3 4 5 6 7 8 63 125 250 500 1 k 2 k 4k Frequency, Hz R or r, dB Rebuild R Retest r ISO R 2nd retest r
Figure 9: Rebuild and retest repeatability values for TL measurements for the reference floor. The dotted line excludes the anomalous result shown in Figure 5.
REPEATABILITY AND REPRODUCIBILITY 0 1 2 3 4 5 6 63 125 250 500 1k 2k 4k Frequency, Hz R or r, dB Rebuild, R Retest, r ISO R
Figure 10: Rebuild and retest repeatability values for ISPL measurements for the reference floor.
Four of the STC ratings obtained for the re-builds of the reference floor were 51 and four were 52. Four of the IIC ratings were 45 and four were 46. The data from these
measurements were used to estimate rebuild repeatability for the STC and IIC ratings. For the purposes of this report, a change of more than 1 point in the STC or IIC rating may be taken as significant and can be attributed to a change in the specimen. A change of only 1 should be regarded as not significant unless an examination of the 1/3 octave band data shows significant changes.
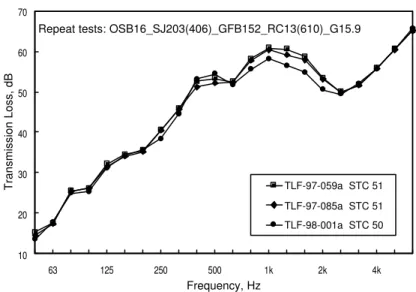
During the project a steel joist floor, nominally identical to the reference floor except for the joists used, was constructed three times. Only airborne transmission loss tests were conducted on the three specimens. There are too few tests to allow any estimate of rebuild repeatability but the data in Figure 11 suggest that one might expect more variability with this type of joist, at least around 1 kHz.
REPEATABILITY AND REPRODUCIBILITY
Repeat tests: OSB16_SJ203(406)_GFB152_RC13(610)_G15.9
10 20 30 40 50 60 70 63 125 250 500 1k 2k 4k Frequency, Hz
Transmission Loss, dB TLF-97-059a STC 51 TLF-97-085a STC 51 TLF-98-001a STC 50
Figure 11: TL for repeat tests on completely rebuilt steel-joist floors.
The IRC Acoustics laboratory has a 150-mm thick concrete slab that is used as a reference specimen and is installed and re-tested repeatedly. Six measurements of the standard installation are available. Although the data were not collected as part of this project, they are included here because of their relevance to this section. Yet another kind of repeatability, the re-install repeatability can be calculated and the values are shown in Figure 12: . Comparisons among these measured repeatabilities and the ISO values are interesting but will not be presented here.
Re-install repeatability for 150 mm concrete slab
0 2 4 6 8 10 12 63 125 250 500 1k 2 k 4k Frequency, Hz repeatability, dB TL ISPL
PRELIMINARY INVESTIGATIONS —Effects of Joist Length
PRELIMINARY INVESTIGATIONS
Before embarking on a long series of measurements, several construction variables were investigated to determine whether they had a significant effect on sound transmission. The reference floor construction described in the previous section was used to investigate them.
Effects of Joist Length
Some theoretical considerations and published experimental data suggested that the length of the joists in a floor would have a significant effect on sound transmission. To test this hypothesis a movable concrete support was constructed that allowed the test frame to support wood-joist floors with different joist lengths. This device is sketched in Figure 13 and Figure 14. A dimensioned drawing of the test frame is shown in Figure 3. The filler section shown in Figure 14 held pieces of a 150 mm thick concrete slab, sound absorbing material and gypsum board so sound transmission through this section was negligible relative to that through the test floor.
The reference floor was first constructed to completely fill the test frame with 4.85-m long joists parallel to the long axis of the frame. Two sets of 19 x 64 mm cross-bridging were installed between the joists 1617 mm from each edge of the floor. After testing, part of the OSB layer and the gypsum board were removed at one end and the joists cut to the new length. The movable support was inserted, the floor repaired and the filler section constructed and sealed. This process was repeated for joist lengths of 4.34, 3.45 and 2.92 m. The floor was also re-constructed as a full-size floor with the joists perpendicular to the long axis of the specimen frame (joist length 3.92 m). The one-third octave band plots of data for these tests (Figure 15 and Figure 16) show no significant variations at low frequencies that might be attributed to joist length. It was surprising that there was so little change in the results when the joist length ranged from 2.92 to 4.85 m, but the data are clear. On the basis of this result, it was decided that joist length was not an important factor and that for convenience, all floors would be constructed with joists or trusses parallel to the short axis of the specimen frame.
PRELIMINARY INVESTIGATIONS —Effects of Joist Length
Test
Frame
Movable
section
of movable
End view
section
700
190
420
540
360
Figure 13: The movable concrete support used to change the floor size by supporting different joist lengths.
Movable support
Filler section
Test Frame
Joists
Figure 14: Illustration of the use of the movable concrete support when testing floors with different joist lengths.
PRELIMINARY INVESTIGATIONS —Number of I-joists in floor OSB15_WJ235(406)_GFB152_RC13(610)_G16 10 20 30 40 50 60 70 80 63 125 250 500 1k 2k 4 k Frequency, Hz T ra n s m is s io n L o s s , d B TLF-95-035a STC 51 4.85 m TLF-95-037a STC 52 4.34m TLF-95-039a STC 51 3.45m TLF-95-041a STC 51 2.92 m Mean Ref STC 52 3.92 m
Figure 15: Transmission loss for wood joist floors differing only in joist length.
OSB15_WJ235(406)_GFB152_RC13(610)_G16 25 35 45 55 65 75 85 63 125 250 500 1k 2k 4 k Frequency, Hz Normalized ISPL, dB IIF-95-005 IIC 44 4.85 m IIF-95-006 IIC 46 4.34 m IIF-95-007 IIC 46 3.45 m IIF-95-008 IIC 46 2.92 m
Mean Ref IIC 46 3.92 m
Figure 16: Impact sound pressure levels for wood joist floors differing only in joist length.
Number of I-joists in floor
PRELIMINARY INVESTIGATIONS —Number of I-joists in floor
There are two possible methods of constructing a floor with joists spaced 406 mm o.c. in the floor test frame: one using thirteen equally spaced joists with no joist on the midline of the floor and one using fourteen joists with one placed on the midline of the floor. The second arrangement results in two smaller cavities at each end of the floor and was expected to give lower sound insulation. The arrangement with 13 joists was used throughout the project. However, to verify the hypothesis that there would be an effect due to the joist layout, two floors were constructed using 13 and then 14 wood I-joists with the construction being
1 layer of 15 mm OSB subfloor
241 mm deep wood I-joists, 406 mm o.c. 152 mm glass fibre batts
resilient metal channels, 406 mm o.c. one layer of 15.9 mm gypsum board
The effect on the sound insulation can be seen in Figure 17 and Figure 18. The
differences around 125 Hz are the primary cause of changes in the STC and IIC. There are also significant differences from 500 to 1000 Hz but these do not affect the STC and IIC. As expected, using fewer joists gives better sound insulation although the effects are small in this case.
OSB15_WI241(406)_GFB152_RC13(610)_G15.9 10 20 30 40 50 60 70 80 63 125 250 500 1k 2k 4k Frequency, Hz Transmission Loss, dB TLF-97-025a STC 47, 14 beams TLF-97-029a STC 48, 13 beams
Figure 17: Transmission loss for I-joist floors differing only in the number of I-joists used.
PRELIMINARY INVESTIGATIONS —Sub-Floor attachment OSB15_WI241(406)_GFB152_RC13(610)_G15.9 25 35 45 55 65 75 85 63 125 250 500 1k 2k 4k Frequency, Hz ISPL, dB
IIF-97-013 IIC 41 14 beams IIF-97-015 IIC 42 13 beams
Figure 18: Impact sound pressure levels for I-joist floors differing only in the number of I-joists used.
Sub-Floor attachment
Screw Tightness
One issue that was addressed was the possibility of changes in sound reduction caused by changes in the tightness of the screws attaching the sub-floor to the joists. In practice, changes in tightness could be caused by changes in the moisture content of the wood after installation, or by variations in workmanship during installation. To test the significance of screw tightness, the reference floor was constructed with floor screws tightened normally and then loosened in 1/4 turn increments until they had been loosened by 1 full turn. Measurements were made at each stage. There were no significant differences in the STC or the IIC ratings, but there were differences in the transmitted sound energy at the frequencies above 500 Hz; as the screws were loosened, less sound was transmitted (Figure 19 and Figure 20).
When this experiment was repeated with a 15 mm thick plywood subfloor instead of the OSB subfloor, similar results were obtained; all the STC values were 50, two IIC values were 43 and three were 44.
PRELIMINARY INVESTIGATIONS —Sub-Floor attachment OSB15_WJ235(400)_GFB152_RC13(600)_G15.9, STC 50 1 0 2 0 3 0 4 0 5 0 6 0 7 0 6 3 125 250 500 1k 2k 4k Frequency, Hz Transmission Loss, dB TLF-95-133a, tight, STC 51 TLF-95-135a, -1/4 turn, STC 50 TLF-95-137a, -1/2 turn, STC 50 TLF-95-139a, -3/4 turn, STC 50 TLF-95-141a, -1 turn, STC51
Figure 19: Effect on transmission loss of loosening screws in an OSB sub-floor.
PLY16_WJ235(406)_GFB152_RC13(610)_G15.9 3 0 3 5 4 0 4 5 5 0 5 5 6 0 6 5 7 0 7 5 8 0 63 125 250 500 1k 2 k 4k Frequency, Hz ISPL, dB
IIF-95-048, tight, IIC 43 IIF-95-049, -1/4 turn, IIC 43 IIF-95-050, -1/2 turn, IIC 44 IIF-95-051, -3/4 turn, IIC 44 IIF-95-052, -1 turn, IIC 44
Figure 20: Effect on impact sound pressure level of loosening screws in an OSB sub-floor.
Screws vs. Construction adhesive and Nails
The possibility that there might be a difference between screwing the OSB subfloor to the joists and attaching it with construction adhesive and nails was also examined. During the project, using only screws to attach the subfloor was obviously preferable as it allowed changes to be made easily to the subfloor or the sound absorbing material in the cavity. If using construction adhesive had given different results, then more tests with construction adhesive would have been necessary.
PRELIMINARY INVESTIGATIONS —Sub-Floor attachment
It was also possible that using extra screws to attach the subfloor would have given the same result as using construction adhesive. To investigate these possibilities, the normal screw spacing used to attach the OSB subfloor to the joists (300 mm o.c.) was halved and then halved again. The OSB subfloor was then removed and re-attached using construction adhesive and nails.
Fortunately, the results (Figure 21 and Figure 22) showed that the attachment methods gave no significant differences in either the one-third-octave band plots, or the STC and IIC values. Being able to use screws to attach the floor sheathing greatly simplifies changes to constructions. Consequently, during the project all floors were screwed to the joists. OSB15_WJ235(400)_GFB152_RC13(600)_G15.9 1 0 2 0 3 0 4 0 5 0 6 0 7 0 8 0 63 125 250 500 1k 2k 4k Frequency, Hz TL, dB TLF-95-043a, 300 mm, STC 51 TLF-95-053a, 150 mm, STC 50 TLF-95-055a, 75 mm, STC 50
TLF-95-057a, nails and adhesive, STC 51
Figure 21: Effect of different screw spacing and adhesive attachment on transmission loss. The dimension following the test ID is the spacing between screws in the field of the floor. Edge spacing was half this value in each case.
PRELIMINARY INVESTIGATIONS —Drying of concrete slab OSB15_WJ235(406)_GFB152_RC13(610)_G15.9 25 35 45 55 65 75 85 63 125 250 500 1 k 2k 4k Frequency, Hz Normalized ISPL, dB
Mean Ref, 300 mm, IIC 46 IIF-95-014, 150 mm, IIC 46 IIF-95-015, 75 mm, IIC 46
IIF-95-016, nails and adhesive, IIC 46
Figure 22: Effect of different screw spacing and adhesive attachment on impact sound pressure level. The dimension following the test ID is the spacing between screws in the field of the floor. Edge spacing was half this value in each case.
Drying of concrete slab
According to ASTM acoustical testing standards, concrete constructions should be allowed to cure for 28 days before testing unless data are available to show that a shorter period of curing will suffice. When a 35 mm concrete slab was poured on top of a wood joist floor, we had the opportunity to measure the sound transmission through the floor as it was drying. Such data are useful within the laboratory, the project, and to other
laboratories that might wish to use a shorter curing time for similar specimens. The construction of the floor was
• 35 mm concrete
• 1 layer of 15 mm OSB subfloor
• 38 x 235 mm wood joists, 406 mm o.c.
• 152 mm glass fibre batts in the joist cavities
• 1 layer of 15.9 mm gypsum board.
Figure 23 shows that the TL spectrum did not change significantly after the 5th day.
To avoid potential damage to the concrete, the first impact test using the ISO tapping machine was not conducted until the 14th day. The IIC rating varied from 27 to 28 due to
PRELIMINARY INVESTIGATIONS —Presence of cross-bracing in floors
variations of around 0.5 dB at 2500 Hz that caused the 8 dB rule in ASTM E989 to be activated. CON35_OSB15_WJ235(406)_GFB152_G15.9 20 30 40 50 60 70 80 90 100 63 125 250 500 1k 2k 4k Frequency, Hz Transmission Loss, dB TLF-96-123a, 5 days TLF-96-125a, 10 days TLF-96-129a, 14 days TLF-96-133a, 20 days TLF-96-135a, 25 days TLF-96-139a, 28 days
Figure 23: Transmission loss data for a wood joist floor with a concrete topping at several intervals after the initial concrete pour. The STC was 48 in each case.
Presence of cross-bracing in floors
To determine whether the presence of cross-bracing in the floors had any significant effect on the sound insulation, two floor specimens were constructed. Each floor was constructed with a single row of bracing on the mid-line and tested. The cross-bracing was then removed, the floor re-assembled and tested again. The cross-cross-bracing had no significant effect on the sound insulation in either case.
EFFECT OF STRUCTURAL AND MATERIAL CHANGES—Single layer results
EFFECT OF STRUCTURAL AND MATERIAL CHANGES
During the project, many variables were investigated to determine their effect on sound insulation. Where possible the reference floor was used as a starting point for variations and only one floor element was varied within a series. For example, where the joist type was varied, the subfloor, sound absorbing material, resilient metal channel arrangement and ceiling layer were kept the same. The floor description is not always given in words but can usually be found in coded form in the relevant figures.
Single layer results
Data for single layers comprising one or more sheets of material aid in developing prediction models. Also, simple situations sometimes give insight that may be relevant to more complicated cases. So, at convenient times in the project sound insulation was measured for some single layer constructions.
Ceiling layers
Figure 24 shows sound transmission loss for the three thicknesses of gypsum board used during the project. A few points are worth noting about these spectra. As the mass of the board increases, so does the transmission loss until the coincidence dip begins to have an effect. It is odd that all three specimens gave the same transmission loss at 50 Hz. This may be due to chance. The dip in the curves around 100 Hz also needs an explanation but none is available. It may be related to the response of the reverberation rooms, the spacing between the resilient metal channels or the size of the gypsum board panels.
EFFECT OF STRUCTURAL AND MATERIAL CHANGES—Single layer results 10 15 20 25 30 35 40 63 125 250 500 1k 2k 4k Frequency, Hz Transmission Loss, dB G16 STC 29 G13 STC 29 G13L STC 27
Figure 24: Sound transmission loss for single sheets of gypsum board
suspended from wood joists on resilient metal channels spaced 610 mm o.c. The letter L denotes the lightweight, type 1500 board.
Figure 25 shows transmission losses for single and double layers of 15.9 mm gypsum board. Note that the dip around 100 Hz is still evident. The increase in transmission loss due to the second layer of gypsum board is fairly constant up to about 400 Hz at which point there is a reduction. From about 400 Hz to 1600 the additional weight is less effective. Corresponding plots for the other two types of gypsum board show similar behaviour. 15 20 25 30 35 40 45 Transmission Loss, dB G16 STC 29 2G16 STC 35
EFFECT OF STRUCTURAL AND MATERIAL CHANGES—Single layer results
The probable explanation for this behaviour becomes more evident when differences between the single sheet and the double sheet results are plotted in Figure 26. Some resonance phenomenon is causing a reduction in the transmission loss for the double sheet layer. Other work in this laboratory9 has shown that although two sheets of material may be nominally in contact, the contact is not perfect and there is usually some air confined between the sheets. The trapped air enables a mass-air-mass resonance to occur and reduce the TL. The calculated thickness of the trapped air is about 1 mm in each case. This is not an unreasonable number.
In cavity walls or floors where each layer may comprise more than one sheet of material, the effects of this resonance will still be seen in the transmission loss plots for the composite specimen. 1 2 3 4 5 6 7 8 9 6 3 125 250 500 1k 2k 4k Frequency, Hz
Difference in Transmission Loss, dB
G16 G13 G13L
Figure 26: Differences between single sheet and the double sheet transmission losses for the three types of gypsum board used in the project.
Floor layers on joists
Only two thicknesses of oriented strand board (OSB) were used in the project: 15 and 19 mm. The single layer TL data obtained for them were not very different and are not plotted here.
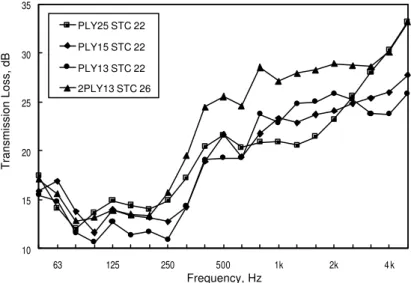
Three thicknesses of plywood were used. The transmission losses are plotted in Figure 27 and the normalised ISPLs in Figure 28. The TL plot is much more complicated than that for the gypsum board partly because plywood is strongly orthotropic, having quite different stiffnesses along and across the panel. This leads to a much broader
EFFECT OF STRUCTURAL AND MATERIAL CHANGES—Single layer results
coincidence dip and sensitivity to damping over more of the frequency range of interest. Furthermore, the attachment of the subfloor to the supporting joists produces more complicated systems than gypsum board supported on resilient channels. The joist depth, joist spacing and type of joist may all affect the sound transmission. Note that in both figures the sound insulation for two sheets of 13 mm plywood is significantly greater than that for a single sheet of 25 mm plywood.
10 15 20 25 30 35 63 125 250 500 1k 2k 4 k Frequency, Hz Transmission Loss, dB PLY25 STC 22 PLY15 STC 22 PLY13 STC 22 2PLY13 STC 26
Figure 27: Sound transmission loss for three thicknesses of plywood and a double sheet of 13 mm plywood.
60 65 70 75 80 85 90 95 100 105 ISPL, dB PLY25 IIC 14 PLY16 IIC 18 PLY13 IIC 20 2PLY13 IIC 22 WJ235(406)
EFFECT OF STRUCTURAL AND MATERIAL CHANGES—Single layer results
Figure 29 shows measured variations in sound transmission loss for 15 mm OSB on four joist types. The corresponding ISPL plots are shown in Figure 30. There are large variations in the sound insulation associated with joist spacing and depth. From this limited set of data, one cannot say what dependence there is on joist type. The I-joists and the solid wood joists give results that are quite similar when spacing and depth are the same.
Variations of this magnitude increase the difficulty of predicting sound insulation for single layer floors. Parameters such as joist depth and spacing have to be included in
calculation models. While this may be a difficulty for modelling single-layer floors, for complete, double-layer floors other factors may be more important.
10 15 20 25 30 35 40 63 125 250 500 1k 2k 4k Frequency, Hz Transmission Loss, dB OSB15_WJ235(406) STC 24 OSB15_WJ235(610) STC 25 OSB15_WI457(406) STC 25 OSB15_WI241(406) STC 24
EFFECT OF STRUCTURAL AND MATERIAL CHANGES—Single layer results 50 55 60 65 70 75 80 85 90 95 100 63 125 250 500 1k 2k 4k Frequency, Hz
Impact Sound Pressure Level, dB
OSB15_WJ235(406) IIC 20 OSB15_WJ235(610) IIC 19 OSB15_WI457 IIC 21 OSB15_WI241 IIC 18
Figure 30: Normalized impact sound pressure level for 15 mm OSB on four joist types.
Figure 26 showed evidence of a mass-air-mass resonance for double layers of gypsum board. Figure 31 shows a similar difference plot for single and double layers of 13 and 15 mm plywood. The dip in the curve around 1600 Hz may be attributed to the same resonance mechanism. The frequency where the dip occurs is higher due to the lower mass of the plywood relative to the gypsum board and possibly also to a smaller residual air-gap. The layers of plywood are likely to be in closer contact because they are screwed firmly to the supporting joists, which are closer together than the resilient metal channels supporting the gypsum board. The depth of the resonance is less presumably because of greater contact between the plywood layers, which leads to greater damping due to friction.
EFFECT OF STRUCTURAL AND MATERIAL CHANGES—Single layer results nPLYxx_WJ235(406) -1 0 1 2 3 4 5 6 7 8 63 125 250 500 1k 2k 4k Frequency, Hz
Difference in Transmission Loss, dB
PLY15 PLY13
Figure 31: Increase in TL due to changing from a single layer of plywood to a double layer.
Concrete slabs
Only three concrete slabs were constructed and tested during the project; two had uniform cross-sections and one was ribbed. The TL plots and the ISPL plots are shown in Figure 32 and Figure 33. These plots include results for a 40 mm slab supported on 15 mm OSB on joists. 20 30 40 50 60 70 80 90 63 125 250 500 1k 2k 4 k Frequency, Hz Transmission Loss, dB CON152 STC 52 CON100 STC 47 CorCON151 STC 51 CON40_OSB15_WJ235(406) STC 41
EFFECT OF STRUCTURAL AND MATERIAL CHANGES—Changes to the sub-floor 50 55 60 65 70 75 80 85 90 95 63 125 250 500 1k 2k 4 k Frequency, Hz ISPL, dB CON152 IIC 27 CON100 IIC 20 CorCON151 IIC 21 CON40_OSB15_WJ235 IIC 15
Figure 33: NISPL for the concrete slabs used in the project.
Changes to the sub-floor
In this section the changes that are discussed are changes that were made using the basic structure of the reference floor. So, in each case the joists were 235 mm deep (406 mm o.c.), resilient metal channels were 610 mm o.c and there was 152 mm of glass fibre in the cavity.
Changing material
Changes in sub-floor thickness, such as changing from 15 to 19 mm OSB or from 16 to 25 mm plywood, had only a small effect on TL or ISPL. The changes were consistent with the changes in weight of the sub-floor so no comparison plots are shown here.
Number of layers
Adding a second layer to the sub-floor also gave results that were consistent with what might be expected from doubling the weight. It was shown in Figure 26 that the TL spectra for double layers of gypsum board showed evidence of a mass-air-mass resonance. The corresponding plot for double layers of OSB (Figure 31) did too. The
EFFECT OF STRUCTURAL AND MATERIAL CHANGES—Changes to the sub-floor X_GFB152_WJ235(406)_RC13(610)_nG16 -4 -2 0 2 4 6 8 10 63 125 250 500 1k 2k 4k Frequency, Hz
Increase in Transmission Loss, dB
OSB15 1G16 OSB15 2G16 PLY15 2G16
Figure 34: Increase in TL due to doubling of number of layers in the sub-floor. The first code in the legend denotes the subfloor material, the second code is the number of layers of gypsum board in the ceiling.
Changing the number of layers in the sub-floor while maintaining the same mass per unit area produced more interesting results. Figure 35 and Figure 36 show changes due to substitution of two layers of 13 mm plywood for a single 25 mm layer. There are
significant improvements in TL from 250 to 2500 Hz and over a slightly wider frequency range for ISPL. The same effect was seen for the plywood sub-floors tested without ceilings (Figure 27 and Figure 28).
nPLYxx_WJ235(406)_GFB152_RC13(610)_2G15.9 10 20 30 40 50 60 70 80 63 125 250 500 1 k 2k 4k Frequency, Hz Transmission Loss, dB TLF-95-131a STC 58 2PLY13 TLF-96-065a STC 56 PLY25
Figure 35: TL plots showing effect of changing sub-floor from one layer of 25 mm thick plywood to two layers of 13 mm plywood.
EFFECT OF STRUCTURAL AND MATERIAL CHANGES—Changes to the ceiling nPLYxx_WJ235(406)_GFB152_RC13(610)_2G15.9 20 30 40 50 60 70 80 90 6 3 125 250 500 1 k 2k 4k Frequency, Hz ISPL, dB 2PLY13, IIC 53 PLY25, IIC 48
Figure 36: ISPL plots showing effect of changing sub-floor from one layer of 25 mm thick plywood to two layers of 13 mm plywood.
Changes to the ceiling
Type of gypsum board
Changing the type of the gypsum board used in the floors caused changes in
transmission loss and impact sound pressure level that were in accord with the changes in weight. No comparison plots are shown here.
Number of layers
Adding a second layer of gypsum board increased sound insulation in accord with the additional weight. Earlier, the mass-air-mass resonance that occurs between two layers of gypsum board tested as a ceiling only was shown to cause a dip in the transmission loss curves around 1000 Hz. The resonance still occurs in complete floors. Figure 37 and Figure 38 show the changes that result from adding a second layer of gypsum board. The resonance dip is obvious and quite narrow in two cases, but rather broad for the double layer of 15.9 mm gypsum board.
EFFECT OF STRUCTURAL AND MATERIAL CHANGES—Resilient channel effects OSB15_GFB152_WJ235(406)_RC13(610)_nGxx 1 2 3 4 5 6 7 6 3 125 250 500 1k 2k 4k Frequency, Hz
Increase in Transmission Loss, dB
G16 G13 G13L
Figure 37: Increase in TL caused by adding a second layer of gypsum board.
0 1 2 3 4 5 6 7 8 63 125 250 500 1k 2k 4k Frequency, Hz Decrease in ISPL, dB G16 G13 G13L
Figure 38: Decrease in ISPL caused by adding a second layer of gypsum board.
Resilient channel effects
The positioning of resilient metal channels is an important issue for fire resistance ratings and for sound insulation. Measurements on the reference floor with resilient metal
channels spaced uniformly at different separations showed a dependence of STC and IIC on channel separation or, the total length of channels in the floor1; as the spacing
between channels decreased, so did the sound insulation. TL and ISPL results for the cases with uniformly spaced channels are shown in Figure 39 and Figure 40. The STC
EFFECT OF STRUCTURAL AND MATERIAL CHANGES—Resilient channel effects
ranges from 47 to 52 and the IIC from 40 to 46 with the greatest changes occurring around 125 Hz. OSB15_WJ235(406)_GFB152_RC13(nnn)_G16 10 20 30 40 50 60 70 80 63 125 250 500 1k 2k 4 k Frequency, Hz TL, dB 200 mm oc STC 47 305 mm oc STC 49 406 mm oc STC 50 600 mm oc STC 52
Figure 39: Sound transmission loss for wood joist floors with four uniformly spaced resilient metal channel arrangements.
OSB15_WJ235(406)_GFB152_RC13(sss)_G16 20 30 40 50 60 70 80 90 63 125 250 500 1 k 2k 4k Frequency, Hz ISPL, dB RC13(200), IIC 40 RC13(305), IIC 42 RC13(406), IIC 42 RC13(610), IIC 46
Figure 40: Impact sound pressure levels for wood joist floors with four uniformly spaced resilient metal channel arrangements.
EFFECT OF STRUCTURAL AND MATERIAL CHANGES—Resilient channel effects
It was established during the fire resistance part of the project that to ensure good fire resistance, some means of attaching the butt? ends of the gypsum board more firmly was needed. So, starting with a uniform array of resilient metal channels spaced 406 mm o.c., additional pieces of channel were added to support the butt ends. The various layouts of channels to support single and double layers of gypsum board are shown in reference [1]. Here, it is enough to note that additional pieces of channels reduced sound insulation. The data points for these cases are for total channel lengths around 57 m. The trend for uniformly spaced channels is quite regular but when the additional channels are added, there is considerable scatter in the data.
15 20 25 30 35 30 40 50 60 70 80 90 RC Length, m T L , d B 80 Hz 100 Hz 125 Hz 160 Hz 610 mm o.c. 406 mm 305 mm o.c. 203 mm o.c. 100 80 Hz 125 160
Figure 41: TL versus the total length of resilient metal channels supporting the 15.9 mm gypsum board ceiling. The lines are best fits to the data.
Similar data for the ISPL are shown in Figure 42. The dependence on the length of the resilient metal channels is again greatest around 125 Hz.
?
The “butt end” of a sheet of gypsum board is the edge with the shorter length, usually 1.2 m, that is untapered.
EFFECT OF STRUCTURAL AND MATERIAL CHANGES—Resilient channel effects 50 55 60 65 70 75 80 30 40 50 60 70 80 90 100 RC length, m IS P L , d B 125 Hz 250 Hz 500 Hz 1 kHz
Figure 42: ISPL versus the total length of resilient metal channels supporting the 15.9 mm gypsum board ceiling.
Resilient metal channels versus other ceiling support methods.
The dependence of sound insulation on resilient metal channel spacing demonstrates that energy transmission through the ceiling support is an important limiting mechanism for floor sound insulation. Figure 43 and Figure 44 show data for different furring systems that might be used to support gypsum board. In addition to the simple systems that were attached directly to the joists, a more complicated system was built where the gypsum board was suspended from the joists using 12-gauge wire, and U-channels. The C-channels were 610 mm o.c with tops held 6 mm below bottom of the joists by the wire. U-channels were wired at right angles to the C-U-channels and spaced 610 mm o.c. The overall cavity depth was 298 mm. This floor is compared in the figures with floors having cavity depths of about 250 mm. Other comparisons show that the difference in cavity depth has a negligible effect in this case.
EFFECT OF STRUCTURAL AND MATERIAL CHANGES—Resilient channel effects OSB15_WJ235(406)_GFB152_X(yyy)_G16 1 0 2 0 3 0 4 0 5 0 6 0 7 0 8 0 6 3 125 250 500 1 k 2k 4k Frequency, Hz Transmission Loss, dB
Wire, C and U channels, STC 54 RC 610mm oc, STC 52 U channel 610mm oc, STC 43 wood furring 610mm oc, STC 42 direct contact, STC 34
Figure 43: TL for different methods of supporting a single sheet of 15.9 mm gypsum board. OSB15_WJ235(406)_GFB152_X(yyy)_G16 20 30 40 50 60 70 80 90 100 63 125 250 500 1k 2 k 4k Frequency, Hz ISPL, dB
Direct contact, IIC 30 RC13(610), IIC 46 UC22(610), IIC 36 WFUR19(610), IIC 35
wire_CC40(610)_UC25(610), IIC 49
Figure 44: ISPL for different methods of supporting a single sheet of 15.9 mm gypsum board.
These results suggest that ceiling suspension systems might be developed that would increase sound insulation. However, fire resistance and installation costs must also be considered for potential new systems. There may be greater benefits from simply adding a second sheet of gypsum board to the ceiling.
EFFECT OF STRUCTURAL AND MATERIAL CHANGES—Thickness and type of sound absorbing material
Thickness and type of sound absorbing material
The effects of different thicknesses and types of sound absorbing material were examined in a 235 mm deep wood joist floor, a 457 mm deep wood I-joist floor, and a 203 mm steel joist floor. In each case joists were 406 mm o.c. Apart from the different joist types, the construction elements were the same as used in the reference floor. The dependence of STC and IIC on percentage thickness is shown in Figure 45 and Figure 46.
These figures show that sound transmission class and impact insulation class increase fairly linearly with the amount of sound absorbing material in the cavity. In the 250 mm deep cavity there is an apparent maximum reached in the STC when the cavity is about 80% full. This is not the case, however, in the 470 mm deep cavity. The trends for IIC are less clear. The second point to note from these graphs is that the more dense rock fibre batts give small but definite improvements in sound insulation relative to the glass fibre batts.
Cellulose fibre was installed in two ways: as a layer wet-sprayed on to the underside of the floor and blown in from the top of the steel joist cavity. From the limited data available, it is not possible to say whether the wet-sprayed cellulose fibre gives sound insulation much different from the glass and rock fibre. Only two thicknesses were tested with the larger thickness being about 70 mm.
Tests in the steel joist floor with blown-in cellulose, glass fibre and rock fibre batts of the same thickness gave unsatisfactory data. The rock and cellulose fibre results were significantly better than the results for the glass fibre obtained at the same time. However, the construction with glass fibre was built and tested three times at different times in the project. Two of the results were not significantly different from the results for the rock and cellulose fibre, while one was. The reason for the difference is not known.
EFFECT OF STRUCTURAL AND MATERIAL CHANGES—Thickness and type of sound absorbing material
48 50 52 54 56 58 60 0% 20% 40% 60% 80% 100% Percent full STC GFB 250 mm RFB 250 mm CFS 250 mm GFB 470 mm RFB 470 mm GFB 215mm RFB 215 mm CFL 215 mm
Figure 45: Dependence of STC on thickness of layer of sound absorbing material in a 235 mm wood joist floor (filled and unfilled circles), a 457 mm deep wood I-joist floor (filled and unfilled squares), and a 205 mm deep steel joist floor (filled and unfilled triangles). GFB = glass fibre batts, RFB = rock fibre batts, CFS = sprayed on cellulose fibre, CFL = blown-in cellulose fibre. The dimensions following these codes give the cavity depth.
41 43 45 47 49 51 53 0% 20% 40% 60% 80% 100% Percent Full IIC GFB 250 mm RFB 250 mm CFS 250 mm GFB 470 mm RFB 470 mm GFB 215mm RFB 215 mm CFL 215 mm
Figure 46: Dependence of IIC on thickness of layer of sound absorbing material in a 235 mm wood joist floor (filled and unfilled circles), a 457 mm deep wood I-joist floor (filled and unfilled squares), and a 205 mm deep steel joist floor(filled and unfilled triangles). GFB = glass fibre batts, RFB = rock fibre batts, CFS = sprayed on cellulose fibre, CFL = blown-in cellulose fibre. The dimensions following these codes give the cavity depth.
EFFECT OF STRUCTURAL AND MATERIAL CHANGES—Thickness and type of sound absorbing material
Figure 47 and Figure 48 show improvements in sound insulation due to increasing thickness of glass fibre in the 470 mm deep wood I-joist floor. The improvements are relative to the 90 mm thickness in each case. There is no very clear trend except for the frequencies around 250 Hz for the TL plot. Similar plots for the 250 mm deep solid wood joist case show even less pattern.
-1 0 1 2 3 4 5 6 7 8 6 3 125 250 500 1k 2k 4k Frequency, Hz Increase in TL, dB 152 mm 180 mm 292 mm 354 mm 456 mm
Figure 47: Increase in TL due to different thicknesses of glass fibre in a 470 mm deep wood I-joist floor. The increases are relative to the 90 mm thickness.
-1 0 1 2 3 4 5 6 7 6 3 125 250 500 1k 2k 4k Reduction in ISPL, dB 152 mm 180 mm 292 mm 354 mm 456 mm
EFFECT OF STRUCTURAL AND MATERIAL CHANGES—Effect of joist depth
In one of the tests in the wood joist floor, the 250 mm deep cavity was overfilled with three 90 mm thick glass fibre batts (100% full results). Comparison of the results for this construction with the case where the same floor was 87% full, shows that the additional thickness and the compression of the glass fibre does not significantly change the sound transmission loss nor the impact sound levels from the ISO tapping machine.
The apparent anomalies in these results are due to the combined effects of the pounding during impact testing, minor variations in construction and materials, and the inherent uncertainty in measurement. To obtain more reliable information on the effect of different sound absorbing materials on transmission loss requires a test series designed to extract that information only. The project was not designed for such detailed investigations.
Effect of joist depth
Solid Wood Joists
Increasing the depth of the joists and so the floor cavity should, according to simple theory, increase the transmission loss. In Figure 49 transmission losses for three solid wood joist depths are shown. The elements of the floor were the same as for the reference floor except for the changing joist depth. The corresponding plots for impact sound pressure level are in Figure 50. Improvements in sound insulation are primarily confined to the frequency range from 80 to160 Hz in both figures. This suggests that transmission by some other path, probably through the resilient metal channels, is more important than transmission through the air and sound absorbing material in the cavity.