Get rights and content
Learning and Instruction
Volume 27, October 2013, Pages 40-49
Learning with summaries: Effects of representation mode
and type of learning activity on comprehension and
transfer
Claudia Leopold , Elke Sumfleth, Detlev Leutner
Instructional Psychology Department, Faculty of Educational Sciences, Duisburg-Essen University, Schuetzenbahn 70, D-45127 Essen, Germany
Received 12 June 2012, Revised 12 February 2013, Accepted 24 February 2013, Available online 9 April 2013.
Show less
https://doi.org/10.1016/j.learninstruc.2013.02.003
Abstract
The purpose of the experiment was to examine whether students better understand a science text when they are asked to self-generate summaries or to study predefined summaries. Furthermore, we tested the effects of verbal and pictorial summaries. The experiment followed a 2 × 2 design with representation mode (verbal vs. pictorial) and learning activity (self-generating vs. studying) as experimental factors. The main dependent variables were learning performance, measured by a comprehension and a transfer test, and strategy use, measured by self-report scales. Seventy-one students (Grade 10) participated in the study. The results showed that studying predefined summaries in a pictorial representation mode facilitated deep understanding.
Furthermore, mediation analysis showed that the effect of representational mode was mediated by students' spatial representations of learning content. The effect of spatial
Previous Next representations was in turn facilitated by mental imagery activities.
Highlights
► Pictorial summaries facilitated comprehension and transfer performance compared to verbal summaries. ► Predefined summaries facilitated transfer performance compared to learner-generated summaries. ► The quality of students' spatial representations mediated the effect of the representation mode on transfer performance. ► Mental imagery partly mediated the effect of representation mode on the quality of students' visual-spatial representations.
Keywords
Summarization
;Multimedia learning
;Pictorial summary
;Verbal summary
;Drawing
1. Introduction
Learning with summaries is of high practical relevance in school contexts and is an important component of complex reading strategy training programs (e.g., Spörer, Brunstein, & Kieschke, 2009). The effects of summary strategies have been investigated in learning with single and multiple texts (Bråten & Strømsø, 2010; Gil, Bråten, Vidal-Abarca, & Strømsø, 2010a; Mateos, Martin, Villalón, & Luna, 2008). Students are commonly asked either to self-construct summaries or to study already constructed (expert) summaries (León, 1997; Wade-Stein & Kintsch, 2004; Westby, Culatta, Lawrence, & Hall-Kenyon, 2010). Apart from the relevance of summaries, Anderson and
Armbruster (2000) pointed out that the summarization strategy itself has not been systematically investigated. Therefore, the main purpose of this study was to more closely investigate the effects and conditions under which learning with summaries is beneficial. We concentrated on two questions. First, does the representation mode of summaries—that is, whether they are verbal or pictorial in nature—affect learning performance in terms of comprehension and transfer performance? Second, does the specific type of learning activity affect performance? That is, is it helpful to foster active processing of text content by asking students to summarize text paragraphs by
themselves or, on the other hand, is it sufficient simply to provide the learner with predefined summaries? Furthermore, our purpose was to investigate the students' strategic processing while learning with summaries and to investigate interrelations between their strategic processing and learning performance.
When students read a passage of an expository text, it is assumed that they mentally form a gist or higher level representation of what they have read (Brown, Day, & Jones, 1983; Kintsch, 1998; Kintsch & van Dijk, 1978). This mental gist represents the main points of the text in an abstract or condensed form. When students are asked to write a summary about the text, they must draw on this gist and develop a text-specific
organization in order to transform their mental gist into written text (Flower & Hayes, 1980; Taylor & Beach, 1984). At the same time, readers must be sensitive to the
organization of the text with regard to superordinate and subordinate ideas. Researchers suggest that summarization activities help a learner to focus on the
important ideas in a text and to integrate these ideas by building relations between them (Hidi & Anderson, 1986; Schmalhofer & Glavanov, 1986; Westby et al., 2010; Wittrock & Alesandrini, 1990). Furthermore, the process of summarization encourages learners to reconstruct the meaning of a text in a more concise and generalized form (Wade-Stein & Kintsch, 2004). From a learning-strategy perspective, summary writing is seen as an activity that fosters the organization and integration of text-based ideas (Mayer, 1996;
Pressley & Harris, 2006; Weinstein & Mayer, 1986). These processes, in turn, help the learner to construct a structure for organizing the text that facilitates recall and comprehension.
1.1. Do representation mode and type of learning activity affect learning
performance?
1.1.1. Representation mode
Although research on learning with summaries has primarily focused on verbal
summaries, by definition, a summary does not have to be verbal (in nature) but can also have a pictorial format (e.g., Mayer, Bove, Bryman, Mars, & Tapangco, 1996). Mayer et al. (1996), for example, constructed a pictorial summary that contained a sequence of simple illustrations depicting the main steps in the process of lightning. This type of summary presents the main ideas of the text and their relations as does a verbal
summary, but in a different format. One advantage of the pictorial format compared to the verbal format is that it makes spatial relations among components explicit and thereby helps the learner to identify these relations (Larkin & Simon, 1987). This is particularly important when texts describe complex spatial relations between objects and elements, as is typical of science texts; for example, the structure of molecules and their chemical bonds (Leopold & Leutner, 2012) or the mechanisms of a car's braking system (Mayer & Gallini, 1990). Also, these texts often remain challenging for students (Best, Rowe, Ozuru, & McNamara, 2005). Verbal summaries, by contrast, maintain the sequential structure of a text. Therefore, it is more difficult to recognize the spatial and structural relations of the particular components and objects that are described by the text.
We expect these representational differences (of verbal and pictorial summaries) to affect a learner's internal representation of the text. A student who studies a text and is asked to create a pictorial summary is more likely to focus on the structural and spatial relations of the referential objects than a student who is asked to create a verbal
summary. Therefore, the student is more likely to construct an internal representation of the referential objects—a mental model of the text content. One main characteristic of mental models is that they possess inherent structural features that are associated with the objects they represent by structural or functional analogy (Johnson-Laird, 1983). These features allow us to manipulate the models and read off relational information. Therefore, mental models provide a basis for drawing inferences and are crucial for developing a deeper understanding of text content. However, when the student creates a verbal summary, he or she is more likely to focus on the structure of the text and on text-based processing (Kintsch, 1998). When writing a summary, the student can keep the same sequential organization as that employed in the original text (Mateos et al., 2008). Consequently, his or her attention is more directed toward representing the information stated in the text than on constructing a mental model of the referential objects and their relations (Leopold & Leutner, 2012; McNamara, Ozuru, Best, & O'Reilly, 2007). In view of the potential of mental models to promote deeper understanding, we expect learners who learn with pictorial summaries to better understand a text that describes spatial relations than learners who learn with verbal summaries. We expect this advantage of pictorial over verbal summaries to be independent of whether these summaries are self-constructed by the learner or are provided to them. The reason is that the representational differences of verbal and pictorial summaries apply to both self-constructed and predefined summaries.
Empirical support for these hypotheses comprises two lines of research. First, strategies that are focused on text-based processing have been compared to strategies that are focused on model-based processing. Alesandrini (1981), for example, instructed students to study a science chapter about electrochemistry by either writing paraphrases (text-focused) or drawing pictures (model-(text-focused) for each paragraph in the chapter. In addition, students were told to be analytical, by focusing on details, or holistic, by focusing on inclusive concepts, or did not receive any specific instructions. The results of a test with factual, comprehension, and transfer questions showed an effect of mode of processing such that the drawing groups exceeded the verbal groups. The instructions to focus on details or inclusive concepts did not affect the results. Related results were found by Leopold and Leutner (2012). They compared a verbal summary strategy (Experiment 2) and a verbal main-idea-selection strategy (Experiment 1) with a strategy in which students were asked to construct drawings. On comprehension and transfer tests, the drawing groups showed better results than the summary groups and the main idea groups did. These results support the importance of constructing pictorial
Second, there is a large body of research indicating that presenting information by words and pictures, rather than by words alone, facilitates learning and understanding (Mayer, 2009; Schnotz & Bannert, 2003). The so-called multimedia effect, for example, provides evidence that supports this view (see Mayer, 2009, for a review). The benefit of adding pictorial adjuncts to text is based on the fact that pictures and words provide two qualitatively different systems for representing knowledge that complement each other (Paivio, 1986; Schnotz & Bannert, 2003). If we apply these ideas to text learning by summarization, a pictorial rather than a verbal summary introduces a complementary representation to the instructional text and should therefore facilitate learning and understanding.
Both approaches support the advantage of pictorial representations. The only difference is that in the first line of studies, students were asked to self-construct these
representations, whereas they were presented with predefined pictures in the second line of studies. In view of these results, the question arises as to whether self-constructed or predefined summaries facilitate understanding more effectively.
1.1.2. Learning activity
Learning-strategy approaches and theories of self-regulated learning (Pintrich, 2000;
Zimmerman, 2001) emphasize the importance of the learner actively processing the learning materials. The active-processing assumption is based on the idea that deep and meaningful learning requires learners to select important ideas, organize them into a coherent structure, and integrate them with relevant prior knowledge, thereby affecting the encoding process (Kiewra, 1989; Mayer, 1996; Weinstein & Mayer, 1986). These processes are rooted in the generative learning model proposed by Wittrock (1990) and are essential for the generation effect (Foos, Mora, & Tkacz, 1994). When learners are asked to construct summaries, they (in fact) are required to actively process the text, that is, to select important concepts and to organize their relations (Wittrock & Alesandrini, 1990). When learners are asked to construct a pictorial summary, they are moreover required to transform textual information into pictorial information, that is, to create referential connections between components of the text and components of the picture to be drawn (Van Meter & Garner, 2005). Conversely, when learners are presented with predefined summaries, this is not necessarily the case. Although predefined summaries contain information that is already selected and organized, learners do not necessarily have to actively process and mentally reconstruct this information. Learners do not have to create referential connections between components of the text and components of the picture when studying a text with pictures. Thus, when students are asked to
self-generate summaries, they are challenged to engage in more active processing than when they are presented with predefined summaries.
However, one should also consider the quality of these processes. Although we expect students to be more active when they construct summaries by themselves, they may
invest extra time and effort in extraneous cognitive processing. For example, when students are asked to construct a pictorial summary, they can choose from a variety of possibilities for how to transform words and meanings into their respective pictorial counterparts. Some of these possibilities may not be useful at all (please see Stull & Mayer, 2007, for a review). In line with this idea, the task of generating summaries has produced inconsistent effects that vary from positive effects (Bråten & Strømsø, 2010;
Taylor & Beach, 1984; Wittrock & Alesandrini, 1990) to negative effects (Howe & Singer, 1975; Leopold & Leutner, 2012; Wiley & Voss, 1999) or show no differences (Anderson & Thiede, 2008; Head, Readence, & Buss, 1989) in comparison to control conditions. By contrast, when students learn with predefined pictures, the provided pictures constrain the variety of ways in which referential connections can be constructed and should therefore facilitate understanding. Generally, when students learn with
predefined summaries, these summaries provide a scaffold for students' cognitive processing. Consequently, the processes of selecting and organizing information as well as creating referential connections can be performed in a more focused way (Renkl & Atkinson, 2007). Predefined summaries therefore may help the learner to guide her or his attention toward relevant text information. However, to benefit from predefined pictorial or verbal summaries, students actually have to process these summaries by relating text information to the information presented in these summaries—and this type of active processing is not mandatory when students are presented with the
predefined summaries. There are only a few studies that have compared predefined with self-constructed pictures, and in line with the theoretical considerations, these studies have provided no clear empirical support of whether students learn better with learner-constructed or predefined pictures (see Hall, Bailey, & Tillman, 1997; Schwamborn, Thillmann, Leopold, Sumfleth, & Leutner, 2010; Van Meter, 2001). To our knowledge, there are no studies that have directly compared predefined and self-constructed verbal summaries. Based on these considerations, two predictions can be derived. On the basis of the active-processing assumption, we predicted that students who read a scientific text and generated summaries by themselves would engage in more active processing and therefore would perform better on comprehension and transfer tests than students who read the same text along with predefined summaries. Conversely, based on the idea that predefined summaries provide a scaffold for learners' cognitive processing, students who learned with predefined summaries were expected to outperform students who generated their own summaries.
1.2. Do representation mode and learning activity affect students' strategic
processing?
When students learn from summaries, researchers expect that differences in
comprehension will be evoked by differences in their cognitive processing (Brown et al., 1983; Garner, 1985). With regard to the difference in representation mode, we expected that pictorial summaries (more than verbal summaries) would evoke the students'
mental imagery processes. The reason is that pictorial summaries, in contrast to verbal summaries, make spatial relations explicit and thereby help learners to focus on the spatial relations of the referential objects (see section 1.1). We expected that this focus of the learners' attention would go hand in hand with mental imagery processes that in turn help the learner to construct an internal representation of the respective spatial components and relations. Various findings from imagery research indicate that mental images and visual percepts are closely connected as both rely on depictive
representations (Borst & Kosslyn, 2012; Finke & Pinker, 1982). Therefore, mental images can make spatial relations explicit as external pictures do (Larkin & Simon, 1987).
With regard to the difference in learning activity (predefined vs. self-generated summaries), we expected that students who self-generated summaries would engage more in conceptual organizing activities than students who learned with predefined summaries. The reason for this is that students who self-generate a summary compared to those who learn with predefined summaries have to put effort into constructing the summary. This involves the implementation of a lot of strategic activities, for example, deciding which concepts are the most important ones and how they relate to each other (Brown et al., 1983; Hidi & Anderson, 1986; Wade-Stein & Kintsch, 2004).
1.3. Relations between strategic processing and comprehension
In line with the idea that pictorial summaries, in contrast to verbal summaries, make spatial and structural relations explicit, we expected the differences in representation mode (of verbal and pictorial summaries) to affect a learner's internal spatial
representation of the text (Hegarty, 2004; Leopold & Leutner, 2012). This internal
representation—the mental model—of the objects should in turn affect comprehension and transfer performance (Johnson-Laird, 1983).
1.4. Learner characteristics as control variables
When students construct a summary, they generally draw on their prior knowledge in order to organize and integrate text information. Prior knowledge has been found to be an important factor in text comprehension and summary tasks (Gil et al., 2010a, Gil, Bråten, Vidal-Abarca, & Strømsø, 2010b; Kintsch, 1998; McNamara, Kintsch, Songer, & Kintsch, 1996) and in multimedia learning (Kalyuga, Ayres, Chandler, & Sweller, 2003). Furthermore, empirical findings have shown that text comprehension is related to students' verbal abilities (Heller & Perleth, 2000) and that the benefits of adding pictures to instructional text vary with regard to the learners' spatial abilities (Höffler, 2010). Therefore, prior knowledge, verbal ability, and spatial ability were used as control variables in the current study.
1.5. Overview of hypotheses
comprehension transfer and visualization performance than the students in the verbal summary groups (Hypothesis 1). With regard to the effects of learning activity, two predictions could be derived based on theoretical considerations. On the basis of the active-processing assumption, we predicted that students who generated their own summaries would engage in more active processing and therefore perform better on the comprehension and transfer tests than students who read the same text along with predefined summaries (Hypothesis 2.1). Conversely, on the basis of the assumption that predefined summaries provide a scaffold for learners' cognitive processing and
consequently guide the learners' attention more strongly, we predicted that students who learned with predefined summaries would outperform students who generated their own summaries (Hypothesis 2.2).
Furthermore, we predicted that students who learned with pictorial summaries would engage in more mental imagery processes than students who learned with verbal summaries (Hypothesis 3). We also predicted that students who self-generated
summaries would engage in more conceptual organization activities than students who learned with predefined summaries (Hypothesis 4).
Finally, we expected that the effect of representation mode on comprehension would be mediated by the quality of students' spatial representations of the learning content (Hypothesis 5) and that the effect of representation mode on the students' mental representations would be mediated by mental imagery activities (Hypothesis 6).
2. Method
2.1. Participants and design
Seventy-one students in Grade 10 of a senior high school participated in the experiment. Their mean age was 15.90 years (SD = .74), and the percentage of female students was 54.9%. A teacher introduced the experimenters who explained the experimental procedure to the students. The participants were informed that they would receive individual feedback on their results if they wished.
The experiment was based on a 2 × 2 factorial between-subjects design, with representation mode (verbal vs. pictorial summaries) and learning activity
(self-generating summaries vs. studying predefined summaries) as the experimental factors. Students were randomly assigned to the four experimental groups. Nineteen students served in the verbal self-generated-summary group, 19 students served in the pictorial self-generated-summary group, 16 students served in the verbal predefined-summary group, and 17 students in the pictorial predefined-summary group.
2.2. Materials
bonds, (b) a multiple-select comprehension test for assessing prior knowledge on to-be-learned content, (c) a multiple-select comprehension tests for assessing text
comprehension after studying the science test, (d) a transfer test with open questions for measuring deep understanding and problem solving transfer, (e) a visualization test for assessing students' spatial representations of text content, (f ) a self-report strategy questionnaire for checking strategy use during text processing, and (g) standardized tests for measuring verbal ability and spatial ability as control variables.
The science text about water molecules (1577 words) consisted of six central topics that comprise (a) the chemical structure of water molecules, (b) the dipole-character of water molecules, (c) hydrogen bonds, (d) the hydration process, (e) the surface tension, and (f ) the density anomaly of water (see Leutner, Leopold, & Sumfleth, 2009). We computed the readability index as an indication of text difficulty using the Flesch-Formula (Flesch, 1948). This formula is based on word length and sentence length and was adapted to the German language by Amstad (1978). The readability score of our text of 54 indicated medium readability, which corresponds to the readability of newspaper articles, which usually range between 46 and 60 (for an overview of readability scores see http://www.it-agile.de/stil/fleschwert.html).
For the predefined-summary versions of the materials, short verbal or pictorial summaries were constructed for each of 12 paragraphs and posited beside them (e.g.,
Mayer et al., 1996). Thereby, it was assured that pictorial and verbal summaries
contained equivalent informational input. Themes described in the verbal summaries were also depicted in the pictorial summaries and vice versa. The
self-generated-summary versions of the materials contained rectangular frames for each paragraph that provided spaces for self-generated text or self-generated pictures. Each frame was
headed with the corresponding number of the paragraph in order to be able to assign the student-generated summaries to the corresponding paragraph.
A criterion-referenced multiple-select test was used to assess the students' comprehension of science text contents covering all six topics of the text (20 items with four alternatives, Cronbach's alpha = .76). A similar version was used by Leopold and Leutner (2012). Item examples are “What is the reason for the formation of hydrogen bonds? (a) the polar nature of water molecules, (b) the mutual attraction of the electrons, (c) attraction forces between ions, or (d) the polar electron pair bond,” and “Why is the bottom temperature of deep waters a reasonable 4 °C, even in winter time? (a) because the distance between water molecules is largest at 4 °C, (b) because molecules move fastest at 4 °C, (c) because water has its maximum density at 4 °C, or (d) because water molecules bond to ions, preventing further cooling.” In the first example a and d are the correct answers, in the second example c. These questions required students to link information from separate sentences. Therefore, answers could not be directly retrieved from the text but had to be inferred. In order to assess prior knowledge of the text contents, 10 multiple-select questions (with four alternatives) were used in a pretest that covered the six topics of the
science text (Cronbach's alpha = .63). We used different items in order to assess prior knowledge before reading and comprehension after reading. A transfer-test with five open questions was constructed to assess deep understanding and integration of the learning contents following the scheme of Mayer (2009). On the transfer test, learners were required to solve and explain problems that had not been explicitly given in the text— that is, they had to apply what they had learned to a new situation. An example is the question: “Seawater in polar areas could be colder than 0 °C without freezing. How would you explain this fact?” To help score the answers, a checklist was constructed with three key ideas or statements for each question. Thus, each answer to a question was awarded a maximum of 3 points. Students' answers were scored by two raters with an acceptable interrater agreement of kappa = .92. Disagreements were settled by
consensus. The internal reliability of the scored answers was high (Cronbach's alpha = .79).
The questions on the comprehension and transfer tests were related to the mental model level as both types of questions referred to how the students understood the structure of water molecules. However, the comprehension questions referred to problems already mentioned in the text, whereas the transfer questions referred to new problems.
A visualization test was constructed to assess whether students constructed referential connections and generated visual-spatial representations of to-be-learned contents. On the visualization test, students were asked to draw sketches depicting key concepts of the text and their spatial relations (e.g., hydrogen bonds of water molecules, the hydration process, etc.). Students were handed a sheet of paper with nine key concepts and extra space provided for sketching each concept. Students' sketches were analyzed with respect to nine expert reference-visualizations (see Leopold & Leutner, 2012; Van Meter, 2001). Expert visualizations were independently constructed by a science teacher and the first author of this paper. Differences were discussed and resolved by consensus. In addition to the reference visualizations, a checklist was developed specifying the features that had to be depicted in order to score the particular student's sketch as accurate (2 points), partly accurate (1 point), or not acceptable (0 points). These characteristics referred to whether relevant components (objects or structures) were depicted and to what extent these components were accurately spatially related to each other. Students' sketches were scored by two raters with reliable interrater agreement of kappa = .95 and Cronbach's alpha = .75.
With regard to the strategy-application questionnaire, two self-report strategy scales were designed for measuring strategy application during the study phase; that is, pictorial organization (mental imagery) and conceptual organization of learning contents. With regard to pictorial organization, students were asked to rate the extent to which they mentally imagined the text content by five items on a 4-point scale ranging from 1 (completely agree) to 4 (completely disagree; Cronbach's alpha = .91). An example item is “I
mentally imagined the content described by the text.” With regard to conceptual organization, students were asked to assess on a 4-point scale the extent to which they mentally structured and organized important concepts of the text (e.g., “I thought about how important concepts are related to each other”; five items, Cronbach's alpha = .74). Verbal ability was measured as a control variable using a standard intelligence test (scale “word fluency”; Heller & Perleth, 2000). Furthermore, spatial ability was measured using the paper-folding test (Ekstrom, French, Harman, & Dermen, 1976) because effectiveness of mental imagery has been found to vary with respect to students' spatial abilities
(Denis, 2008).
2.2.1. Pilot testing of summaries
To ensure the quality of the predefined pictorial and verbal summaries, materials were pilot tested on university students. We assumed that summary quality would be
indicated if students who lacked prior knowledge in chemistry were able to match the pictorial and verbal summaries (without reading the text before). A total of 184 first-year undergraduate students (144 female and 40 male students) from Duisburg-Essen-University participated in the study. First, students assessed their prior knowledge of text topics (chemical bonds of water molecules) on a 7-point scale ranging from 1 (very low) to 7 (very high). The mean of 2.46 (SD = 1.31) indicated that students lacked sufficient knowledge of the text topics. Second, students were given two sheets of paper with 12 verbal summaries on one paper and 12 pictorial summaries on the other paper. They were instructed to view the pictorial and read the verbal summaries. Afterward, they were asked to indicate which pictorial and which verbal summary went together by writing down the corresponding numbers of the verbal and pictorial summaries. Students were given 10 min to accomplish this task. Across the 12 tasks, a mean difficulty score of .86 (SD = .09) was obtained, indicating a high percentage of correct matches. The individual scores ranged from .73 to .99. On the basis of these scores, summary matches with lower scores (x < .80) were identified and revised. The revision included verbal and pictorial summaries. Verbal summaries were revised with respect to their clarity, distinctness, and comprehensibility. These qualities mainly refer to
whether the verbal summaries explicitly signified relevant components and their conceptual relations. Pictorial summaries were revised with respect to the pictorial design principles developed by Levin and Mayer (1993). These principles include clarity, precision, and the depiction of relevant components and their spatial relations. The informational equivalence between the verbal and pictorial summaries was preserved.
2.3. Procedure
Students were randomly assigned to the treatment groups. First, students were asked to fill out the pretest for assessing their prior knowledge on the to-be-learned content (5 min). Second, students received a booklet with an instruction sheet and the science
text that was prepared according to the experimental treatment condition. The experimenter guided the students through the instruction sheet, which showed an example of a summary prepared according to the experimental conditions. The experimenter encouraged the students to ask questions whenever there was anything they did not understand. Students could go back and look at the summary example whenever they wished. Students in the verbal-summary groups were instructed to comprehend the text by either reading a text paragraph and reading the predefined verbal summary beside the text paragraph or by reading a paragraph and writing a short verbal summary by themselves—and afterward moving on to the next paragraph. They were informed that their summaries should be clear and simple in order to help them to understand the text. Students in the pictorial-summary groups were instructed to
comprehend the text by either reading a text paragraph and viewing the predefined pictorial summary beside the paragraph or by reading a text paragraph and drawing a pictorial summary by themselves—and afterward moving on to the next paragraph. They were informed that their summaries should be clear and simple in order to help them understand the text. An example for each treatment condition was provided on the instructions sheet. All students were aware that they would be tested on their
understanding. They were given 35 min to study the science text on water molecules, and thereafter the booklets were collected. Subsequently, students answered the self-report strategy application questionnaire with respect to their strategic processing during the study phase (ca. 5 min). Afterward, they filled out the verbal (7 min) and spatial (3 min) ability tests. Then, students were given 10 min to answer the multiple-select comprehension posttest, 15 min to take the transfer test, and finally 10 min to take the visualization test.
3. Results
3.1. Equivalence of experimental treatment groups
Before testing the hypotheses, we examined whether the four treatment groups differed in their verbal ability, spatial ability, and prior knowledge scores. No between-group differences were found for verbal ability, spatial ability, and prior knowledge, all Fs(3, 67) < 1 (see Table 1 for means and standard deviations). Therefore, we assumed that the experimental groups did not differ on relevant learner variables that could have
interfered with the following analyses.
Table 1. Means (standard deviations) of control variables for each of the experimental groups.
Verbal ability 15.79 (3.71) 15.38 (5.34) 15.00 (2.73) 16.29 (3.37)
Spatial ability 4.11 (3.78) 3.19 (5.33) 3.42 (3.27) 3.82 (2.83)
Prior knowledge 25.68 (4.49) 26.81 (3.67) 26.63 (4.11) 26.82 (4.38)
Note. The maximum scores are 25 for verbal ability, 10 for spatial ability, and 40 for prior knowledge.
3.2. Effects on learning performance
With regard to representation mode, we expected that students who learned with pictorial summaries would outperform students who learned with verbal summaries. With regard to learning activity, that is, learning with provided versus self-generated summaries, no specific predictions were made. To examine treatment effects on comprehension, transfer, and visualization measures, we computed 2 × 2 factorial ANOVAs. For the sake of clarity, we first report the results for representation mode and then for learning activity.
3.2.1. Do students learn better with verbal summaries or pictorial summaries?
The analysis of the comprehension test scores revealed a significant main effect of representation mode, F(1, 67) = 6.82, p = .011, MSE = 46.64, η = .09, d = .63, with significantly higher scores in the pictorial summary condition (M = 59.06, SD = 6.92) than in the verbal summary condition (M = 54.74, SD = 6.74). The analysis of the transfer test scores revealed—similar to the comprehension test scores—a significant effect of representation mode, F(1, 67) = 11.71, p = .001, MSE = 9.33, η = .15, d = .79, with
significantly higher scores in the pictorial summary condition (M = 5.67, SD = 3.27) than in the verbal summary condition (M = 3.20, SD = 3.01). Likewise, the effect of
representation mode was significant for the visualization test, F(1, 67) = 38.40, p < .001, MSE = 9.03, η = .36, d = 1.33, with significantly higher scores in the pictorial summary condition (M = 9.25, SD = 3.61) than in the verbal summary condition (M = 4.89,
SD = 2.97).
3.2.2. Do students learn better with self-generated summaries or predefined
summaries?
The analysis of the comprehension test scores revealed no significant main effect of learning activity, F(1, 67) = 1.97, p = .165. The predefined summary group (M = 58.18, SD = 8.35) did not significantly differ from the student-generated summary group (M = 55.84, SD = 5.75). However, for the transfer test, the main effect of learning activity was significant, F(1, 67) = 5.20, p = .026, MSE = 9.33, η = .07, d = .52, with significantly
Verbal summary Pictorial summary
Self-constructed Predefined Self-constructed Predefined
P2
P2
P2
higher scores in the predefined summary condition (M = 5.36, SD = 3.85) than in the student-generated summary condition (M = 3.66, SD = 2.67). For the visualization test, the effect of learning activity was also significant, F(1, 67) = 12.23, p = .001, MSE = 9.03,
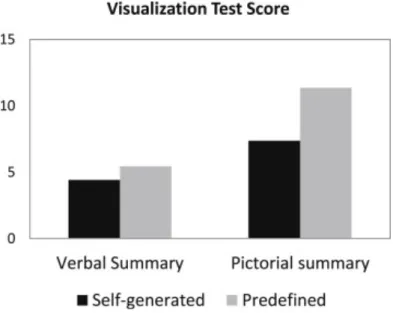
η = .15, d = .69, with significantly higher scores in the predefined summary condition
(M = 8.48, SD = 4.55) than in the student-generated summary condition (M = 5.89, SD = 2.91). Furthermore, the analysis of the visualization test revealed a significant ordinal interaction of representation mode and learning activity, F(1, 67) = 4.31, p = .042, MSE = 9.03, η = .06, d = .99 (see Fig. 1). The pictorial predefined-summary group scored much higher than the pictorial self-generated-summary group, whereas the difference between the two verbal summary groups was less pronounced (means and standard deviations are presented in Table 2). For the comprehension test and transfer tests, the interaction of representation mode and learning activity was not significant, all Fs(1, 67) < 1 (means and standard deviations are presented in Table 2).
Download : Download full-size image
Fig. 1. Interaction of representation mode and learning activity for the visualization test scores.
Table 2. Means (standard deviations) of dependent variables for each of the experimental groups.
P2
P2
Verbal summary Pictorial summary
Comprehension test 53.47 (5.46) 56.25 (7.91) 58.21 (5.14) 60.00 (8.57)
Transfer test 2.74 (1.94) 3.75 (3.92) 4.58 (3.02) 6.88 (3.18)
Visualization test 4.42 (2.83) 5.44 (3.12) 7.37 (2.19) 11.35 (3.77)
Self-reported mental imagery 2.25 (0.91) 2.53 (1.06) 2.88 (0.91) 3.28 (0.72)
Self-reported conceptual organization 2.77 (0.56) 2.72 (0.69) 2.87 (0.56) 3.02 (0.56)
Note. The maximum scores are 80 for comprehension performance, 15 for transfer performance, 18 for visualization performance, and 4 for self-reported mental imagery and conceptual organization.
In sum, in line with our predictions, the pictorial summary groups scored significantly higher than the verbal summary groups on all performance measures. Transfer and visualization test performance were facilitated by the provided rather than by self-generated summaries.
3.3. Effects on self-reported learning strategy use
We hypothesized that the experimental treatments would differentially affect students' learning strategy use—that is, mental imagery and conceptual organization of text content. Concerning representation mode, we expected that the pictorial summary groups would report more mental imagery than the verbal summary groups. Concerning learning activity, we expected that the self-generated-summary groups would report more conceptual organization than the predefined-summary groups. The ANOVA on self-reported mental imagery revealed a significant main effect of representation mode, F(1, 65) = 9.91, p = .002, MSE = .82, η = .13, d = .76, with
significantly higher scores in the pictorial summary condition (M = 3.07, SD = .84) than in the verbal summary condition (M = 2.38, SD = .97). The main effect of learning activity and the interaction of representation mode and learning activity were not significant. The ANOVA on self-reported conceptual organization strategy use revealed no
significant effect of learning activity, F(1, 65) < 1. The effect of representation mode and the interaction of Representation Mode x Learning Activity were also not significant.
3.4. Mediation analyses
Whereas the results of an ANOVA can indicate that an independent factor affects a dependent variable, mediational analysis offers an explanation for how and why a given effect occurs (Baron & Kenny, 1986; MacKinnon, 2008). More precisely, mediation analysis specifies whether the effect of the independent variable on the dependent
Verbal summary Pictorial summary
Self-constructed Predefined Self-constructed Predefined
variable is caused by one or more intervening so-called mediator variables.
First, we tested a simple mediation model that included a single mediating variable. Second, we tested a more complex model with two mediating variables. Both models were tested using path analysis with manifest variables with Mplus Version 6.1.
3.4.1. Simple mediation model
In view of the theoretical framework, we expected that the positive effect of representation mode on transfer test performance was caused by the pictorial representations (sketches and pictures) fostering students' internal spatial
representations of the learning content (assessed by the visualization test); that is, we hypothesized that students' spatial representations had mediated the positive effects of the pictorial representation mode on transfer test performance (Leopold & Leutner, 2012). This mediation hypothesis was based on the fact that the pictorial representation format rather than the verbal format makes spatial relations between objects and
elements explicit (Larkin & Simon, 1987) and thereby helps the learner to construct an internal representation of the spatial relations between the respective objects.
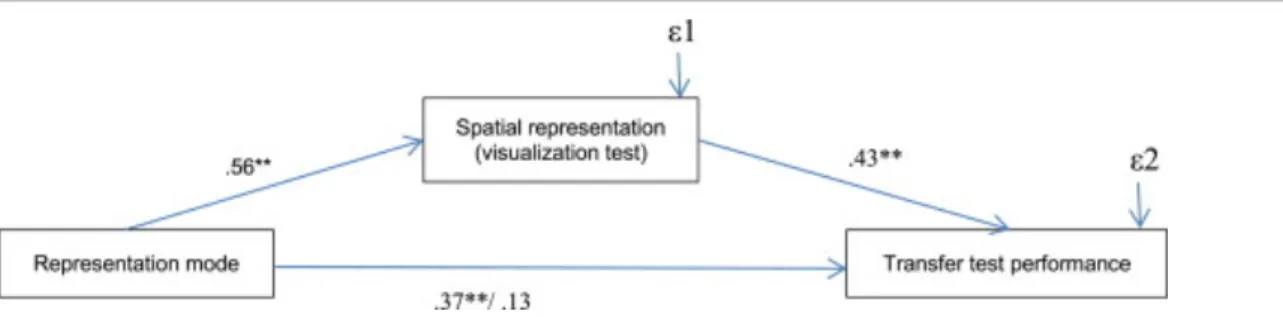
Following the procedure proposed by Baron and Kenny (1986), we first computed the effect of the treatment (factor: representation mode) on transfer performance when the mediating variable was not included in the model. The analysis revealed that the direct path from representation mode to transfer performance was significant, β = .37, p < .001 (see Fig. 2). Second, we added an indirect path, mediated by students' spatial
representations in addition to the direct path in the model. With spatial representations as a mediating variable, the direct path was reduced to β = .13, p = .286, whereas the path coefficients between representation mode and spatial representation (β = .56, p < .001) and spatial representation and transfer performance (β = .43, p < .001) were significant; R (spatial representations) = .31, p = .001, R (transfer test performance) = .27, p = .003. The indirect effect, that is, the path from the independent variable representation mode via the mediating variable spatial representations to the dependent variable transfer performance, was significant, β = .56 × .43 = .24, p = .001. In sum, these findings indicate a full mediation of the effect of representation mode on transfer test performance via students' spatial representations. The fit indices of the unsaturated mediation model (without the direct path from representation mode to transfer test performance) indicated good model fit; CFI = 1.00, RMSEA = .04 (90% confidence interval = .00–.321),
Χ² = 1.13, df = 1, p = .289; R (spatial representations) = .31, p = .001, R (transfer test
performance) = .25, p = .005 (Byrne, 2012).
2 2
Download : Download full-size image
Fig. 2. Simple mediation model (representation mode: code 1 = verbal, code 2 = pictorial).
3.4.2. Complex mediation model
In addition to the model specified above, we hypothesized that the effect of representation mode on students' spatial representations was caused by students' strategic activities (i.e., by students forming mental images of the objects and elements described by the text). Hence, we expected that the effect of representation mode on spatial representations would be mediated by mental imagery processes. The more complex mediation model is depicted in Fig. 3. The correlation matrix of the dependent variables is presented in Table 3. First, we assessed the direct effect of representation mode on spatial representations when tested separately, β = .56, p < .001. We then assessed the direct and indirect effects of the specified model and computed the fit indices. The predicted direct effects were significant: from representation mode to mental imagery, β = .37, p < .001; from representation mode to spatial representation,
β = .47, p < .001; from mental imagery to spatial representation, β = .25, p = .012; from
spatial representation to transfer performance, β = .43, p < .001. We also tested two indirect effects. The indirect effect from representation mode via mental imagery to spatial representation, β = .09, p < .043, and the indirect effect from representation mode via spatial representation to transfer performance, β = .20, p = .003, were significant. The hypothesized model fit the data well, CFI = 1.00, RMSEA = .00 (90% confidence
interval = .00–.255), Χ² = .29, df = 1, p = .593; R (spatial representations) = .36, p < .001, R (transfer test performance) = .27, p = .003.
Download : Download full-size image
Fig. 3. Complex mediation model (representation mode: code 1 = verbal, code 2 = pictorial).
Table 3. Overall descriptives and correlations of dependent variables.
Mental imagery 2.73 (0.97) .91
Spatial
representations
7.10 (3.95) .42 .75
Transfer performance 4.45 (3.36) .28 .50 .79
Note. Italicized numbers on the diagonal show Cronbach's alpha reliabilities of the scales.
4. Discussion
The present study investigated whether the representation mode of summaries (i.e., learning with pictorial or verbal summaries) and the learning activity (i.e., learning with self-generated or predefined summaries) affect strategic activities and learning
performance (the comprehension of science text content). With regard to learning performance, pictorial-summary groups scored significantly higher than verbal-summary groups did on the multiple-select comprehension test, the transfer test, and the visualization test (Hypothesis 1). These results are in line with multimedia learning theories (Mayer, 2009; Schnotz & Bannert, 2003), drawing instruction (Van Meter, 2001),
Variable Mean (SD) Mental imagery Spatial representations Transfer performance
and model-based processing approaches (Leopold & Leutner, 2012), suggesting that pictorial representations introduce a representation that is complementary to the instructional text. Specifically, the pictorial representation provides structural and spatial information that is related to the referential objects by structural analogy.
Therefore, it promotes mental model building and deep understanding (Johnson-Laird, 1983). Interestingly, the effect size of representation mode was very large for the
visualization test (η² = .36), large for the transfer test (η² = .15), and medium for the comprehension test (η² = .09). We conclude that these different effect sizes reflect the different requirements of the tests. On the visualization test, students are required to access their visual-spatial representations of the learning content; however, they are not required to manipulate these representations. In order to generate creative problem solutions on the transfer test, students not only must access their visual-spatial representations but also manipulate and relate them to one another. Therefore, these processes may require resources beyond accessing the constructed mental
representations. When answering the comprehension test, the students did not have to rely on their visual-spatial representations, but could also draw on their explicit verbal knowledge about the text content. Thus, the data show benefits of pictorial summaries across the different tests, but also indicate that these benefits vary according to the characteristics of the particular dependent measures.
With regard to the effect of learning activity, predefined summaries were found to be more beneficial than self-generated summaries for transfer and visualization test
performance. These results support Hypothesis 2.2 and indicate that providing learners with predefined summaries helps them to focus their attention on the relevant text content, thereby providing a scaffold for learners' cognitive processing. Evidently,
students in the predefined-summary groups engaged in deep cognitive processing. They actively processed the summaries and benefitted from them. By contrast, students in the self-generated-summary groups may have invested effort in extraneous cognitive
processing while they constructed the summaries. Apparently, it is important to
distinguish between the students' cognitive processing and their behavioral processing (Mayer, 2009). Students who are asked to generate summaries have to engage in
behavioral processing but might not engage in deep cognitive processing. By contrast, students who study a predefined summary do not have to engage in behavioral
processing but can still engage in deep cognitive processing. Similarly, Stull and Mayer (2007) found that students who were asked to construct graphic organizers needed more learning time and showed less understanding of the text than those who were asked to view graphic organizers. These results confirm previous research showing that learners encounter problems when applying learning strategies. They often do not accurately apply strategies, and in turn, strategy application does not affect learning outcomes (e.g.,
Garner, 1985; Hilbert & Renkl, 2008; Leutner, Leopold, & den Elzen-Rump, 2007; Mateos et al., 2008; Slotte & Lonka, 1999).
With regard to visualization test performance, we also found an ordinal interaction effect of learning activity and representation mode in addition to the main effects of learning activity and representation mode. This interaction indicates that the benefits of predefined compared to self-generated summaries were more pronounced in the
pictorial-summary groups than in the verbal-summary groups (see Fig. 1). One
explanation for this effect is that the visualization test focused on students' visual-spatial representations of the learning content. Providing students with pictorial summaries enabled them to base their own visual-spatial representation on these pictorial summaries, whereas asking students to self-construct pictorial summaries may have evoked extraneous cognitive processing (Leutner et al., 2009). Consequently, the mental representations of the self-generated pictorial-summary group remained less clear than those of the predefined pictorial-summary group.
A second purpose of the study was to investigate students' strategic processing and how it affects learning performance. Consistent with our prediction, the groups that learned with pictorial summaries reported more mental imagery than the groups that learned with verbal summaries (Hypothesis 3). Processing or constructing pictorial summaries stimulated students to mentally visualize the text content. Interestingly, there was no difference in self-reported imagery between the pictorial summary groups. Adding pictorial summaries to the instructional materials and asking students to view these summaries had obviously been sufficient for inducing students to form mental images—at least with regard to their self-reports. By contrast, instructing students to study verbal summaries or create verbal summaries did not facilitate imagery processes. One explanation for this result could be that students focused their attention on text-based processing, thereby leaving fewer resources for mental visualization processes. Contrary to our expectations, we did not find that students in the self-generated-summary groups reported more conceptual organization than students in the predefined-summary groups (Hypothesis 4). This result is in line with the idea that strategic processes are evoked not only by instructing students to construct summaries but also by providing the students with predefined summaries and asking them to study these summaries. When one considers both the self-reports on strategy use and the better performance of the predefined-summary groups, these results suggest that it is not the amount of strategic activity but rather the quality of these strategic processes that is crucial for the benefits of strategy use. Although both groups reported that they conceptually organized the text content, the predefined-summary groups outperformed the self-generated-summary groups in their ability to transfer their knowledge to new problems. We suggest that this effect can be attributed to the predefined-summary groups using the summaries as a type of scaffold for their strategic processing and thereby being more likely to focus on relevant content.
A third purpose of the study was not only to investigate the effects of strategic activity and representation mode on test performance and strategy use but also to explore
relations between these variables. The first mediation analysis shows that the quality of students' spatial representations of learning content, assessed by the visualization test, fully mediated the influence of the representation mode on transfer performance
(Hypothesis 5). This result is consistent with previous findings showing strong relations between the quality of students' visual-spatial representations of learning content and their learning performance (Leopold & Leutner, 2012; Schwamborn et al., 2010; Van Meter, 2001). Furthermore, the results of the second mediation analysis extend previous work by demonstrating that the strategic processes of mentally imagining text content mediate the effect of representation mode on the quality of students' visual-spatial representations (Hypothesis 6). Whereas the effect of representation mode on transfer performance was fully mediated by students' spatial representations, the effect of
representation mode on students' spatial representations was partly mediated by mental imagery activities. One explanation for the partial mediation may be that students' use of mental imagery was assessed by a self-report questionnaire. Self-report measures are often subject to criticisms. Accordingly, students may report more strategic processing than they actually execute because they believe this is socially approved or because they base their self-assessment on their belief that these strategies are effective (Garner & Alexander, 1989; Samuelstuen & Bråten, 2007). A combination of self-report measures and other performance-based measures may provide more reliable measures of strategy use. Another possibility is that, in addition to mental imagery, other processes may account for the results.
Limitations of the study exist in the fact that the text employed was explanatory in nature and focused on complex spatial relations between chemical structures and bonds. Thus, the results are limited to these kinds of texts, and additional research extending the text genre and content area is required. It should be noted that in the present study, although pictorial summaries were found to be more beneficial than verbal summaries, we do not assume a one-sided connection such that pictorial tasks are solely related to model-focuses processing and verbal tasks are solely related to text-based processing. The crucial point is whether the strategy supports text-based processing or model-based processing. The quality of the particular task and the genre of the text have to be
considered. Therefore, a verbal task can enhance deep cognitive processing when the strategy focuses the learner's attention on the referential content (e.g., Kiewra, 1989;
Slotte & Lonka, 1999).
Furthermore, it should be noted that the time for processing the text in the present study was constrained, and a sample of students with a limited age range participated in the study. As the students were young adults, they may already have acquired some knowledge about processing text with provided pictorial or verbal summaries. Thus, predefined summaries may not be beneficial and may not elicit strategic processes in a sample of younger students. Further research is required to replicate the pattern of results with other age groups.
Alesandrini, 1981
Amstad, 1978
Anderson and Armbruster, 2000
Anderson and Thiede, 2008
Baron and Kenny, 1986
In sum, the reported results suggest that researchers should consider not only how the variation of representation and learning mode affect learning performance and strategy use, but also how these variables interact. The present results are relevant to reading education programs that are developed to promote understanding. The results indicate that researchers and practitioners should consider the representation mode of the learning content. With regard to strategic activities, the results suggest that quality is more important than quantity, and that learning performance can be enhanced by providing learners with a well-prepared predefined summary that provides a scaffold for their strategic processing.
Acknowledgments
The present publication is based on a research project funded by the German Research Foundation (DFG; LE 645/9-1 as part of FOR 511). We thank Boris Forthmann and Stephan Dutke for helpful comments on earlier versions of this manuscript.
Recommended articles Citing articles (39)
References
K.L. Alesandrini
Pictorial-verbal and analytic-holistic learning strategies in science learning Journal of Educational Psychology, 73 (1981), pp. 358-368
View Record in Scopus Google Scholar
Amstad, T. (1978). Wie verständlich sind unsere Zeitungen? [How easily
readable are our newspapers?] (Doctoral dissertation). Zürich: Studenten-Schreib-Service.
Google Scholar
T.H. Anderson, B.B. Armbruster Studying
M.L. Kamil, P.B. Mosenthal, P.D. Pearson, R. Barr (Eds.), Handbook of reading research, Vol. III, Erlbaum, Mahwah, NJ (2000), pp. 657-679
View Record in Scopus Google Scholar
M.C.M. Anderson, K.W. Thiede
Why do delayed summaries improve metacomprehension accuracy? Acta Psychologica, 128 (2008), pp. 110-118
Article Download PDF View Record in Scopus Google Scholar
R.M. Baron, D.A. Kenny
Best et al., 2005
Borst and Kosslyn, 2012
Bråten and Strømsø, 2010
Brown et al., 1983
Byrne, 2012
Denis, 2008
Ekstrom et al., 1976
conceptual, strategic, and statistical considerations
Journal of Personality and Social Psychology, 51 (1986), pp. 1173-1182
View Record in Scopus Google Scholar
R. Best, M. Rowe, Y. Ozuru, D.S. McNamara Deep-level comprehension of science texts
Topics in Language Disorders, 25 (2005), pp. 65-83
CrossRef View Record in Scopus Google Scholar
G. Borst, S.M. Kosslyn
Scanning visual mental images: some structural implications Revisited
V. Gyselinck, F. Pazzaglia (Eds.), From mental imagery to spatial cognition and language, Psychology Press, London (2012), pp. 19-42
View Record in Scopus Google Scholar
I. Bråten, H.I. Strømsø
Effects of task instruction and personal epistemology on the understanding of multiple texts about climate change
Discourse Processes, 47 (2010), pp. 1-31
Google Scholar
A.L. Brown, J.D. Day, R.S. Jones The development of plans for summarizing texts Child Development, 54 (1983), pp. 968-979
View Record in Scopus Google Scholar
B.M. Byrne
Structural equation modelling with Mplus Taylor & Francis group, New York (2012)
Google Scholar
M. Denis
Assessing the symbolic distance effect in mental images constructed from verbal descriptions: a study of individual differences in the mental comparison of distances
Acta Psychologica, 127 (2008), pp. 197-210, 10.1016/j.actpsy.2007.05.006
Article Download PDF View Record in Scopus Google Scholar
R.B. Ekstrom, J.W. French, H.H. Harman, D. Dermen Manual for kit of factor-referenced cognitive tests
Educational Testing Service, Princeton, NJ (1976)
Finke and Pinker, 1982
Flesch, 1948
Flower and Hayes, 1980
Foos et al., 1994
Garner, 1985
Garner and Alexander, 1989
Gil et al., 2010a
Gil et al., 2010b
R.A. Finke, S. Pinker
Spontaneous imagery scanning in mental extrapolation
Journal of Experimental Psychology: Learning, Memory, and Cognition, 8 (1982), pp. 142-147
View Record in Scopus Google Scholar
R. Flesch
A new readability yardstick
Journal of Applied Psychology, 32 (1948), pp. 221-233
CrossRef View Record in Scopus Google Scholar
L. Flower, J. Hayes
The dynamics of composing: making plans and juggling constraints
L. Gregg, E. Steinberg (Eds.), Cognitive processes in writing, Lawrence Erlbaum Associates, Hillsdale, NJ (1980), pp. 31-50
Google Scholar
P.W. Foos, J.J. Mora, S. Tkacz
Student study techniques and the generation effect Journal of Educational Psychology, 86 (1994), pp. 567-576
View Record in Scopus Google Scholar
R. Garner
Text summarization deficiencies among older students: awareness or production ability?
American Educational Research Journal, 22 (1985), pp. 549-560
View Record in Scopus Google Scholar
R. Garner, P.A. Alexander Metacognition: answered and unanswered questions Educational Psychologist, 24 (1989), pp. 143-158
CrossRef View Record in Scopus Google Scholar
L. Gil, I. Bråten, E. Vidal-Abarca, H.I. Strømsø
Summary versus argument tasks when working with multiple documents: which is better for whom?
Contemporary Educational Psychology, 35 (2010), pp. 157-173
Article Download PDF View Record in Scopus Google Scholar
L. Gil, I. Bråten, E. Vidal-Abarca, H.I. Strømsø
Understanding and integrating multiple science texts: summary tasks are sometimes better than argument tasks
Reading Psychology, 31 (2010), pp. 30-68
Hall et al., 1997
Head et al., 1989
Hegarty, 2004
Heller and Perleth, 2000
Hidi and Anderson, 1986
Hilbert and Renkl, 2008
Höffler, 2010
Howe and Singer, 1975
V.C. Hall, J. Bailey, C. Tillman
Can student-generated illustrations be worth ten thousand words? Journal of Educational Psychology, 89 (1997), pp. 667-681
CrossRef View Record in Scopus Google Scholar
M.H. Head, J.E. Readence, R.R. Buss
An examination of summary writing as a measure of reading comprehension Reading Research and Instruction, 28 (1989), pp. 1-11
CrossRef View Record in Scopus Google Scholar
M. Hegarty
Mechanical reasoning by mental simulation Trends in Cognitive Sciences, 8 (2004), pp. 280-285
Article Download PDF View Record in Scopus Google Scholar
K.A. Heller, C. Perleth
Kognitiver Fähigkeitstest für 4.–12. Klassen, Revision [Cognitive ability test for grades 4–12, revised version]
Hogrefe, Göttingen, Germany (2000)
Google Scholar
S. Hidi, V. Anderson
Producing written summaries: task demands, cognitive operations, and implications for instruction
Review of Educational Research, 56 (1986), pp. 473-493
View Record in Scopus Google Scholar
T.S. Hilbert, A. Renkl
Concept mapping as a follow-up strategy to learning from texts: what characterizes good and poor mappers?
Instructional Science, 36 (2008), pp. 53-73
CrossRef View Record in Scopus Google Scholar
T.N. Höffler
Spatial ability: Its influence on Learning with visualizations – a meta-analytic review
Educational Psychology Review, 22 (2010), pp. 245-269
CrossRef View Record in Scopus Google Scholar
M.J.A. Howe, L. Singer
Presentation variables and student activities in meaningful learning British Journal of Educational Psychology, 45 (1975), pp. 52-61
Johnson-Laird, 1983
Kalyuga et al., 2003
Kiewra, 1989
Kintsch, 1998
Kintsch and van Dijk, 1978
Larkin and Simon, 1987
León, 1997
Leopold and Leutner, 2012
Leutner et al., 2007
P.N. Johnson-Laird
Mental models: Towards a cognitive science of language, inference and consciousness
Cambridge University Press, Cambridge (1983)
Google Scholar
S. Kalyuga, P. Ayres, P. Chandler, J. Sweller The expertise reversal effect
Educational Psychologist, 38 (2003), pp. 23-31
CrossRef View Record in Scopus Google Scholar
K.A. Kiewra
A review of note-taking: the encoding-storage paradigm and beyond Educational Psychology Review, 1 (1989), pp. 147-172
View Record in Scopus Google Scholar
W. Kintsch
Comprehension: A paradigm for cognition Cambridge University Press, Cambridge (1998)
Google Scholar
W. Kintsch, T.A. van Dijk
Toward a model of text comprehension and production Psychological Review, 85 (1978), pp. 363-394
CrossRef View Record in Scopus Google Scholar
J.H. Larkin, H.A. Simon
Why a diagram is (sometimes) worth ten, thousand words Cognitive Science, 11 (1987), pp. 65-99
View Record in Scopus Google Scholar
J.A. León
The effects of headlines and summaries on news comprehension and recall Reading and Writing: An Interdisciplinary Journal, 9 (1997), pp. 85-106
View Record in Scopus Google Scholar
C. Leopold, D. Leutner
Science text comprehension: drawing, main idea selection, and summarizing as learning strategies
Learning and Instruction, 22 (2012), pp. 16-26
Article Download PDF View Record in Scopus Google Scholar
D. Leutner, C. Leopold, V. den Elzen-Rump
Leutner et al., 2009
Levin and Mayer, 1993
MacKinnon, 2008 McNamara et al., 1996 McNamara et al., 2007 Mateos et al., 2008 Mayer, 1996 Journal of Psychology, 21 (2007), pp. 174-182
CrossRef View Record in Scopus Google Scholar
D. Leutner, C. Leopold, E. Sumfleth
Cognitive load and science text comprehension: effects of drawing and imagining text content
Computers in Human Behavior, 25 (2009), pp. 284-289
Article Download PDF View Record in Scopus Google Scholar
J.R. Levin, R.E. Mayer Understanding illustrations in text
B.K. Britton, A. Woodward, M. Binkley (Eds.), Learning from textbooks, Erlbaum, Hillsdale, NJ (1993), pp. 95-113
Google Scholar
D.P. MacKinnon
Introduction to statistical mediation analysis Lawrence Erlbaum Association, New York (2008)
Google Scholar
D.S. McNamara, E. Kintsch, N.B. Songer, W. Kintsch Are good texts always better? Interactions of text coherence, background knowledge, and levels of understanding in learning from text
Cognition and Instruction, 14 (1996), pp. 1-43
CrossRef View Record in Scopus Google Scholar
D.S. McNamara, Y. Ozuru, R. Best, T. O'Reilly The 4-pronged comprehension strategy framework
D.S. McNamara (Ed.), Reading comprehension strategies, Erlbaum, New York (2007), pp. 465-496
View Record in Scopus Google Scholar
M. Mateos, E. Martin, R. Villalón, M. Luna
Reading and writing to learn in secondary education: online processing activity and written products in summarizing and synthesizing tasks
Reading and Writing: An Interdisciplinary Journal, 21 (2008), pp. 675-697
CrossRef View Record in Scopus Google Scholar
R.E. Mayer
Learning strategies for making sense out of expository text: the SOI model for guiding three cognitive processes in knowledge construction
Educational Psychology Review, 8 (1996), pp. 357-371
Mayer, 2009
Mayer et al., 1996
Mayer and Gallini, 1990
Paivio, 1986
Pintrich, 2000
Pressley and Harris, 2006
Renkl and Atkinson, 2007
Samuelstuen and Bråten, 2007
R.E. Mayer
Multimedia learning
(2nd ed), Cambridge University Press, New York (2009)
Google Scholar
R.E. Mayer, W. Bove, A. Bryman, R. Mars, L. Tapangco
When less is more: meaningful learning from visual and verbal summaries of science textbook lessons
Journal of Educational Psychology, 88 (1996), pp. 64-73
View Record in Scopus Google Scholar
R.E. Mayer, J.K. Gallini
When is an illustration worth ten thousand words? Journal of Educational Psychology, 82 (1990), pp. 715-726
View Record in Scopus Google Scholar
A. Paivio
Mental representations: A dual-coding approach Oxford University Press, Oxford, England (1986)
Google Scholar
P.R. Pintrich
The role of goal-orientation in self-regulated learning
M. Boekaerts, P.R. Pintrich, M. Zeidner (Eds.), The handbook of self-regulation, Academic Press, San Diego, CA (2000), pp. 451-502
Article Download PDF View Record in Scopus Google Scholar
M. Pressley, K.R. Harris
Cognitive strategy instruction: from basic research to classroom instruction P. Alexander, P. Winne (Eds.), Handbook of educational psychology (2nd ed.), Academic, San Diego (2006), pp. 265-286
Google Scholar
A. Renkl, R.K. Atkinson
Interactive learning environments: Contemporary issues and trends. An introduction to the special issue
Educational Psychology Review, 19 (2007), pp. 235-238
CrossRef View Record in Scopus Google Scholar
M.S. Samuelstuen, I. Bråten
Examining the validity of self-reports on scales measuring students' strategic processing
British Journal of Educational Psychology, 77 (2007), pp. 351-378
Schmalhofer and Glavanov, 1986
Schnotz and Bannert, 2003
Schwamborn et al., 2010
Slotte and Lonka, 1999
Spörer et al., 2009
Stull and Mayer, 2007
Taylor and Beach, 1984
Van Meter, 2001
F. Schmalhofer, D. Glavanov
Three components of understanding a programmer's manual: verbatim, propositional, and situational representations
Journal of Memory and Language, 25 (1986), pp. 279-294
Article Download PDF View Record in Scopus Google Scholar
W. Schnotz, M. Bannert
Construction and interference in learning from multiple representations Learning and Instruction, 13 (2003), pp. 141-156
Article Download PDF View Record in Scopus Google Scholar
A. Schwamborn, H. Thillmann, C. Leopold, E. Sumfleth, D. Leutner
Der Einsatz von vorgegebenen und selbst generierten Bildern als
Textverstehenshilfe beim Lernen aus einem naturwissenschaftlichen Sachtext [Presented and self-generated pictures in learning from scientific text]
Zeitschrift für Pädagogische Psychologie[German Journal of Educational Psychology], 24 (2010), pp. 221-233
CrossRef View Record in Scopus Google Scholar
V. Slotte, K. Lonka
Review and process effects of spontaneous note-taking on text comprehension Contemporary Educational Psychology, 24 (1999), pp. 1-20
Article Download PDF View Record in Scopus Google Scholar
N. Spörer, J.C. Brunstein, U. Kieschke
Improving students' reading comprehension skills: effects of strategy instruction and reciprocal teaching
Learning and Instruction, 19 (2009), pp. 272-286
Article Download PDF View Record in Scopus Google Scholar
A.S. Stull, R.E. Mayer
Learning by doing versus learning by viewing: three experimental comparisons of learner-generated versus author-provided graphic organizers
Journal of Educational Psychology, 99 (2007), pp. 808-820
CrossRef View Record in Scopus Google Scholar
B.M. Taylor, R.W. Beach
The effects of text structure instruction on middle-grade students comprehension and production of expository text
Reading Research Quarterly, 19 (1984), pp. 134-146
CrossRef View Record in Scopus Google Scholar