DOI 10.1007/s00421-014-2911-0
InvItED REvIEw
Maximal oxygen consumption in healthy humans: theories
and facts
Guido Ferretti
Received: 3 March 2014 / Accepted: 12 May 2014 / Published online: 2 July 2014 © Springer-verlag Berlin Heidelberg 2014
smaller is the active muscle mass. In hypoxia, the interven-tion of lung resistances as limiting factors restricts the role played by cardiovascular and peripheral factors.
Keywords Exercise · Cardiovascular system · Muscle ·
Oxygen flow · Models · Hypoxia · Bed rest
List of symbols
a Angular coefficient of whipp’s model of a ramp test
b Y-intercept of whipp’s model of a ramp test
CaO2 Arterial oxygen concentration CvO2 Mixed venous oxygen concentration Dempsey effect Desaturation of arterial blood at maximal
exercise in subjects with high ˙VO2max
DLO2 Lung diffusion capacity for oxygen
DtO2 tissue diffusion capacity for oxygen
F Fraction
FIO2 Inspired oxygen fraction
FL Pulmonary fraction of oxygen flow limitation
Fm Mitochondrial fraction of oxygen flow
limitation
Fp Peripheral fraction of oxygen flow limitation
FQ Cardiovascular fraction of oxygen flow
limitation
Ft tissue fraction of oxygen flow limitation
Fv ventilatory fraction of oxygen flow
limitation
G Conductance
GL Pulmonary conductance of oxygen flow
Gm Mitochondrial conductance of oxygen
flow
Abstract this article reviews the concept of maximal
oxygen consumption ( ˙VO2max) from the perspective of mul-tifactorial models of ˙VO2max limitation. First, I discuss pro-cedural aspects of ˙VO2max measurement: the implications of ramp protocols are analysed within the theoretical work of Morton. then I analyse the descriptive physiology of ˙VO2max, evidencing the path that led to the view of mono-factorial cardiovascular or muscular ˙VO2max limitation. Multifactorial models, generated by the theoretical work of di Prampero and wagner around the oxygen conductance equation, represented a radical change of perspective. these models are presented in detail and criticized with respect to the ensuing experimental work. A synthesis between them is proposed, demonstrating how much these models coincide and converge on the same conclusions. Finally, I discuss the cases of hypoxia and bed rest, the former as an example of the pervasive effects of the shape of the oxygen equilib-rium curve, the latter as a neat example of adaptive changes concerning the entire respiratory system. the conclusion is that the concept of cardiovascular ˙VO2max limitation is reinforced by multifactorial models, since cardiovascular oxygen transport provides most of the ˙VO2max limitation, at least in normoxia. However, the same models show that the role of peripheral resistances is significant and cannot be neglected. the role of peripheral factors is greater the Communicated by nigel A.S. taylor.
G. Ferretti (*)
Département des neurosciences Fondamentales, Université de Genève, 1 Rue Michel Servet, 1211 Geneva 4, Switzerland e-mail: [email protected]
G. Ferretti
Dipartimento di Scienze Cliniche e Sperimentali, Università di Brescia, viale Europa 11, 25123 Brescia, Italy
Gp Peripheral conductance of oxygen flow
GQ Cardiovascular conductance of oxygen
flow
Gt total conductance of oxygen flow
Gt tissue conductance of oxygen flow
Gv ventilatory conductance of oxygen flow
k velocity constant
Kp Dimensionless constant relating PvO2 and PcO2
Kw wagner’s constant (slope of diffusion
line)
PAO2 Mean alveolar oxygen partial pressure
PaO2 Arterial oxygen partial pressure
Pb Barometric pressure
PcO2 Mean capillary oxygen partial pressure
PIO2 Inspired oxygen partial pressure
PmO2 Mitochondrial oxygen partial pressure
PvO2 Mixed venous oxygen partial pressure
˙Q Cardiac output
˙Qmax Maximal cardiac output
˙QaO2 Oxygen flow in arterial blood (systemic oxygen delivery)
R Resistance
RL Pulmonary resistance to oxygen flow
Rm Mitochondrial resistance to oxygen flow
Rp Peripheral resistance to oxygen flow RQ Cardiovascular resistance to oxygen flow Rt total resistance to oxygen flow
Rt tissue resistance to oxygen flow
Rv ventilatory resistance to oxygen flow
S Ramp slope
SaO2 Arterial oxygen saturation
StPD Standard temperature and pressure dry
t time
T Exhaustion time in a ramp test
TS Step duration in a ramp test
˙V Gas flow
˙VA Alveolar ventilation
˙VA/ ˙Q ventilation/perfusion ratio
Vm Mitochondrial volume
v Speed
˙VO2 Oxygen uptake
˙VO2max Maximal oxygen consumption
˙w Mechanical power
W′ work carried out above the critical
power in a ramp test
˙wcr Critical power
˙wmax Maximal mechanical aerobic power ˙wpeak Peak power of a ramp test
βb Oxygen transfer coefficient for blood βg Oxygen transfer coefficient for air
Δ Before a variable, designates a change in the value of that variable
Introduction
Shortly after its discovery, it became clear that oxygen is used in animal metabolism and that the rate at which oxy-gen is consumed by an organism increases with the level of physical activity. Since the cells are the site of oxygen consumption, whereas oxygen is to be taken from ambi-ent air, the concept of oxygen flow from air to cells along a pathway for oxygen (here defined as the respiratory system, taken in its broadest sense) started soon to gain momentum. the oxygen flow takes place across a number of intermediate steps, including flow into the lungs (venti-lation), transfer from lungs to blood (essentially diffusion), convective transport by the blood (circulation) and transfer from blood to tissues (again diffusion). this concept can be traced back to Paul Bert and Claude Bernard in the second half of the nineteenth century and is included in the current definition of respiratory system. Yet the quantitative rela-tionships describing the oxygen flow from air to cells were formulated only in more recent times (Otis 1987; Piiper et al. 1971, 1984; Piiper and Scheid 1981; Rahn and Fenn
1955; Shephard 1969). Each of these relationships can be expressed with equations that share an analogy with Ohm’s law, in which oxygen flow is driven by pressure gradients against numerous resistances in series. the ensemble of these relationships sets the conceptual basis of the oxygen cascade theory of the respiratory system.
the concept of maximal oxygen consumption ( ˙VO2max) was actually created, when it was observed that the linear relationship between oxygen uptake ( ˙VO2) and mechani-cal power ( ˙w) attains a plateau which cannot be overcome despite further increases of ˙w (Herbst 1928; Hill and Lup-ton 1923). It immediately became clear that the ˙VO2max must be limited at some levels along the respiratory system. the quest for the factors that limit ˙VO2max has not ceased ever since. Yet for a long time, the oxygen cascade theory was not considered in addressing the subject of ˙VO2max limitation, and the discussion focused on the identifica-tion of a single limiting step. the theoretical insufficiency of this concept, however, was driving research in the field towards a dead end.
A new vision, indicating a possible way out, took shape at the beginning of the 1980s, when taylor and weibel (1981) resumed the oxygen cascade theory as a tool for describing oxygen transfer from ambient air to the mito-chondria on a whole-body level at maximal exercise, in an attempt at understanding the structural constraints of res-piratory systems under maximal stress in animals encom-passing a wide range of body size. that idea gave origin to a remarkable series of works on the structural support to ˙VO2max in mammals, the results of which were summarized in a splendid book by Ewald weibel (1984). Most impor-tant, that idea brought to maturity the process towards a
revolutionary approach to ˙VO2max limitation, whereby attention was moved from the identification of the single factor, to the ensemble of the multiple factors that contrib-ute to ˙VO2max limitation. the way to the conception of the first multifactorial model of ˙VO2max limitation (di Pramp-ero 1985; di Prampero and Ferretti 1990; Ferretti and di Prampero 1995, 2003) was open, and a second multifacto-rial model joined soon (wagner 1992, 1993, 1996a, b).
the main aim of this review was to discuss ˙VO2max from the perspective of the multifactorial models of ˙VO2max lim-itation. Before doing this, however, I find useful to propose a discussion of some procedural aspects and consequences of ˙VO2max measurement and a short analysis of the descrip-tive physiology of ˙VO2max, which focuses on the path that led to the classical view of monofactorial cardiovascular or muscular ˙VO2max limitation. the multifactorial models are then presented in detail, criticized with respect to the exper-imental work that they generated, and a synthesis between them is attempted. Finally, I discuss the particular cases of ˙VO2max in hypoxia and after bed rest, the former because of the effects of the shape of the oxygen equilibrium curve and the consequent progressively greater role of the lungs as limiting factor, the latter because it is a very neat exam-ple of adaptive changes concerning the entire respiratory system, studied under strictly controlled conditions.
Methodological aspects of ˙VO2max determination
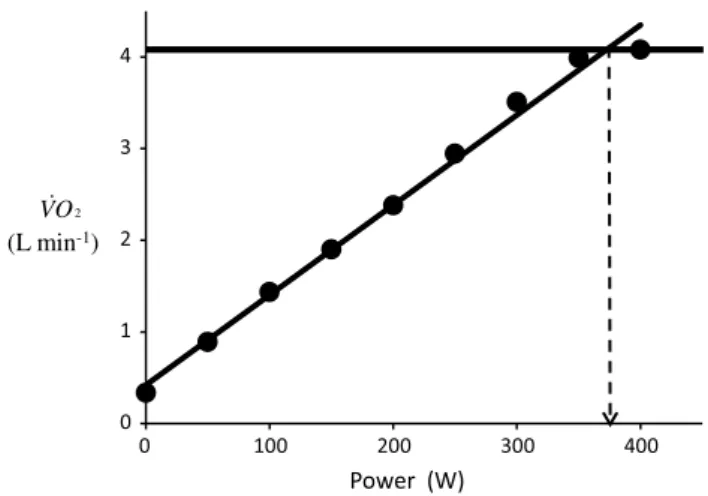
the classical protocol for ˙VO2max measurement is the incremental discontinuous steady state protocol, by which ˙VO2max is identified as the plateau attained by the rela-tionship between “steady state” ˙VO2 and ˙w, in which ˙VO2 is given at standard temperature (273°K) and pressure (760 mmHg), dry (StPD). the ˙w at which the plateau is attained was defined as the maximal mechanical aerobic power ( ˙wmax). In fact, ˙wmax corresponds to the minimal ˙w requiring a rate of energy expenditure by the working mus-cles equal to ˙VO2max. the classical protocol was thought to allow a direct measurement of the actual ˙wmax, which is unequivocally identified as the ˙w at the crossing between the ˙VO2max plateau and the line describing the ˙VO2 ver-sus ˙w relationship (Åstrand et al. 2003; di Prampero 1981; Howley et al. 1995; taylor et al. 1955). An example of a classical individual relationship between ˙VO2 and ˙w is reported in Fig. 1, along with a graphical identification of ˙VO2max and ˙wmax.
the ˙VO2max plateau, however, is not observable in all tests. According to Gordon et al. (2012), the incidence of the ˙VO2max plateau depends on the modality of exercise administration. In absence of a clear ˙VO2max plateau, sub-sidiary criteria had to be defined, including: (1) a lack of
increase in heart rate between successive workloads; (2) a respiratory exchange ratio value ≥1.1; (3) blood lactate concentration higher than 10 mM at maximal exercise; and (4) a rate of perceived exertion on the Borg scale of at least 19/20 (Åstrand et al. 2003). when at least two of these sub-sidiary criteria for ˙VO2max establishment are met at the end of the test, there is sufficiently high guarantee that the test was indeed terminated at ˙VO2max (Howley et al. 1995). In absence of a plateau, if the subsidiary criteria hold, the ˙w corresponding to the highest measured ˙VO2 can be retained as the ˙wmax of the test. In holding with these concepts, it is important to note that, when a ˙VO2max test is coupled with a subsequent constant-power supramaximal exercise on the same subjects, no further increase in ˙VO2max is observed (Hawkins et al. 2007).
the performance of the classical discontinuous ˙VO2max test is associated also with the determination of the so-called lactate threshold. Under this respect, the classical protocol has the undoubtful advantage of foreseeing resting recovery pauses between successive loads, allowing for the measurement of peak blood lactate concentration after each sequential work load. thus, a lactate versus ˙w curve can be constructed where the lactate threshold can be clearly identified (Brooks 1985). Although it has little physiologi-cal significance (see di Prampero and Ferretti 1999 for a discussion of this issue), the lactate threshold has nonethe-less remarkable practical importance for the prediction of performance, for it is related to the fraction of ˙VO2max that can actually be sustained over a given performance time (di Prampero 1986; Ferretti et al. 2011; Helgerud 1994).
(L min-1)
2
O V
Fig. 1 An example of a relationship between oxygen uptake ( ˙VO2) and power during a classical discontinuous protocol for ˙VO2max measurements. the reported data are unpublished and refer to a trained top-level cyclist tested in Geneva. the line through the points is the regression line calculated on the submaximal ˙VO2 values. the horizontal line indicates the ˙VO2max plateau. the vertical dashed arrow indicates the maximal aerobic power
Moritani et al. (1981) associated the lactate threshold with the concept of critical power ( ˙wcr). this variable was firstly defined by Monod and Scherrer (1965) as ‘‘the maxi-mum power that can be kept up for a very long time with-out fatigue.’’ this qualitative definition came nevertheless from the quantitative analysis of a graph in which they plot-ted the total work done, determined during several fatigu-ing exercise bouts of variable intensity, as a function of the exhaustion time. they gave a parabolic solution to this plot, where ˙wcr corresponds to the dependent variable’s asymp-tote. this relationship can be linearized by replacing time with its reciprocal as independent variable, from which we can compute two parameters: the y-axis intercept, corre-sponding to ˙wcr, and the line’s slope, which was interpreted as yielding the energy store component allowing sustaining an exercise at higher powers than ˙wcr (see Jones et al. 2010 for details on treatment). Subsequent studies have related the energy store component to overall anaerobic capacity and ˙wcr to fully aerobic power, with all muscle fibres act-ing as normoaerobic fibres (di Prampero and Ferretti 1999). this made these two constants conceptually independent of each other (Hill 1993; Miura et al. 2000; Poole et al. 1990; vanhatalo and Jones 2009).
this is not the place where to discuss the algebraic deri-vations of the ˙wcr concept, for which the interested reader may focus elsewhere (Jones et al. 2010; Morton 1996). More important is to remark the connections that exist between ˙wcr and steady state: during exercise below ˙wcr, a steady state in ˙VO2 (and in blood lactate concentration) is always attained if exercise lasts longer than 3 min; this is not so at ˙w above ˙wcr (Poole et al. 1988; Pringle and Jones 2002). Some consequences of this have to do with the con-cept of ˙wmax and are discussed below.
Apart from the classical discontinuous protocol, a vari-ety of procedures, either continuous or discontinuous, were proposed in the last decades to measure ˙VO2max. After the introduction of commercial breath-by-breath metabolic carts and the development of electromagnetically braked cycle ergometers, the continuous ramp protocols (Buch-fuhrer et al. 1983) have achieved worldwide diffusion, so that they have been progressively replacing the classical discontinuous protocol. the main reason for the success of these protocols is that they have a much shorter duration than the classical steady state protocols, being normally completed within 12 min. Ramp protocols and the classical discontinuous protocol yield the same values of ˙VO2max; moreover, the ˙VO2max attained at the end of ramp proto-cols is independent of the ramp characteristics (Adami et al. 2013; Amann et al. 2004; Chidnok et al. 2013; Dun-can et al. 1997; Fairshter et al. 1983; Maksud and Coutts
1971; McArdle et al. 1973; Morton et al. 1997; Zhang et al. 1991). In spite of this, ramp protocols generate higher peak mechanical powers ( ˙wpeak) at the end of the
tests, the greater is the mean slope of the ramp (Adami et al. 2013; Morton et al. 1997). this means that the ˙wpeak attained in a ramp test (1) varies with the protocol charac-teristics, (2) is unrelated to ˙VO2max and (3) is not the ˙wpeak. the concept of a strict relation between ˙VO2max and ˙wmax was undermined.
to sum up, if one is to measure ˙VO2max, he can rely on any type of ramp protocol. Conversely, if one is to measure also ˙wmax, ramp protocols are inadequate, and the classical discontinuous protocols are questioned.
The relationship between ˙VO2max, critical power
and maximal aerobic power
the analysis of ramp protocols of ˙VO2max testing led to the construction of two mechanical models: one proposed by whipp (1994) and the other by Morton (1994, 2011). the former model, concerning discrete ramps with steps of varying duration, implies an inverse relationship between ˙wpeak and step duration, described by a translated equilat-eral hyperbola of this form:
where TS is the step duration, constant b is equivalent to ˙wmax and constant a to the anaerobic work, i.e. the amount of mechanical work carried out relying on anaerobic energy sources. Equation (1) can be rewritten as:
Equation (2) describes the linear relationship between ˙wpeak and 1
TS, with slope equal to a and y-intercept equal to b. Adami et al. (2013) validated Eq. (2) experimentally, and they obtained b = 264 watt, which corresponded well to the experimental ˙wmax that they determined during a classi-cal ˙VO2max protocol (267 watt), and a = 2.61 kJ.
On the other side, Morton (1994, 2011) assumed that the ˙w in a ramp test increases continuously with time (t) at a constant rate and thus implied a linear relationship between ˙w and t whose angular coefficient is the ramp slope (S). In this case, the total mechanical work performed during a ramp is equal to the area of the triangle under the ˙w versus
t line. the subsequent analytical developments by Morton (1994) led to formulate the following equation:
where T is the time to exhaustion and W′ is the work car-ried out above ˙wcr in a ramp test. If we then multiply Eq. (3) by S, we get: (1) TS· ( ˙wpeak− b) = a (2) ˙wpeak= a TS + b (3) T = ˙wcr· S−1+ 2W′ S (4) S· T = ˙wpeak= ˙wcr+ √ 2W′S
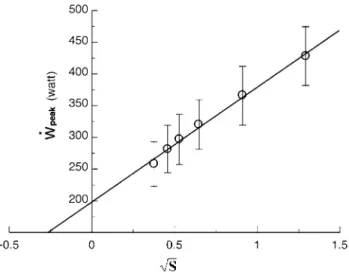
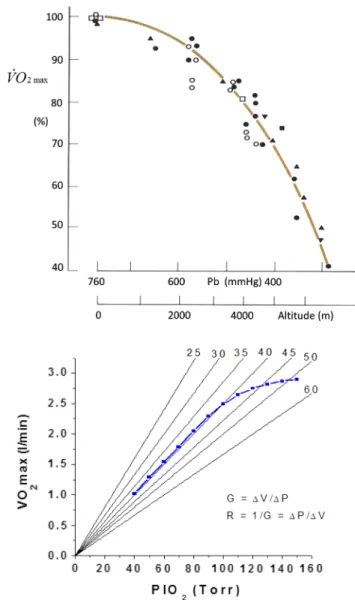
Equation (4) predicts that, if we plot ˙wpeak as a function of √
S we obtain linear relationships with slope equal to √2W′ and y-intercept equal to ˙wcr. Adami et al. (2013) con-structed such a plot (Fig. 2) and obtained ˙wcr = 198 watt, i.e. 74.2 % of the ˙wmax determined on the same subjects, and W′ = 16.8 kJ. Similar values for W′ were obtained also by Morton et al. (1997). note that, according to Adami et al. (2013), W′ was seven times greater than constant a of whipp’s model, despite being calculated from the same experimental results. this discrepancy follows the fact that
a and W′ have different meanings, for a refers to the energy from anaerobic sources sustaining supramaximal powers, whereas W′, which includes a, is the energy (aerobic and anaerobic) sustaining all the work carried out above ˙wcr.
In both models, ˙wpeak varies only with the mean ramp’s slope, whereas ˙wcr (in Morton’s model) and ˙wmax (in whipp’s model) are constants. thus, for any given ramp, the two models must yield the same ˙wpeak value. this allows combination of Eqs. (2) and (4), to obtain, after rearrangement (Adami et al. 2013):
Equation (5) tells that, if √2· W′· S is plotted as a func-tion of 1
TS, we obtain a linear relationship with y-intercept equal to ( ˙wmax− ˙wcr) and slope equal to a. this implies that (1) the difference between ˙wmax and ˙wcr is a constant, that is independent of anaerobic capacity, step duration and ramp slope; (2) ˙wmax and ˙wcr are coupled, since they can vary only by the same absolute amount; and (3) their ratio becomes higher the higher is ˙wmax. Although they represent (5) √
2· W′· S = a TS + ( ˙w
max− ˙wcr)
different concepts, there is an evident quantitative link between ˙wmax and ˙wcr.
Equation (5) provides the theoretical basis for explaining several observations about ˙wcr, namely that the ˙wcr/ ˙wmax ratio (1) is higher in athletes with elevated ˙VO2max (Heu-bert et al. 2005) than in subjects with low ˙VO2max (Adami et al. 2013); (2) increases with aerobic training (Heubert et al. 2003; Jenkins and Quigley 1992) and high-intensity interval training (Gaesser and wilson 1988); (3) decreases in hypoxia (Dekerle et al. 2012; valli et al. 2011). Since ˙wcr is related to the so-called anaerobic threshold and thus to the sustainable fraction of ˙VO2max, Eq. (5) also explains why all these three variables are higher in endurance ath-letes and are increased by intense aerobic training (di Prampero 1986; tam et al. 2012). Finally, Eq. (5) implies that ˙wmax has a radically different meaning from ˙wpeak. It defines the maximal ˙w that can be attained by the contract-ing muscle mass in which the chemical energy is converted into mechanical work. A theoretical corollary of this defini-tion is the linearity of the ˙VO2 versus ˙w relationship along the entire ˙w range.
Experimentally, however, when ˙VO2 is measured at the mouth, this is not necessarily so. At high ˙w, above the ˙wcr, when the step duration is shorter than 3 min, the ˙VO2 versus ˙w relationship bends downwards, because of the increase of the time constant of the primary component (phase II) of the ˙VO2-on kinetics and the ensuing “early” lactate accu-mulation (Cerretelli et al. 1979). On the other hand, when the step duration exceeds 5 min, the appearance of the slow component (phase III) of the ˙VO2 on kinetics prevents the experimental attainment of a clear ˙VO2 steady state (Camus et al. 1988; Gaesser and Poole 1996; Henson et al. 1989; Poole et al. 1988, 1991, 1994). In this case, since the slope of the slow component is greater the higher is ˙w, the apparent relationship between ˙VO2 and ˙w above ˙wcr bends upwards, becoming nonlinear (Zoladz et al. 1995). these phenomena may hinder the experimental observation of ˙wmax, making its identification impossible in a ˙VO2 versus ˙w relationship. the further demonstration that at least some of the determinants of phase III are intrinsic to the contract-ing muscle mass (Bailey et al. 2010; Krustrup et al. 2009; Poole et al. 1991; Rossiter et al. 2001) not only undermined the meaning of the classical protocol for ˙VO2max determi-nation, but also led some authors to deny the physiological value of the ˙wmax concept. However, if Eq. (5) is correct, ˙wmax is to fall on the ˙VO2 versus ˙w relationship established at ˙w values below the ˙wcr, as long as Eq. (5) predicts that it is independent of the characteristics of phase II and phase III. thus, ˙wmax can still be identified after a classical dis-continuous ˙VO2max test by simply extrapolating the ˙VO2 versus ˙w line up to a ˙w for which a ˙VO2 equal to ˙VO2max is attained, on the assumption that the extra oxygen consumed Fig. 2 An experimental analysis of Morton’s model of ramp tests,
whereby peak power ( ˙wpeak) is plotted as a function of the square root of the mean ramp slope (S). Data are presented as mean ± SD. the regression line was calculated on the ensemble of the individual data. From Adami et al. (2013)
for phase III is not a need for sustaining the energy conver-sion in the actually contracting muscle fibres.
In any case, Eq. (5) is a nice tool for determining ˙wmax and ˙wcr from ramp tests. Although it requires the perfor-mance of multiple tests (at least three), it does not need the measurement of ˙VO2max and thus the utilization of a meta-bolic cart. In fact, application of Eq. (5) to this aim requires only an assumption concerning W′ and the knowledge of S and Ts. An alternative protocol for the computation of ˙wmax may consist of a few ˙w below ˙wcr, carried out until steady state and followed by a steep ramp: the ramp would pro-vide the ˙VO2max value of the subject, the steady state light steps would allow construction of the submaximal ˙VO2 ver-sus ˙w line, and the extrapolation of this line up to ˙VO2max would provide an estimate of the ˙wmax value.
In terms of mechanical work performed, a ramp test does not differ from a discontinuous test, provided the duration of each step is the same. In fact, an incremental stepwise ramp test corresponds to an intermittent test with recovery time between successive work loads equal to 0 s (Morton and Billat 2004). However, a comparison of con-tinuous and intermittent protocols allowing determination of ˙wcr and W′, characterized by similar amounts of work performed, showed that ˙wcr tends to be lower and W′ to be higher with intermittent than with continuous exercise administration, in contrast with the predictions made (Mor-ton and Billat 2004). In fact, theory predicts ˙wcr, and thus
˙wmax, to be independent of the applied protocol, and thus, in discontinuous protocols, of step duration and rest dura-tion, and in ramp protocols, of the ramp’s mean slope. Fur-ther studies may be needed to better clarify this issue.
Descriptive physiology of ˙VO2max
After its discovery, it soon became evident that the ˙VO2max was subject to remarkable variability within the general population and as a consequence of genetic interindividual differences and of several adaptive phenomena. Moreover, several acute manoeuvres could alter the ˙VO2max of a given subject. Eighty years of descriptive physiology of ˙VO2max have demonstrated that, on a systemic level, ˙VO2max is up to twice higher in endurance athletes than in sedentary individuals (Åstrand 1955; di Prampero et al. 1970; Los-negard et al. 2013; Lucia et al. 2006; Robinson et al. 1937; Saltin and Åstrand 1967; Strømme et al. 1977; veicsteinas et al. 1984; ventura et al. 2003). Differences, however, exist, depending on whether the athlete is expected to do antigravitational work, like in long-distance running or in uphill cycling (Billat et al. 2003; di Prampero 1986; di Prampero et al. 1970; Hagberg and Coyle 1984; Lucia et al.
2000; Padilla et al. 1999; Saltin and Åstrand 1967; tam et al. 2012), or not, like in cycling or skiing on flat tracks
(Capelli et al. 1998; Gaskill et al. 1999; Losnegard et al.
2013; Lucia et al. 2000; Padilla et al. 1999; Rusko 1992; Strømme et al. 1977; veicsteinas et al. 1984): in the former case, very high ˙VO2max values normalized per unit body mass were reported; conversely, the latter athletes are char-acterized by high absolute ˙VO2max values (expressed in L min−1). the highest normalized ˙VO2max value ever reported (90.6 ml min−1 kg−1) was observed on an extremely trained top-level cross-country skier (Burtscher et al. 2011).
˙VO2max is also higher in men than in women (Aspenes et al. 2011; Åstrand 1956, 1960; Buskirk and Hodgson
1987; Plowman et al. 1979; Sanada et al. 2007), the differ-ence being minimized when it is expressed relative to the lean body mass (Padilla et al. 1992; vanderburgh and Katch
1996) or when gender differences in muscle mass are accounted for (Sanada et al. 2007). the gender differences for ˙VO2max are maintained also as age progresses (talbot et al. 2000). with the only exceptions of African Pygmies (Ferretti et al. 1991) and nepalese Sherpas (Kayser et al.
1991; Faoro et al. 2014), no differences among ethnic groups were ever shown (Aghemo et al. 1971; Andersen et al. 1960; Billat et al. 2003; Ceaser et al. 2013; Chan et al. 1976; Chatterjee et al. 1991; Davies et al. 1972; di Prampero and Cerretelli 1969; Duncan and Horvath 1988; Duncan et al. 2005; Glick and Schwartz 1974; Greksa et al.
1984; Hunter et al. 2001; Rode and Shephard 1971, 1984; Sanada et al. 2007; weston et al. 2000; wyndham et al.
1963), also as far as top athletes are concerned (Billat et al.
2003; Bosch et al. 1990; Saltin and Åstrand 1967; Saltin et al. 1995; tam et al. 2012). Genetic components were demonstrated as major determinants of ˙VO2max variability in the population (Bouchard 2012; Bouchard et al. 1999,
2011b; Hildebrandt et al. 2003; Prior et al. 2003, 2006; Rice et al. 2012).
˙VO2max decreases with age (Aspenes et al. 2011; Åstrand 1956, 1960; Buskirk and Hodgson 1987; Heath et al. 1981; McGuire et al. 2001; Robinson 1938; Robinson et al. 1975, 1976; Sanada et al. 2007; talbot et al. 2000), with athletes maintaining higher ˙VO2max values along the entire life span (Grimsmo et al. 2010; Heath et al. 1981; Robinson et al. 1976; Rogers et al. 1990; Rusko 1992). the ˙VO2max fall with age is largely a consequence of the devel-opment of muscle hypotrophy (Fleg and Lakatta 1989; Proctor and Joyner 1997) and is accelerated in oldest ages (Fleg et al. 2005).
Endurance training, whether with continuous or inter-val-training protocols, increases ˙VO2max, depending on the overall training intensity (Blomqvist and Saltin 1983; Clausen et al. 1973; Ekblom et al. 1968; Gormley et al.
2008; Helgerud et al. 2007; Henriksson and Reitmann
1977; Hickson et al. 1981, 1985, 1997; Hoppeler et al.
1985; Ogawa et al. 1992; Saltin et al. 1968), as does high-intensity interval training (Astorino et al. 2012; Breil
et al. 2010; Dunham and Harms 2012; Gibala et al. 2012; Perry et al. 2008; Sloth et al. 2013). It also slows down the ˙VO2max decline with age (Grimsmo et al. 2010; Hag-berg 1987; Hawkins et al. 2001; Ogawa et al. 1992). the opposite occurs in case of prolonged inactivity (Capelli et al. 2006; Convertino et al. 1982, 1986; Ferretti et al.
1997a; Greenleaf et al. 1989; Kashihara et al. 1994; Saltin et al. 1968; Stremel et al. 1976), a condition that will be discussed more in detail at a later stage using bed rest as the experimental paradigm (see “Of maximal oxygen con-sumption at the end of bed rest” section).
these effects on ˙VO2max are associated with consensual changes in maximal cardiac output ( ˙Qmax) (Blomqvist and Saltin 1983; Clausen et al. 1973; Daussin et al. 2007; Ekb-lom et al. 1968; McGuire et al. 2001; Ogawa et al. 1992; wilmore et al. 2001), as well as in muscle capillarity, mito-chondrial volume density and muscle oxidative enzyme activities (see below).
˙VO2max decreases in hypoxia, both acute and chronic (see for review Cerretelli 1980; Ferretti 1990; Cerretelli and Hoppeler 1996, more details are given in section “Of maximal oxygen consumption in hypoxia”). Conversely, exposure to elevated inspired oxygen pressures leads only to slight, if any, increases in ˙VO2max (Bannister and Cun-ningham 1954; Esposito and Ferretti 1997; Fagraeus et al.
1973; Margaria et al. 1961, 1972; taunton et al. 1970; welch and Pedersen 1981). the effect of hyperoxia on ˙VO2max is particularly evident in endurance athletes (Fer-retti et al. 1997b), who are subject to the Dempsey effect (Dempsey and wagner 1999; Dempsey et al. 1984; Lawler et al. 1988; Powers et al. 1989). It is smaller, the smaller is the active muscle mass (Cardus et al. 1998).
More recently, the evolution of sport science has led to numerous studies investigating the combined effects of hypoxia and training. In particular, the combination defined “live high—train low” received great consideration in an attempt at improving the effects of training on ˙VO2max and performance, with contradictory results (Geiser et al.
2001; Hahn et al. 2001; Levine and Stray-Gundersen 1997; Rodríguez et al. 2007; Roels et al. 2007; Stray-Gundersen et al. 2001; wilhite et al. 2013). these variable effects were attributed to several factors, including differences in ven-tilatory response to hypoxia (wilhite et al. 2013), living altitude (Favier et al. 1995; Masuda et al. 2001; Stray-Gun-dersen and Levine 2008) and modality of training adminis-tration (Robertson et al. 2010; Stray-Gundersen and Levine
2008; ventura et al. 2003). In permanent residents at alti-tude, training in hypoxia did not provide larger effects on ˙VO2max than training in normoxia (Favier et al. 1995).
Special attention was given to the effects of acute manipulations of the cardiovascular oxygen transport sys-tem on ˙VO2max. In fact ˙VO2max is lower in acute anaemia
than in normaemia (Burnley et al. 2006; Celsing et al.
1987; Gledhill et al. 1999; Gordon et al. 2014; Krip et al.
1997; woodson et al. 1978) and is higher in acute poly-cythaemia than in normaemia (Berglund and Hemmings-son 1987; Buick et al. 1980; Celsing et al. 1987; Ekblom and Huot 1972; Ekblom et al. 1976; Gledhill et al. 1999; Sawka et al. 1987; Spriet et al. 1986; thomson et al. 1982; turner et al. 1993), also when polycythaemia has been induced by erythropoietin administration (Audran et al.
1999; Berglund and Ekblom 1991; Russell et al. 2002; thomsen et al. 2007). ˙VO2max is lower also during carbon monoxide breathing than during air breathing (Ekblom and Huot 1972; Ekblom et al. 1975; Horvath et al. 1988; Pirnay et al. 1971; vogel and Gleser 1972) and during cold expo-sure than at thermoneutral temperature (Bergh and Ekblom
1979; Kruk et al. 1991; McArdle et al. 1976; Pirnay et al.
1977).
A strong link was typically observed between ˙VO2max and ˙Qmax (see Blomqvist and Saltin 1983 and Cerretelli and di Prampero 1987, for a review of this relationship), heart work capacity (Levine et al. 1991), and more recently with leg blood flow (Calbet et al. 2004, 2007; Richardson et al. 1995b). Moreover, muscle blood flow and specific muscle ˙VO2 can increase well above the levels attained at maximal exercise (Andersen and Saltin 1985; Richardson et al. 1995a; Rowell et al. 1986), suggesting the existence of a peripheral (muscular) reserve which cannot be fully exploited during exercise involving a big muscle mass. Finally, both selective and non-selective beta-adrenergic blockade were shown to decrease ˙VO2max (Kaiser et al. 1986).
this impressive body of knowledge led a majority of scientists in the field to the conclusion that, at least during exercise with large muscle groups, the single factor that limits ˙VO2max is cardiovascular oxygen transport capacity (Blomqvist and Saltin 1983; Clausen 1977; Ekblom 1969,
1986; Mitchell and Blomqvist 1971; Rowell 1974; Saltin and Rowell 1980; Saltin and Strange 1992; Scheuer and tipton 1977).
However, several data seemed to contradict this view, namely that (1) the smaller is the active muscle mass, the lower is the measured ˙VO2max (Åstrand and Saltin 1961; Bergh et al. 1976; Davies and Sargeant 1974; Hermansen and Saltin 1969; Ogita et al. 1996; Rådegran et al. 1999; Richardson et al. 1995b, 1999; Secher et al. 1974); (2) endurance training of one leg increases ˙VO2max during exercise with that leg only (Saltin et al. 1976); (3) endur-ance athletes have not only a higher ˙Qmax (Ekblom and Hermansen 1968) but also a greater fraction of oxidative type I muscle fibres, a greater capillary density and a higher activity of oxidative enzymes than sedentary individuals (Brodal et al. 1977; Costill et al. 1976; Gollnick et al. 1972;
Hermansen and wachtlova 1971; Hoppeler and weibel
2000; Howald 1982; tesch and Karlsson 1985; Zumstein et al. 1983) and (4) muscle capillary supply, muscle mito-chondrial volume and muscle oxidative enzyme activities are increased by physical training (Andersen and Henriks-son 1977; Geiser et al. 2001; Gollnick et al. 1973; Henriks-son 1977; Henriksson and Reitmann 1977; Holloszy and Coyle 1984; Hoppeler 1986; Hoppeler and Flück 2003; Hoppeler et al. 1985; Howald et al. 1985; Ingjer 1979; Perry et al. 2007) and decreased by prolonged inactivity (Berg et al. 1993; Booth 1982; Ferretti et al. 1997a; Hikida et al. 1989; Hoppeler and Flück 2003). Furthermore, it was shown that the ˙VO2max of altitude-acclimatized subjects in chronic hypoxia, suddenly exposed to normoxic gas mix-tures, does not return to the preacclimatization levels (Cer-retelli 1976). the latter finding was attributed to a possible decrease in muscle mass and oxidative capacity induced by altitude acclimatization and prompted numerous studies on this subject (see Cerretelli and Hoppeler 1996 for a review and Ferretti 2003 for a critical revisitation of that study).
On these other grounds, some authors concluded that muscle oxidative capacity, rather than cardiovascular oxy-gen transport, limits ˙VO2max (Cerretelli 1980; Lindstedt et al. 1988; taylor 1987; weibel 1987), especially during exercise with small muscle groups (Davies and Sargeant
1974; Kaijser 1970; Saltin 1977), and highly significant relationships between ˙VO2max and either mitochondrial mass or capillary density were established (Hoppeler et al.
1985; Hoppeler 1990; Zumstein et al. 1983). More recently, experiments carried out with single-leg exercise protocols demonstrated clear peripheral limitation to oxygen flow (Rådegran et al. 1999; Richardson et al. 1995b; Roach et al. 1999). the same experimental model allowed dem-onstration of a different ˙VO2max decrease in hypoxia when exercise was performed with small rather than big muscle masses (Calbet et al. 2009). Under some circumstances, the lungs were also considered as the limiting step, for instance in extreme hypoxia (west 1983) and in well-trained endur-ance athletes (Dempsey et al. 1984, 2008; Dempsey and wagner 1999).
the search for the factor that limits ˙VO2max in humans led to a diversity of viewpoints, and a long-lasting, stir-ring and essentially unresolved debate developed for some decades, to the point that still in Saltin and Strange (1992)
could remark that no consensus exists on what limits the ˙VO2max. All this debate occurred within a well-defined con-text that of a monofactorial ˙VO2max limitation. this concept is so deeply rooted in the mind of so many physiologists that still recently an important review on ˙VO2max main-tained a monofactorial focus (Levine 2008). Yet the per-spective has radically changed, and this debate has become outdated, with the introduction of multifactorial models of ˙VO2max limitation.
Obviously enough, what precedes is not an exhaustive report of the descriptive physiology of ˙VO2max. It is only a short summary of those data that pertain to whole-body level, most of which were taken to support the monofacto-rial theories of ˙VO2max limitation. In recent times, remarka-ble developments concerned the molecular determinants of
˙VO2max. Genomic influences, control pathways, molecular regulatory mechanisms were widely studied as soon as the technological evolution made such studies possible. the molecular mechanisms affecting ˙VO2max are not the object of this review. the interested reader can refer to other, more specific, articles (Bouchard et al. 2011a; Eliakim and nemet 2010; Flück 2010; Hoppeler et al. 2008; Mooren et al. 2014; Seene et al. 2011). Going beyond the physio-logical context, the clinical aspects of ˙VO2max and physical exercise capacity have also gained remarkable considera-tion in recent years, as long as low ˙VO2max and sedentary lifestyles are universally recognized as major risk factors for systemic chronic diseases (Booth et al. 2012).
Introducing the multifactorial models of ˙VO2max
limitation
the oxygen cascade theory, applied to maximal exercise, is, I dare say, the axiom upon which the multifactorial mod-els of ˙VO2max limitation were constructed. the oxygen cas-cade theory states that, in analogy with water flow in pipes or current in high-resistance electric lines, oxygen flow in the respiratory system (at maximal exercise, ˙VO2max) is driven by oxygen pressure gradients against several in series resistances. In principle, each of these resistances may provide a given measurable fraction of the overall ˙VO2max limitation. In the respiratory system, however, two different interpretations of the oxygen cascade theory can be proposed, depending on whether the cardiovascular oxy-gen transport step is considered merely convective or not. In the former case, the driving force of oxygen flow along the cardiovascular system from lung to muscle capillar-ies would be the gradient set by the mean capillary oxy-gen partial pressure (PcO2), respectively, in the lungs and in muscle, which should be obtained by Bohr’s integra-tion at the respective level. In this case, oxygen would be transferred from lungs to muscles by the convective move-ment of blood. In the latter case, the driving force would be the difference between arterial and mixed venous oxygen partial pressures (PaO2 and PvO2 respectively), thus mak-ing blood circulation tantamount to any resistance step of a hydraulic system.
Both approaches have advantages and inconveniences, which define their limits. In fact, there is an unresolved quantitative step related to the effects of heterogeneity of ventilation/perfusion ( ˙VA/ ˙Q) distribution in the lungs,
which generates the difference between mean alveolar oxygen partial pressure (PAO2) and PaO2. the best
analyti-cal tool produced so far for describing the oxygen transfer between alveoli and arterial blood is the diffusion–perfu-sion interaction equation for the lung (Piiper and Scheid
1981), which nevertheless fails from including the effect of ˙VA/ ˙Q heterogeneity on PaO2. this unresolved passage
was treated differently in the two main multifactorial models, and this generated some apparent conceptual and analytical differences in the respective formulations. Also the experimental testing of the two models was as a conse-quence different, so that knowledge developed along two parallel pathways. the analysis that I propose (see sec-tion “A critical comparison of the two models”) is aimed at demonstrating that in fact the two main multifactorial models, which for simplicity I will call di Prampero’s model and wagner’s model, in honour of the two minds that conceived them, produce equivalent results as far as the analysis is restricted to the trait of the respiratory sys-tem distal to arterial blood. this restriction is acceptable in normoxia, as long as it is admitted that there is no limita-tion of ˙VO2max imposed by pulmonary ventilation and lung diffusion.
An analysis of di Prampero’s model
the first version of this model was proposed by di Pramp-ero (1985) and subsequently refined in several other publi-cations (di Prampero 2003; di Prampero and Ferretti 1990; Ferretti and di Prampero 1995). the analysis assumes (1) a full in series resistance model of the respiratory system from ambient air to the mitochondria and (2) steady state condition. If this is the case, assuming a system character-ized by n resistances in series, we have:
where ˙V is the gas flow, ΔP is the pressure gradient sus-taining ˙V across the ith resistance R and ΔPt is the overall pressure gradient. In the respiratory system of a human at maximal exercise, ˙V is ˙VO2max and PT is the difference between the inspired and the mitochondrial partial pressure of oxygen, PIO2 – PmO2. Since PmO2 tends to 0 mmHg (Gayeski and Honig 1986; Honig and Gayeski 1993; Rich-ardson et al. 1995c, 2001; wagner 2012), ΔPt can be set
equal to PIO2 with negligible error. Of course, ΔPt is the sum of the pressure gradients across each resistance: In analogy with Dalton’s law on pressure in gas mixtures, we can define the fraction of the overall limitation imposed by the ith resistance to oxygen flow as:
(6) ˙V = P1 R1 = P2 R2 = · · · = Pn Rn = PT RT (7) PT= P1+ P2+ · · · + Pn whence
this means that the overall limitation to the flow of gas in a hydraulic model of in series resistances, set equal to 100 %, is equal to the sum of the fractional limitations imposed by each of the resistances in the system.
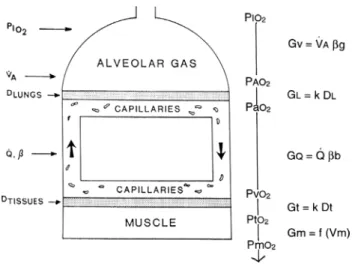
the identification of five resistances of clear physi-ological meaning led to the version of the oxygen cascade reported in Fig. 3. From proximal (ambient air) to distal (mitochondria), these are the ventilatory resistance (Rv), the lung resistance (RL), which refers to the transfer of oxy-gen from the alveoli to the arterial blood, the cardiovascu-lar resistance (RQ), the tissue resistance (Rt), which refers to oxygen transfer from peripheral circulation to muscle fibres, and the mitochondrial resistance (Rm), related to mitochondrial oxygen flow and utilization. these last two resistances, although they concern general concepts that can easily be perceived, are difficult to separate experimen-tally, because they are strongly interrelated on a structural basis. therefore, for subsequent analysis, they have been merged to form a lumped peripheral resistance (Rp). For the specific case of ˙VO2max, Eq. (6) can thus be rewritten as follows: (8) Fi= Ri RT (9) R1 RT+ R2 RT + · · · + Rn RT = F 1+ F2+ · · · + Fn= 1
Fig. 3 Schematic representation of the oxygen cascade from ambi-ent air to the mitochondria. Five steps are idambi-entified, namely oxygen flow (1) from ambient to alveolar air, (2) from alveolar air to arte-rial blood, (3) from artearte-rial to mixed venous blood; (4) from mixed venous blood to the cells, (5) from cells to mitochondria. As long as oxygen proceeds in the respiratory system, its partial pressure drops, for energy is lost to overcome the in series resistances opposing oxy-gen flow. At each step, the resistances are indicated as conductances. Five conductance terms are identified. Symbols are as in the abbrevia-tions’ list. Modified after taylor and weibel (1981)
Of these resistances, only two are characterized by pre-cisely defined physiological variables, namely Rv and RQ, which are, respectively, equal to:
where ˙VA is alveolar ventilation and ˙Q is cardiac output. the other two variables are the oxygen transfer coef-ficient for air (βg) and for blood (βb), i.e. the volume of
oxygen that can be displaced across a gradient of a unit of pressure. the former, in StPD condition, is equal to 1.16 ml mmHg−1 and is an invariant constant. Concerning
βb, it is equal to:
this corresponds to the average slope of the oxygen equi-librium curve. therefore, the value taken by βb is not invar-iant, for it depends on the oxygen pressure range on which our blood operates. the other three resistances cannot be translated into equivalent physiological expressions. Some-what arbitrarily, but not without logic, RL, Rt and Rm were set proportional, respectively, to a factor including lung dif-fusing capacity corrected for the effect of ˙VA/ ˙Q heteroge-neity, to muscle capillary density and to muscle mitochon-drial volume (di Prampero and Ferretti 1990).
Several manipulations, either chronic (e.g. training or prolonged bed rest) or acute, affect ˙VO2max without affect-ing PIO2 and thus ΔPt. As a consequence, the observed
increase in ˙VO2max is the result of changes in one or more of the resistances in series. the aim of the algebraic devel-opment of the model was to devise a manner of determining a value for the fraction of the overall ˙VO2max limitation that can be attributed to a given in series resistance. Assume that somebody trains an individual and obtains a given ˙VO2max increase, Δ ˙VO2max. this increase occurs because, accord-ing to the formulation of the oxygen cascade reported in Fig. 3, at least three resistances have decreased, namely RQ,
Rt and Rm, and so has Rt. thus, after training has induced a measurable increase in ˙VO2max with respect to the value before training, Eq. (10) can be rewritten as follows:
(10) ˙VO2max= PIO2− PAO2 RV = PAO2− PaO2 RL = Pa O2− PvO2 RQ = PvO2 Rp = PIO2 RT (11a) RV= 1 ˙VA· βg (11b) RQ= 1 ˙Q · βb (12) βb= (CaO2− CvO2) (PaO2− PvO2) (13) ˙VO2max+ ˙VO2max=
PIO2 RT+ RT
If we divide Eq. (10) by Eq. (13), we obtain:
which, since RT is the sum of the changes in the ith resist-ances in series, can also be written as follows:
As a consequence of the definition of F (see Eqs. 8 and 9), when a change in any resistance is induced by any specific manoeuvre acting on it, we have:
So, Eq. (15) can be reformulated as follows:
Equation (17) has four unknowns, and as such cannot be solved. However, if we deal with a condition in which only one resistance is varied by an acute manipulation, as is the case, according to di Prampero and Ferretti (1990), for RQ after acute blood reinfusion or withdrawal, three terms of Eq. (17) annihilate, and we remain with a simpli-fied version of it, with only one unknown, which, for the specific case of changes in RQ only, takes the following
form:
Equation (18) allows computation of FQ, provided we know the ˙VO2max before and after the manoeuvre, the
RQ before the manoeuvre and the absolute change in RQ
induced by the manoeuvre. An analytical solution of Equa-tion (18), using data from different sources in the literature, is reported in Fig. 4, where the ratio between the ˙VO2max values before and after the manoeuvre (left-hand branch of Eq. 18) is plotted as a function of the ratio between ΔRQ and RQ: this relationship ought to be linear, with y-intercept equal to 1 and slope equal to FQ. From linear regression analysis of the data reported in Fig. 4, di Prampero and Fer-retti (1990) obtained FQ = 0.70, indicating that cardiovas-cular oxygen transport provides 70 % of the fractional limi-tation of ˙VO2max.
(14) ˙VO2max
( ˙V O2max+ � ˙VO2max)
= 1 + �RT RT (15) ˙ V O2max ( ˙V O2max+ � ˙V O2max) = 1 +(�RV+ �RLR+ �RQ+ �Rp) T (16) Ri RT = Fi· Ri Ri (17) ˙ V O2max ( ˙V O2max+ � ˙V O2max)= 1 + FV �RV RV + F L �RL RL + FQ �RQ RQ + Fp �Rp Rp (18) ˙VO2max
( ˙V O2max+ � ˙VO2max)
= 1 + FQ �RQ
Of a nonlinear respiratory system
the finding that FQ = 0.70 implies that the respiratory system does not have linear behaviour. In fact, if the res-piratory system provided linear responses, the ratio of any given Ri to Rt would be equal to the ratio of the pressure
gradient over that Ri to the overall pressure gradient, so that we would have:
from which we would have obtained FQ = 0.50 instead of
0.70 (di Prampero and Ferretti 1990).
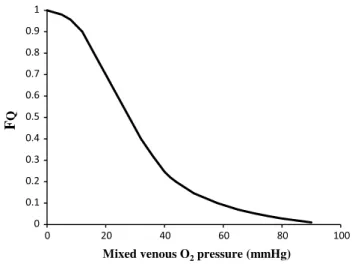
the source of nonlinearity, and thus the source of this discrepancy, can be identified in the effects of the oxygen equilibrium curve on βb, as shown in Fig. 5. these effects
have remarkable consequences, which I would summarize as follows. Assume that an acute manoeuvre is able to act directly on Rv only, e.g. reducing it. this would tend to increase PAO2, and thus PaO2, but would not change the
associated CaO2, because in normoxia our blood operates on the flat portion of the oxygen equilibrium curve. there-fore, since PvO2 undergoes only small changes, we would have a reduction of βb and thus, according to Eq. (11b), an
increase in RQ. this means that, just because of the shape of the oxygen equilibrium curve, as long as we are in nor-moxia, a specific manoeuvre acting only on Rv cannot have effects on ˙VO2max, because any change in Rv would
inevi-tably entail an opposite effect on RQ. thus, (1) we would have a solution of Eq. (10) with at least two unknowns instead of one, and (2) we would have a ˙VO2max ratio of 1: in normoxia, Rv and RL do not limit ˙VO2max.
In normoxia, we thus remain with a kind of two-site system in which the effective limitation appears distally to
PaO2. this is sufficient to explain why FQ = 0.7 instead of 0.5, so that we necessarily have Fp = 0.3, partly attributable
to Ft, partly to Fm. An analysis of the possible repartition of Fp between Ft and Fm was carried out by Ferretti et al. (19)
FQ=
(PaO2− PvO2) PIO2
Fig. 4 Graphical representation of Eq. (22). the changes in ˙VO2max consequent to an acute manoeuvre acting on the cardiovascular resistance to oxygen flow (RQ) are expressed as the ˙VO2max before the manoeuvre over the ˙VO2max after the manoeuvre ( ˙VO2max+ Δ) and plotted as a function of the ratio between the induced change in RQ (ΔRQ) and the RQ before the manoeuvre. Points are mean values from different sources in the literature. the continuous straight line is the corresponding regression equation (y = 1.006 + 0.7 x, r = 0.97, n = 15). the slope of the line, equal to 0.7, indicates that 70 % of the overall limitation to ˙VO2max is imposed by cardiovascular oxygen transport. Modified after di Prampero and Ferretti (1990)
Fig. 5 Average oxygen equilibrium curve for blood. two arterial and mixed venous points are reported, applying to normoxaemia (a0, v0) and hypoxaemia (a1, v1). the two straight lines connecting the two couples of points have a slope that is equal to the respective oxygen transport coefficients for blood (βb), which turns out higher in the latter than in the former case. As a consequence, when an increase
in the ventilatory resistance Rv entails a decrease in arterial oxygen partial pressure, βb becomes higher and the cardiovascular resistance RQ lower. these two phenomena compensate each other, so that no changes in ˙VO2max are induced by an acute change in Rv: the lungs do not limit ˙VO2max in normoxia. Symbols are as in the abbreviation list. Modified after di Prampero (1985)
(1997a). their analysis suggests that the differences in ˙VO2max would be minimal, if we assume, on one extreme,
Rt = Rp, and on the other extreme, Rm = Rp, and that it
makes no difference to assume Rt and Rm in series or in parallel. Direct experimental assessment of the parameters of Eq. (18) confirmed that FQ in normoxia is between 0.65
and 0.76 (Bringard et al. 2010; turner et al. 1993).
Experimental testing of di Prampero’s model
Beside the notion that Rv and RL do not limit ˙VO2max in normoxia, the nonlinearity of the model implies that (1)
Rv and RL do limit ˙VO2max in hypoxia; (2) RQ in hypoxia
is less than 0.7; (3) the decrease of ˙VO2max in hypoxia is larger in subjects undergoing the Dempsey effect; (4) sub-jects with high ˙VO2max in normoxia undergo an increase in ˙VO2max in hyperoxia, contrary to subjects with low ˙VO2max in normoxia; (5) there ought to be a linear relationship between ˙VO2max and SaO2; (6) FQ is lower and Fp is higher
when exercise is carried out with small than with big mus-cle masses; (7) the fall of ˙VO2max in hypoxia is smaller the smaller is the contracting muscle mass.
the roles played by Rv and RL in normoxia and hypoxia were investigated by Esposito and Ferretti (1997), who acted acutely on Rv by changing air density through the
replacement of nitrogen with helium in the inspired gas mixture. they found no change in ˙VO2max while breathing the He–O2 mixture in normoxia, despite the increase in ˙VA at maximal exercise, whereas in hypoxia, the increase in ˙VA under He–O2 breathing was accompanied by a signifi-cant increase in ˙VO2max, coherently with the predictions. Similar results were recently obtained also by Ogawa et al.
(2010). Consistently, several studies showed no effects of respiratory muscle training on ˙VO2max in normoxia (Downey et al. 2007; Edwards and Cooke 2004; Esposito et al. 2010; Markov et al. 2001; Sonetti et al. 2001), but a positive effect was observed in hypoxia (Downey et al.
2007; Esposito et al. 2010).
Points (2), (4) and (5) of the above list were studied in acute hypoxia and hyperoxia by Ferretti et al. (1997b), who investigated two groups of subjects, one with high, the other with low ˙VO2max in normoxia. they demonstrated that (1) the decrease in ˙VO2max was larger in the former than in the latter group at all investigated FIO2; (2) the former group, contrary to the latter, underwent a ˙VO2max increase in hyperoxia; (3) there was a highly significant linear relationship between ˙VO2max, expressed relative to the value in hyperoxia set equal to 100 %, and SaO2; (4) this relationship was the same in both groups, in agreement with the above predictions. wehrlin and Hallén (2006) even reported a linear decrease of ˙VO2max in hypoxia in endur-ance athletes. Coherent with this picture is also the finding
that can be reckoned from several publications (Benoit et al. 1995; Gavin et al. 1998; Kayser et al. 1994; Marconi et al. 2004; wilhite et al. 2013; woorons et al. 2005) that the ˙VO2max decrease in hypoxia is smaller the stronger is the ventilatory response to hypoxia.
An analysis of Wagner’s model
wagner (1993) constructed a three-equation system with three unknowns (PAO2, PaO2 and PvO2) by combining the mass conservation equation for blood (Fick principle) and the two diffusion–perfusion interaction equations (Piiper and Scheid 1981; Piiper et al. 1984), which, at steady state, must have equal solutions. the algebraic development of the system led to three equations allowing a solution for
PAO2, PaO2 and PvO2. these equations would lead to a unique, necessary ˙VO2max value for any combination of known values of PIO2, ˙VA, DL, ˙Q, βb and Dt at maximal
exercise (wagner 1993). wagner’s system of equations car-ries along a different vision of the oxygen cascade from di Prampero’s, with two mass balance equations responsible for convective oxygen transfer, associated with two con-ductive components, described by the diffusion–perfusion interaction equations. Proximally, the action of a convec-tive component with a diffusive component sets the maxi-mal flow of oxygen in arterial blood ( ˙QaO2max), and this is the first step in the system. Distally, the action of a con-vective component (Fick principle), combined with that of a diffusive component (the diffusion–perfusion interaction equation setting oxygen flow from peripheral capillaries to the muscle fibres), sets ˙VO2max. this is the key step of wagner’s model, on which he concentrated his attention, and which deserves more detailed analysis, especially for its quantitative consequences. the Fick equation can take either of the following solutions:
the presence of the term βb in Eq. (20) implies a nonlinear negative relationship between ˙VO2max and PvO2 (convec-tive curve), the algebraic expression of which depends on the solution that we may wish to give to the oxygen equi-librium curve. Concerning the diffusive component, it is described by the following equation:
where DtO2 is tissue diffusing capacity for oxygen and PmO2 is again equal to 0 mmHg. At steady state, Eqs. (20) and (21) must have the same solution, but since their right branches do not share any term, they cannot as such be compared on the same plot. the solution figured out by wagner was to assume direct proportionality between PvO2
(20) ˙VO2max= ˙Q · (CaO2− CvO2)= ˙Q · βb· (PaO2− PvO2)
(21) ˙VO2max= DtO2· (PcO2− PmO2)
and PcO2, because the segment of the oxygen equilibrium curve between these two pressures is essentially linear, and so within that segment βb can be considered invariant. thus, Eq. (21) can be rewritten as follows:
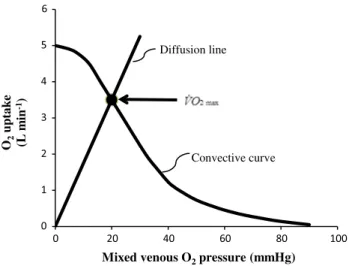
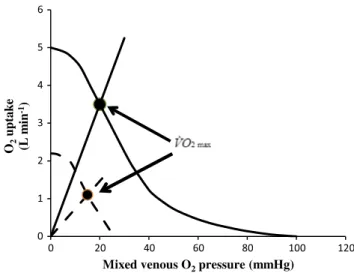
where Kp is the dimensionless constant relating PvO2 and PcO2. Equation (22) implies a positive linear relationship between ˙VO2max and PvO2 (diffusion line), which Roca et al. (1989) determined experimentally. the slope of the line is equal to the product DtO2· Kp, which from here on I will call wagner’s constant, Kw. Equations (20) and (22) give origin to analytical relationships that, if we plot ˙VO2max on the y-axis and PvO2 on the x-axis, can be represented on the same graph and directly compared (Fig. 6). In Fig. 6, the resulting ˙VO2max for any combination of ˙QaO2max and
Kw corresponds to the crossing of the two represented func-tions, which occurs at a precise value of PvO2.
Concerning the diffusive component, a decrease in DtO2 implies a decrease in Kw: the result is a drop of ˙VO2max and an increase in PvO2. the reverse is caused by an increase in DtO2. On the convective curve, representative of Eq. (20) an increase in the product ˙Q · βb carries along an increase in both ˙VO2max and PvO2. the intercept on the x-axis of the convective curve corresponds to the PaO2 point, i.e. the point at which PvO2 = PaO2: hyperoxia displaces this point
to the right, implying a slightly higher ˙VO2max, whereas hypoxia displaces it to the left. the y-intercept of the con-vective curve corresponds to the ˙QaO2max point, represent-ing the condition in which ˙VO2max= ˙QaO2max (wagner 1995, 1996a).
Experimental testing of Wagner’s model
wagner’s model predicts that a drop of Kw carries along a decrease in ˙VO2max with associated increase in PvO2. this is virtually impossible to test in humans with acute manoeuvres acting on DtO2, the most important determi-nant of Kw. Moreover, DtO2 is affected by haemoglobin concentration, as demonstrated in isolated-perfused dog muscle (Hogan et al. 1991a, b) and in humans (Schaffartzik et al. 1993). Looking at chronic alterations of DtO2 led to predict quite accurately the effects on ˙VO2max and PvO2 in patients affected by chronic obstructive pulmonary disease, once allowance was made for the simultaneous impair-ment of cardiovascular oxygen transport (wagner 1996a). An analysis of literature data of muscle morphometry and ˙VO2max of altitude-acclimatized climbers (Hoppeler et al. 1990; Oelz et al. 1986) or endurance-trained subjects (Hop-peler et al. 1985), in which I assumed direct proportionality between Kw and muscle capillary density, led to PvO2 val-ues coherent with wagner’s predictions.
(22) ˙VO2max= DtO2· Kp· PvO2
Controversial is the case of hyperoxia. the results of Fig. 6 would lead to predict an increase in ˙VO2max, because the rightwards displacement of the PaO2 point would change the slope of the convective curve in such a way that the diffusion line would be intercepted at a higher ˙VO2max value. Such an increase was rarely observed in humans, the only clear effects having been observed in subjects with elevated ˙VO2max, who are subject to the Dempsey effect (see section “Descriptive Physiology of ˙VO2max”). Rich-ardson et al. (1999) had to use pure oxygen breathing to be able to observe a ˙VO2max increase during single-leg exercise, as a consequence of increased free oxygen con-centration. the thoroughbred horse, a highly athletic ani-mal characterized by deep hypoxaemia at maxiani-mal exer-cise, was proposed as the nicest example supporting this prediction (wagner 1996a; wagner et al. 1989, 1996), which is not surprising at all, if one considers the size of the active muscle mass of a maximally exercising horse. Similar results were obtained with single-leg exercise stud-ies, in which local ˙VO2 can be measured by catheterizing the femoral artery and vein (Knight et al. 1993; Roca et al.
1992). this apparent discrepancy between theoretical pre-dictions and experimental data is hard to explain, and the hypotheses put forwards so far are scarcely convincing. On the opposite side of the spectrum, more convincing results were obtained in hypoxia, but these will be discussed more in detail in a specific paragraph (see “Of maximal oxygen consumption in hypoxia” section).
O2 uptak e (L mi n -1)
Mixed venous O2pressure (mmHg)
Convective curve Diffusion line
Fig. 6 Graphical representation of wagner’s model. Oxygen uptake ( ˙VO2) is plotted as a function of mixed venous oxygen pressure (PvO2). the curve with negative slope is wagner’s convective curve. the straight line with positive slope is wagner’s diffusion line, whose slope is wagner’s constant Kw. the convective curve intercepts the y-axis at a ˙VO2 equal to arterial oxygen flow ( ˙QaO2), which is the case when Kw = ∞. It intercepts the x-axis when PvO2 is equal to arterial oxygen pressure, which is the case when Kw = 0. the ˙VO2max value is found on the crossing of the convective curve with the diffu-sion line (full dot)


![Fig. 12 the ratio between maximal oxygen consumption ( VO ˙ 2max ) before and after a given manoeuvre [˙ VO 2max /(˙ VO 2max + Δ)] is reported as a function of the relative change in the cardiovascular resistance to oxygen flow (ΔR Q /R Q , x-axis)](https://thumb-eu.123doks.com/thumbv2/123doknet/14812991.612158/20.892.212.684.82.414/maximal-consumption-manoeuvre-reported-function-relative-cardiovascular-resistance.webp)
