Publisher’s version / Version de l'éditeur:
Journal of Instrumentation, 5, 12, pp. 1-7, 2010-12-15
READ THESE TERMS AND CONDITIONS CAREFULLY BEFORE USING THIS WEBSITE. https://nrc-publications.canada.ca/eng/copyright
Vous avez des questions? Nous pouvons vous aider. Pour communiquer directement avec un auteur, consultez la première page de la revue dans laquelle son article a été publié afin de trouver ses coordonnées. Si vous n’arrivez pas à les repérer, communiquez avec nous à [email protected].
Questions? Contact the NRC Publications Archive team at
[email protected]. If you wish to email the authors directly, please see the first page of the publication for their contact information.
NRC Publications Archive
Archives des publications du CNRC
This publication could be one of several versions: author’s original, accepted manuscript or the publisher’s version. / La version de cette publication peut être l’une des suivantes : la version prépublication de l’auteur, la version acceptée du manuscrit ou la version de l’éditeur.
For the publisher’s version, please access the DOI link below./ Pour consulter la version de l’éditeur, utilisez le lien DOI ci-dessous.
https://doi.org/10.1088/1748-0221/5/12/C12030
Access and use of this website and the material on it are subject to the Terms and Conditions set forth at
R&D towards cryogenic optical links
Christiansen, Mark; Galea, Raphael; Gong, Datao; Hou, Suen; Lissauer,
David; Liu, Chonghan; Liu, Tiankuan; Radeka, Veljko; Rehak, Pavel;
Sondericker, John; Stroynowski, Ryszard; Su, Da-Shung; Takacs, Peter;
Takai, Helio; Tcherniatine, Valeri; Teng, Ping-Kun; Thorn, Craig; Xiang, Anne
C.; Ye, Jingbo; Yu, Bo
https://publications-cnrc.canada.ca/fra/droits
L’accès à ce site Web et l’utilisation de son contenu sont assujettis aux conditions présentées dans le site
LISEZ CES CONDITIONS ATTENTIVEMENT AVANT D’UTILISER CE SITE WEB.
NRC Publications Record / Notice d'Archives des publications de CNRC: https://nrc-publications.canada.ca/eng/view/object/?id=9fb2c041-9ea5-4c99-9cf3-8b2ce4a8a6c7 https://publications-cnrc.canada.ca/fra/voir/objet/?id=9fb2c041-9ea5-4c99-9cf3-8b2ce4a8a6c7
R&D Towards Cryogenic Optical Links
Mark Christiansena, Raphael Galeab,1, Datao Gongc, Suen Houe, David Lissauerd, Chonghan Liuc*
, Tiankuan Liuc, Veljko Radekaf, Pavel Rehakf,2, John
Sonderickerc, Ryszard Stroynowskic, Da-Shung Sue, Peter Takacsf, Helio Takaid, Valeri Tcherniatined, Ping-Kun Tenge, Craig Thornd, Annie C. Xiangc, Jingbo Yec, Bo Yuf
a
Department of Electrical Engineering, Southern Methodist University, Dallas TX 75275, U.S.A.
b
Department of Physics, Columbia University, New York, NY 10027, U.S.A.
c
Department of Physics, Southern Methodist University, Dallas TX 75275, U.S.A.
d
Physics Department, Brookhaven National Laboratory, Upton, NY 11973, U.S.A.
e
Institute of Physics, Academia Sinica, Nangang 11529, Taipei, Taiwan
f
Instrumentation Division, Brookhaven National Laboratory, Upton, NY 11973, U.S.A.
1 Now at National Research Council of Canada, Ottawa, ON, K1A0R6, Canada 2 Deceased
E-mail: [email protected]
ABSTRACT: A number of critical active and passive components of optical links have been tested at 77 K or lower temperatures, demonstrating potential development of optical links operating inside the liquid argon time projection chamber (LArTPC) detector cryostat. A ring oscillator, individual MOSFETs, and a high speed 16:1 serializer fabricated in a commercial 0.25-µm silicon-on-sapphire CMOS technology continued to function from room temperature to 4.2 K, 15 K, and 77 K respectively. Three types of laser diodes lase from room temperature to 77 K. Optical fibers and optical connectors exhibited minute attenuation changes from room temperature to 77 K.
– 1 –
Contents
1. Introduction 1
2. Test setup 1
2.1 Circuits based on a SoS CMOS technology 1 2.2 Optical fibers and connectors 2
2.3 Laser diodes 2
2.4 Liquid helium setup 2
2.5 Liquid nitrogen setup 2
3. Test results 3
3.1 Circuits based on the SoS CMOS technology 3
3.1.1 Individual transistors 3
3.1.2 The ring oscillator 4
3.1.3 The serializer 4
3.2 Optical fibers and connectors 5
3.3 Laser diodes 6
4. Conclusion 7
1. Introduction
The liquid argon time projection chamber (LArTPC) is a detector proposed for the long baseline neutrino experiment [1]. Operating optical links inside a liquid argon cryostat has the advantages of low thermal load, high data bandwidth, low noise, and low power consumption. In this paper we present electrical and optical measurement results on critical components of optical links from room temperature to 77 K (liquid nitrogen temperature) or 4.2 K (liquid helium temperature). We have identified a CMOS technology and several passive components and found promising laser diodes for the development of optical links operating inside the liquid argon cryostat.
2. Test setup
2.1 Circuits based on a SoS CMOS technology
Individual transistors [2], a ring oscillator and a serializer [3] tested were fabricated in a commercial 0.25 µm silicon-on-sapphire (SoS) CMOS technology. All the NMOS and PMOS transistors tested were laid out with a large W/L ratio by an elongated layout. The transistors
were 40 µm wide and 0.25 µm long. The characteristic ID-VGS curves were measured using a
by a USB digital-input-output card was used to connect the terminals of the transistors to the picoammeter and the DC power supplies.
A 30-stage differential ring oscillator was implemented on the same die as the transistors which were tested. The output signals of the ring oscillator were transmitted through a twisted pair of cables and terminated with a 100-Ω resistor at the far end. The output waveform of the ring oscillator was recorded periodically using a real time oscilloscope and a differential probe.
A 5-Gbps 16:1 serializer was fed with 16 bit parallel data generated in a field-programmable gate array (FPGA). The serial output, which was a pseudorandom binary sequence (PRBS), of the serializer was recorded using a real time oscilloscope and a differential probe.
2.2 Optical fibers and connectors
A single mode (SM) optical fiber and a multi mode (MM) optical fiber have been tested. Both fibers were 50 meters long. However, the length of the part immersed in the liquid nitrogen was only 48 meters long.
Two types of LC connectors (mating sleeves), one with Zirconia sleeve for single mode and the other with Phosphor Bronze sleeve for multi mode, have been tested from room temperature to 77K. For each type five connectors were linked in series with fibers which had been tested, so when we calculated insertion loss changes of the connectors at low temperature the performance of the fibers were excluded. In both tests we used commercial small form-factor pluggable (SFP+) optical transmitters as the laser sources and a light wave multimeter to measure the optical power going through the fibers and connectors.
2.3 Laser diodes
A vertical cavity surface emitting laser (VCSEL) diode, a distributed feedback (DFB) laser diode and a Fabry Perot (FP) laser diode have been tested. The L-I-V characteristic curves of each laser diode were measured using a digital multimeter, a programmable DC power supply and a light wave multimeter. The optical spectra of each laser diode were measured using an optical spectrum analyzer (OSA).
2.4 Liquid helium setup
The measurements were performed parasitically with the regular operation of the Electron Bubble Chamber (EBC) [4]. A cryostat which operates between temperatures of 1 K and 300 K was designed to cool the EBC. The device under test (DUT) was located in the vacuum between the EBC and a liquid helium reservoir. The temperature of the DUT was determined by the temperatures of the surrounding heat shields. The temperature was monitored through a silicon diode clipped near the DUT.
The transistors and ring oscillators were tested using this setup. For all the components, the temperature cycle was performed twice. The resistors were kept working at 15 K for one hour at the first temperature cycle and 11 K for one hour at the second temperature cycle respectively. The ring oscillator was kept working at 4.2 K for one hour.
2.5 Liquid nitrogen setup
The DUT was attached at the bottom of a stepping motor system which was controlled via a computer. A Dewar which contained liquid nitrogen was put on the floor just below the bottom of the stepping motor system. The temperature depended on the distances between the DUT and
– 3 –
the liquid nitrogen surface. The temperature of the DUT was monitored by using a silicon diode attached near the DUT.
The serializers, optical fibers, connectors and laser diodes were tested using this setup. The stepping motor system made the temperature cycles, include the temperature varied from room temperature to 77K and the temperature varied from 77K to room temperature. Each component was temperature cycled at least twice and kept working at 77K more than one hour.
3. Test results
3.1 The circuits based on the SoS CMOS technology 3.1.1 Individual transistors
The characteristic ID-VGS curves of NMOS and PMOS transistors are shown in the Figure 1.The
curves becomes steeper as the VDS increases from 0.1 V to 1.2 V. Transconductance (gm) and
threshold voltage (|VT|) were extracted from the ID-VGS curves with |VDS| = 0.1 V at the linear
range.
Figure 1. the ID vs. VGS at different temperatures
Left : NMOS transistor, right : PMOS transistor
Figure 2. |VT| vs. temperature and gm vs. temperature
Left : NMOS transistor, right : PMOS transistor
It is shown in Figure 2 that the absolute values of the threshold voltages increase linearly above 77 K when the temperature decreases, consistent with the common transistor model [5]. The threshold voltage is not only inversely proportional to the temperature, but also has a complex relationship with Fermi energy which is also affected by temperature. The Fermi energy is roughly a constant above a certain temperature which dependents on doping
concentration and is 77 K here, so the threshold voltage increases just linearly as the temperature decreases. Below this certain temperature the Fermi energy is not a constant anymore and decreases as the temperature increases. The variation of Fermi energy below the certain temperature breaks the linear relationship between the threshold voltage and temperature.
The absolute values of transconductance increase at first, then decrease when the temperature decreases. This is caused by the temperature dependence of the mobility [6]. The two scattering mechanisms that influence carrier mobility are lattice scattering which causes an increase in mobility with decreasing temperature and impurity scattering which causes a decrease in mobility with decreasing temperature. The impurity scattering dominates at low temperature whereas the lattice scattering dominates at relatively high temperature. As we
know, the gm is proportional to the carrier mobility. Therefore the temperature dependence of
the transconductance is as in Figure 2.
3.1.2 The ring oscillator
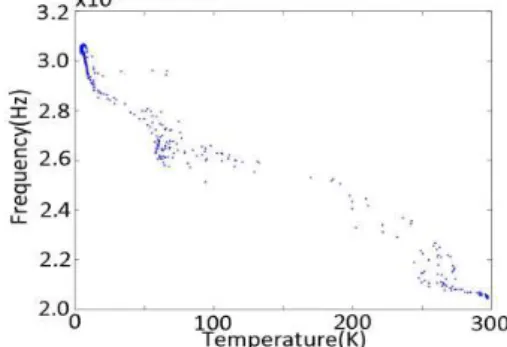
The waveform of the ring oscillator at 4.2 K is shown in Figure 3. The waveform has higher amplitude and faster transient time than those at room temperature. The oscillation frequency versus temperature relationship is shown in Figure 4. The frequency increases about 50% with the temperature decreasing from room temperature to 4.2 K.
Figure 3. the ring oscillator waveform at 4.2K Figure 4. frequency versus
temperature of the ring oscillator
3.1.3 The serializer
The eye diagrams of the serializer which was working at 5 Gbps are shown in Figure 5. The serializer at 77 K has wider eye opening, faster transient time, smaller jitter and larger amplitude than at room temperature. The mobility of the carrier increasing at low temperature causes the larger amplitude and faster transient time at low temperature. The smaller jitter is due to the smaller thermal noise at low temperature.
– 5 –
(a) room temperature (b) 77 K Figure 5. eye diagrams of the serializer
3.2 Optical fibers and connectors
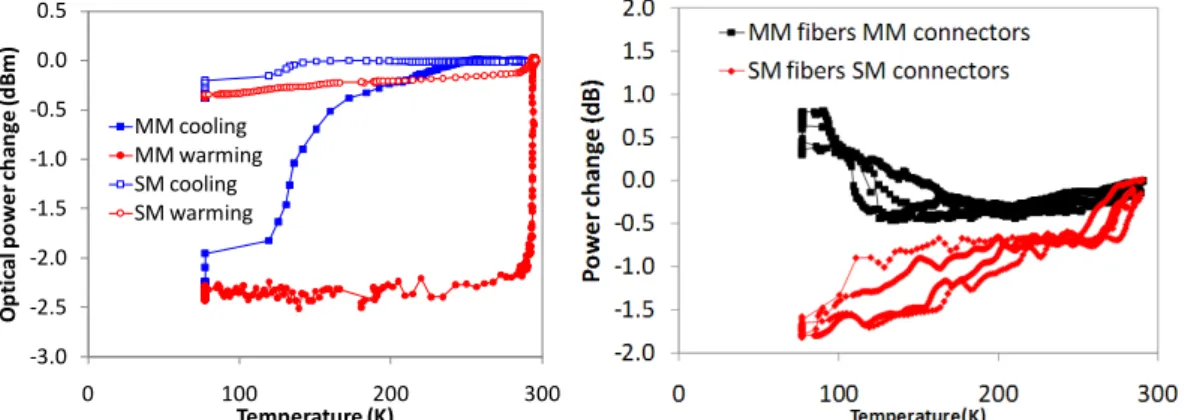
How the fiber optical power, which was transmitted by the fiber, changes with the temperature is shown in Figure 6. The cooling half cycle which is from room temperature to 77K and the warming half cycle which is from 77K to room temperature form one full temperature cycle. The two half cycles are not overlapped, because the DUT is much larger than the temperature sensor and the temperature of the sensor changes faster than the DUT.
The optical power, which was transmitted by the connectors linked with fibers, changed with temperatures is shown in Figure 7. As mentioned in section 2.2, we calculated the insertion loss at 77K excluding the performance of the fiber at 77K.
The optical power attenuation increases by 0.034 ± 0.004 ± 0.015 dB/m and 0.005 ± 0.004 ± 0.002 dB/m for multi mode and single mode fibers respectively. The insertion loss changes with temperature is 0.139 ± 0.011 ± 0.020 dB per connector and -0.284 ± 0.013 ± 0.014 dB per connector for multi mode and single mode connectors respectively. Each error expression consists of a system error and a measurement error. Given a usual optical power budget in a link system to be around 10 dB, the small power loss in the fibers and connectors at 77 K can be easily accommodated. -3.0 -2.5 -2.0 -1.5 -1.0 -0.5 0.0 0.5 0 100 200 300 O p ti ca l p o w e r ch a n g e ( d B m ) Temperature (K) MM cooling MM warming SM cooling SM warming
3.3 Laser diodes
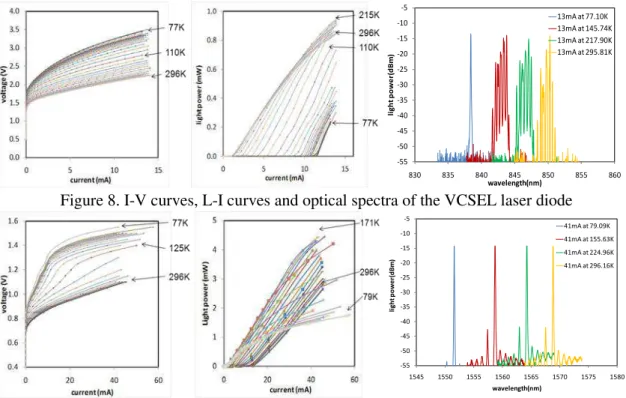
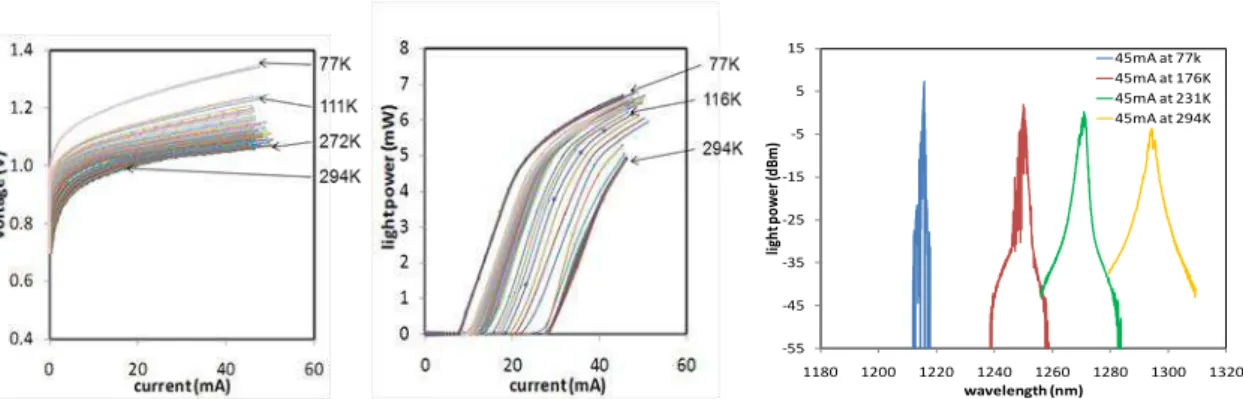
The characteristic I-V, L-I curves and optical spectra of three laser diodes are shown in Figures 8-10. The threshold voltages of all three laser diodes increase from room temperature to 77 K. The threshold currents of DFB and FP laser diode decrease when temperature decreases from room temperature to 77 K, whereas that of the VCSEL increases.
The threshold currents of these three lasers behave differently as temperature decreases, because of their different structures. The FP laser does not have Brag reflector, the threshold current is only affected by the quantum well gain. The quantum well gain increases as temperature decreases, so the threshold current decreases as temperature decreases. The DFB laser and VCSEL laser have Brag reflectors, the minimum threshold current depends on how the gain spectrum aligns with the lasing mode which is determined by the reflectors and cavity. If they are aligned optimally at room temperature, the threshold current increases as temperature decreases, like the VCSEL tested here. On the other hand, if they are aligned optimally at low temperature, the threshold current decreases as temperature decreases, like the DFB laser tested here.
The light slope efficiencies of VCSEL and FP almost do not change at different temperatures, but the light slope efficiency of DFB drops when the temperature is close to 77 K. In optical spectra, when the temperature changes from room temperature to 77 K, the center wavelength shifts toward the short wavelengths and the spectral width becomes narrow.
-55 -50 -45 -40 -35 -30 -25 -20 -15 -10 -5 830 835 840 845 850 855 860 li g h t p o w e r( d B m ) wavelength(nm) 13mA at 77.10K 13mA at 145.74K 13mA at 217.90K 13mA at 295.81K
Figure 8. I-V curves, L-I curves and optical spectra of the VCSEL laser diode
-55 -50 -45 -40 -35 -30 -25 -20 -15 -10 -5 1545 1550 1555 1560 1565 1570 1575 1580 li g h t p o w e r( d B m ) wavelength(nm) 41mA at 79.09K 41mA at 155.63K 41mA at 224.96K 41mA at 296.16K
Figure 9. I-V curves, L-I curves and optical spectra of the DFB laser diode
DFB and FP laser diodes are the possible candidates used in optical links for liquid argon time projection chamber. The VCSEL lasers from other venders may need to be tested. We also need to study the reliabilities on these laser diodes.
– 7 – -55 -45 -35 -25 -15 -5 5 15 1180 1200 1220 1240 1260 1280 1300 1320 li gh t p o w e r (d B m) wavelength (nm) 45mA at 77k 45mA at 176K 45mA at 231K 45mA at 294K
Figure 10. I-V curves, L-I curves and optical spectra of a FP laser diode
4. Conclusion
Ring oscillators, individual MOSFETs, and a 16:1 serializer fabricated in a commercial 0.25 μm SoS CMOS technology function from room temperature to 4.2 K, 15 K, and 77 K respectively. Optical fibers and optical connectors exhibit small attenuation changes and insertion loss changes respectively at 77 K. VCSEL, DFB and FB laser diodes lase throughout temperature range 300 K-77 K. The tests demonstrate the feasibility of optical links operating inside the liquid argon time projection chamber.
Acknowledgments
The authors would like to express deepest appreciation to Gary Evans, Jim Guenter and Bob Biard for resources and technical consultation. The authors would like to thank Pritha Khurana, Arthur Mantie, Mark Schuckert and Tengyun Chen who provided us the laser diodes. The authors would also like to thank Todd Huffman, Anthony Weidberg, Francois Vasey and Jan Troska for beneficial discussion.
References
[1] B. Szczerbinska, Long baseline neutrino experiment, 2010 Cracow Epiphany Conference on Physics in Underground Laboratories and its Connection with LHC, January 06-08 2010, Cracow, Poland.
[2] T. Liu et al, Total ionization dose effects and single-event effects studies of a 0.25 um silicon-on-sapphire CMOS technology, The 9th European Conference Radiation and Its Effects on Components and Systems (RADECS), Deauville, France, Sep. 2007.
[3] D. Gong et al., Development of A 16:1 serializer for data transmission at 5 Gbps, topical workshop on electronics in particle physics (TWEPP), Paris, France, Sep. 21-25, 2009, CERN 2009-006
[4] R. Galea et al, Charge transmission through liquid neon and helium surfaces, JINST 2:P04007 2007
[5] P. R.Gray et al, Analysis and Design of Analog Integrated Circuits,4th ed., John Wiley & Sons, 2001, pp. 47-48
[6] B. G. Streetman et al., Solid State Electronic Devices, 6th ed., Prentice-Hall, Inc, 2009, pp103-104, ISBN-978-81-203-3020-7