J. Chem. Phys. 141, 081103 (2014); https://doi.org/10.1063/1.4894399 141, 081103
© 2014 AIP Publishing LLC.
Communication: Slab thickness dependence
of the surface tension: Toward a criterion of
liquid sheets stability
Cite as: J. Chem. Phys. 141, 081103 (2014); https://doi.org/10.1063/1.4894399
Submitted: 14 May 2014 . Accepted: 20 August 2014 . Published Online: 29 August 2014 G. Filippini, E. Bourasseau, A. Ghoufi, F. Goujon, and P. Malfreyt
ARTICLES YOU MAY BE INTERESTED IN
Surface thermodynamics of planar, cylindrical, and spherical vapour-liquid interfaces of water
The Journal of Chemical Physics 142, 114701 (2015); https://doi.org/10.1063/1.4913371 Surface tension and long range corrections of cylindrical interfaces
The Journal of Chemical Physics 143, 234708 (2015); https://doi.org/10.1063/1.4937924 Influence of film thickness on the stability of free-standing Lennard-Jones fluid films
Communication: Slab thickness dependence of the surface tension:
Toward a criterion of liquid sheets stability
G. Filippini,1E. Bourasseau,1,a)A. Ghoufi,2F. Goujon,3and P. Malfreyt3 1CEA/DAM/DIF, F-91297 Arpajon Cedex, France
2IPR, UMR CNRS 6251, 263 avenue du Général Leclerc, 35042 Rennes, France 3ICCF, UMR CNRS 6296, BP 1048, F-63000 Clermont-Ferrand, France
(Received 14 May 2014; accepted 20 August 2014; published online 29 August 2014)
Microscopic Monte Carlo simulations of liquid sheets of copper and tin have been performed in or-der to study the dependence of the surface tension on the thickness of the sheet. It results that the surface tension is constant with the thickness as long as the sheet remains in one piece. When the sheet is getting thinner, holes start to appear, and the calculated surface tension rapidly decreases with thickness until the sheet becomes totally unstable and forms a cylinder. We assume here that this decrease is not due to a confinement effect as proposed by Werth et al. [Physica A 392, 2359 (2013)] on Lennard-Jones systems, but to the appearance of holes that reduces the energy cost of the surface modification. We also show in this work that a link can be established between the sta-bility of the sheet and the local fluctuations of the surface position, which directly depends on the value of the surface tension. Finally, we complete this study by investigating systems interacting through different forms of Lennard-Jones potentials to check if similar conclusions can be drawn.
© 2014 AIP Publishing LLC. [http://dx.doi.org/10.1063/1.4894399]
I. INTRODUCTION
The passing of a shock wave through a free surface of a metal can lead to the ejection of a great amount of particles. Experimental and theoretical studies have shown that the phe-nomenon of ejection is due to the presence of defects at the surface of the metal (see Ref.1and references therein). In the past decades, hydrodynamic simulations have allowed to un-derstand a great part of this phenomenon, and, for example, it has been shown that the amount of ejected material can be linked to the shape of the defects.2,3But if one is interested in predicting the characteristics of the ejected particles, micro-scopic scale seems to be the good scale to focus on. As an ex-ample, in case where the defects are parallel grooves, Durand
et al. have recently used Molecular Dynamic (MD)
simula-tions of large systems to show that the ejection process is as follows: (i) the ejected material forms sheets of liquid metal which go thinner and thinner; (ii) when sheets are sufficiently thin, holes appear and sheets break to form filaments; and (iii) those filaments stretch and finally break also to form spheri-cal clusters.1,4It appears that the breaking of the sheets starts when the thickness is about several nanometers. So, to study the last parts of this phenomenon, microscopic simulations seem to be the good tool, and those MD simulations made possible to get the entire size distribution of the final spherical aggregates. Nevertheless, the way the sheets begin to perfo-rate and then break has not been fully explained. Therefore, it could be useful to link the stability of the liquid sheets to the thermodynamic property which seems to be involved in the fragmentation: the surface tension. Indeed, to bring out such a link could be the first step of a model to account for the microscopic processes of breaking in hydrodynamic codes. a)emeric.bourasseau@cea.fr
In previous works, we have shown that methods routinely used to calculate surface tension of organic systems can be ap-plied to metallic liquids.5,6To do so, we used potentials based on the Embedded Atoms Model (EAM).7,8 We have shown that those force fields are well suited to simulate liquid metal-lic sheets and to produce accurate surface tensions. In this work, we propose to study liquid sheets of copper, tin, and Lennard-Jones (LJ) systems at the liquid-vapor equilibrium to extract a relationship between the surface tension and the stability of the sheets with respect to the thickness of the slab. The first aim of this work is to show how the surface tension depends on thickness, and then to eventually extract a stabil-ity criterion from the microscopic study of the sheets. From a methodological viewpoint, it is well-known that the calcula-tion of the surface tension of a two-phase system depends on a certain number of factors such as the finite size effects,9–12 the range of interactions,13–16 the truncation effects,13,17–19 the mechanical and thermodynamic definitions of the surface tension,18,20–22 and the long range corrections to the surface tension.15,17,18,22–24This paper also contributes to this area of research by establishing the role of the slab thickness on the calculation of the surface tension of various systems interact-ing through different potential models.
The results concerning the metallic systems are presented in this communication. We will also show that similar results can be observed concerning LJ systems. Methods, potentials, simulation details, and extended results are provided in the supplementary material.25
II. RESULTS AND DISCUSSIONS
We have performed simulations of sheets of Sn at 1000 and 1500 K and Cu at 1700 and 2000 K. To calculate the
081103-2 Filippiniet al. J. Chem. Phys. 141, 081103 (2014)
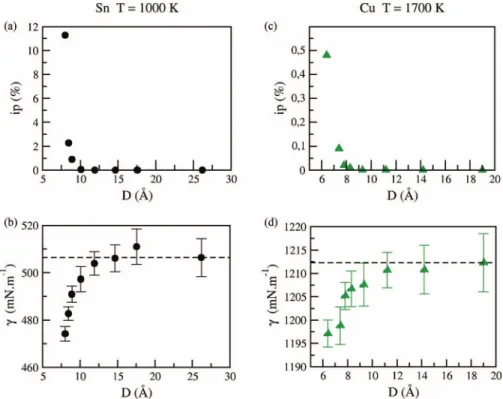
FIG. 1. (a) Perforation index and (b) surface tension for Sn at 1000 K as a function of the slab thickness. (c) Perforation index and (d) surface tension for Cu at 1700 K as a function of the slab thickness.
surface tension, we used the Test Area (TA) method.20 Simu-lations details, potential models, and the description of the TA method are given in the supplementary material.25We report in Fig.1(b)the calculated values of surface tension, obtained for tin at 1000 K as a function of the liquid slab thickness D. First, we notice that the surface tension is rather constant for
D going from 26 to 12 Å. The values of γ are in agreement
with that of 506 mN m−1in Ref.6. Then, for D varying from 12 to 8 Å, we observe a decrease of γ . Below 8 Å, liquid sheets become totally unstable and start to form cylinders; the calculated surface tensions fall down to nonreasonable values. This evolution of γ with D corroborates the results of Werth
et al. on LJ fluids.26They reported a decrease of the surface tension with the slab thickness which is linear with that of the density in the middle of the slab. This behavior was attributed to confinement effects. We propose here another interpreta-tion. In regard with the surface tension, Fig. 1(a)shows the perforation index ip (see the definition in the supplementary material25) as a function of the sheet thickness. We observe that the number of configurations that present holes first is constant above 10 Å, and then increases as D diminishes. For small D values, ip tends to 100% and the asymptotic value gives the minimum thickness of stability under which the pla-nar sheet inevitably forms a cylinder. The evolutions of ipand
γ with the slab thickness are symmetrical: when holes start to appear in the sheets, the surface tension begins to decrease. To explain this point, let us remind that the surface tension is a measurement of the energy needed to modify the area of the interface. Therefore, in our protocol, we consider that the area is equal to the area of a perfectly planar and intact surface in all the systems, whatever there are holes or not. Indeed, a hole has to be considered as an irregularity in the surface, exactly as a local fluctuation of the surface position. Of course, that is
justified since the sheet remains stable. With that in mind, it appears that for a given modification of the area, a perforated sheet will need less energy to be modified, and so will present a surface tension less important. And the more holes you ob-serve, the more the surface tension is reduced. Finally, when the sheet is so thin that it forms a cylinder, the TA method gives wrong results because the perturbation is inappropriate to calculate the surface tension in such a geometry. So to our mind, the surface tension γ remains constant in regard with thickness as far as the sheet is in one piece. As soon as holes appear, the calculated γ starts to decrease, until the sheet be-comes totally unstable and forms a cylinder.
As shown in Figs.1(c)and1(d), the same correspondence between γ and ipis found for copper at 1700 K. Nevertheless, the thickness under which holes are created is smaller than for tin. This can be explained by the fact that the value of γ is higher; it will be discussed later when we will analyse the fluctuations of the surface. We have also calculated the evolu-tion of γ and ipwith the sheet thickness for tin at 1500 K and copper at 2000 K.25The same behavior is observed. Basically, the higher the surface tension is, the smaller the thickness un-der which holes are created. Finally, the two metals at two temperatures exhibit the same behavior. So our point here is that we deduce from our calculations that the surface tension seems to be constant with the slab thickness until the appear-ance of holes, then γ starts to decrease.
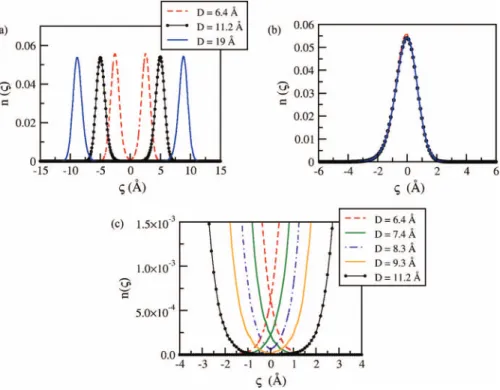
Fig. 2(a) shows, for copper at 1700 K, the distribu-tions of the local surface posidistribu-tions of the liquid sheet, ζ+ and ζ−(see the definitions in the supplementary material25), for both surfaces (positive and negative), for D = 6.4 Å, D = 11.2 Å, and D = 19 Å. First of all, we observe that for each value of D, distributions of positive and negative interfaces are symmetrical compared to zero, as it can be expected. As a
FIG. 2. Cu at 1700 K. (a) Distributions of the local surface positions for D= 6.4 Å, D = 11.2, Å and D = 19 Å. (b) Superimposition of ζ distribution for D= 6.4 Å and D = 11.2 Å on the distribution at D = 19 Å. (c) Focus on the distributions at ζ = 0 for D = 6.4, 7.4, 8.3, 9.3, and 11.2 Å.
consequence, this study could be done by focusing on only one interface. Then, Fig.2(b)represents the superimposition of the distributions of the positive interfaces for different val-ues of D. For convenience, distributions have been centered on zero. It appears that the three distributions are similar, what means that the fluctuations of the surface position do not de-pend on the sheet thickness. Moreover, we observe that the sheets have a non-negligible probability to present holes only when the spacial domains defined by the fluctuations of each surface (positive and negative) can intersect. Holes are effec-tively created when this intersection appends locally in the (x, y) plane. Fig. 2(c)focuses on these distributions around
ζ = 0 for D = 6.4, 7.4, 8.3, 9.3, and 11.2 Å. The
distribu-tions start to overlap under 9.3 Å. This is perfectly consistent with the thickness under which the perforation index begins to increase (see Figure1(c)). Distributions being symmetri-cal compared to zero, the intersection of distributions occurs at ζ+= ζ−= 0. So, to determine the thickness under which the sheets become unstable, one just has to simulate one sta-ble system and plot the ζ distribution for one interface. The value of the shift needed for the distribution to reach the axis
ζ = 0 indicates the value of the minimum thickness required
for stability. As an example, the distribution for D = 19 Å returns to zero near 5 Å (Fig.2(a)). The surfaces could thus intersect each other if the sheet thickness is reduced to 10 Å, that means for D= 9 Å. This value exactly corresponds to the one under which we have shown that holes start to appear. The same analysis can be made by studying the ζ distributions for tin.25As a consequence, this study shows that the limit of the sheet stability can be evaluated from the analysis of the fluc-tuations of the position of a single planar interface in a stable liquid-vapor system.
We have also plotted in Fig.3(a)the distributions of the surface positions of the positive surface of copper at 1700 and 2000 K and tin at 1000 and 1500 K for systems which thickness is about 18 Å. As we have shown that distributions do not depend on the thickness, we are allowed to compare the 4 distributions even if thicknesses are slightly different. We can note that the lower the surface tension is, the wider the distribution is, which corresponds to larger fluctuations of the position of the surface. It is also possible to plot the sur-face tension in regard with the width of the distributions at the half of their maximum (δ1/2) and we observe a clear tendency (see Fig.3(b)). In a last step, we can link the surface tension of the system with the thickness at which perforation is ob-served, Dp. As we could have expected, Fig.3(b)shows that there is an evident relationship between surface tension and sheets stability.
Finally, to conclude this part about metallic systems, we have underlined two important facts. The first one is that the surface tension appears to be constant with thickness until the liquid sheet becomes unstable, and then decreases as far as holes are appearing. The second one is that the study of the surface tension of a single interface is sufficient to predict for which thickness holes will begin to appear.
To check if this behavior is due to EAM based potentials, we have also studied the thickness dependence of the perfora-tion index and reduced surface tensions for different modified LJ potentials: truncated (LJT), truncated and shifted (LJTS), and truncated and corrected (LJT+ JC). To model the non-truncated LJ potential (LJT + JC), we used the method of Janecek27,28 that consists of including the long range correc-tions to the energy into the Metropolis scheme. The results are reported in the supplementary material.25 It appears that
081103-4 Filippiniet al. J. Chem. Phys. 141, 081103 (2014)
FIG. 3. (a) Distributions of the local interface for different systems as indi-cated in the legend. The different distributions have been centered on zero. (b) Semi-log γ= f(δ1/2) and γ= f(Dp) curves for the Cu, Sn, and LJ liquid-vapor interfaces.
the decrease of the surface tension begins with the increase of the perforation index independently of the potential used and also that the reduced D* value at which the perforation index starts to increase is similar to the different forms of LJ sys-tems. Then, we have reported the LJ results in Fig.3, and it can be seen that those results are in complete accordance with the results obtained for metals with EAM and MEAM poten-tials. In Fig.4, we have plotted the γ /γ∞for all the potentials used, where γ∞is the surface tension for the largest sheet.
FIG. 4. Ratio of the surface tension to the surface tension γ∞calculated at the largest D* for various types of potentials.
All the curves show the same behavior with however a thick-ness dependence that happens for larger slab thickthick-ness for the different LJ potentials. This is in line with the fact that the surface tensions of the LJ potentials are significantly smaller than those of the metals.
III. CONCLUSION
Monte Carlo atomistic simulations have been performed to investigate the dependence of the sheet thickness of the sur-face tension of liquid sheets of copper and tin. Interestingly, these simulations establish that the surface tension remains constant with the thickness as long as the sheet remains in one piece. When the sheet is getting thinner, holes appear leading to a significant decrease of the surface tension: the sheet becomes totally unstable by forming a cylinder. The be-havior of the surface tension with the slab thickness seems analogous to that observed for liquid drops with increasing the surface curvature.29–33Simulations of drops and cylinders are currently under progress to investigate this point.
We have also established a link between the stability of the sheet and the local fluctuations of the surface position, which directly depends on the value of the surface tension. This is a very important point because it is the first step to-ward a model to describe the breaking of the sheets in a hydro-dynamic simulation. The same conclusions have been drawn from simulations using different LJ potentials. We have also extracted from all these simulations a master curve represent-ing the reduced surface tension as a function of the slab thick-ness for different EAM, MEAM, and LJ models.
ACKNOWLEDGMENTS
Monte Carlo simulations of metallic systems have been performed with the Gibbs code from IFP-Energies Nou-velles, CNRS and Université Paris-Sud.34Code developments needed in this work have been done by the CEA under a col-laboration with the Gibbs code owners.
1O. Durand and L. Soulard,J. Appl. Phys.111, 044901 (2012). 2M. B. Zellner and W. T. Buttler,Appl. Phys. Lett.93, 114102 (2008). 3W. T. Buttler, D. M. Oro, D. L. Preston, K. O. Mikaelian, F. J. Cherne,
R. S. Hixson, F. G. Mariam, C. Morris, J. B. Stone, G. Terrones, and D. Tupa,J. Fluid Mech.703, 60 (2012).
4O. Durand and L. Soulard,J. Appl. Phys.114, 194902 (2013).
5E. Bourasseau, A. A. Homman, O. Durand, A. Ghoufi, and P. Malfreyt,Eur.
Phys. J. B86, 251 (2013).
6E. Bourasseau, G. Filippini, A. Ghoufi, and P. Malfreyt, “Calculation of the surface tension of pure tin from atomistic simulations of liquid-vapour systems,” Mol. Phys. (published online).
7X. W. Zhou, R. A. Johnson, and H. N. G. Wadley,Phys. Rev. B69, 144113 (2004).
8R. Ravelo and M. Baskes,Phys. Rev. Lett.79, 2482 (1997).
9P. Orea, J. Lopez-Lemus, and J. Alejandre,J. Chem. Phys.123, 114702 (2005).
10M. Gonzalez-Melchor, P. Orea, J. Lopez-Lemus, F. Bresme, and J. Alejan-dre,J. Chem. Phys.122, 094503 (2005).
11J. R. Errington and D. A. Kofke,J. Chem. Phys.127, 174709 (2007). 12F. Biscay, A. Ghoufi, F. Goujon, V. Lachet, and P. Malfreyt,J. Chem. Phys.
130, 184710 (2009).
13A. Trokhymchuk and J. Alejandre,J. Chem. Phys.111, 8510 (1999). 14J. Lopez-Lemus and J. Alejandre,Mol. Phys.100, 2983 (2002).
15F. Goujon, P. Malfreyt, A. Boutin, and A. H. Fuchs,J. Chem. Phys.116, 8106 (2002).
16P. Grosfils and J. F. Lutsko,J. Chem. Phys.130, 054703 (2009). 17F. Goujon, P. Malfreyt, J. M. Simon, A. Boutin, B. Rousseau, and A. H.
Fuchs,J. Chem. Phys.121, 12559 (2004).
18C. Ibergay, A. Ghoufi, F. Goujon, P. Ungerer, A. Boutin, B. Rousseau, and P. Malfreyt,Phys. Rev. E75, 051602 (2007).
19F. Goujon, C. Bonal, and P. Malfreyt,Mol. Simul.35, 538 (2009). 20G. J. Gloor, G. Jackson, F. J. Blas, and E. de Miguel,J. Chem. Phys.123,
134703 (2005).
21C. Vega and E. de Miguel,J. Chem. Phys.126, 154707 (2007).
22A. Ghoufi, F. Goujon, V. Lachet, and P. Malfreyt,Phys. Rev. E77, 031601 (2008).
23M. Guo and B. C. Y. Lu,J. Chem. Phys.106, 3688 (1997).
24V. K. Shen, R. D. Mountain, and J. R. Errington,J. Phys. Chem. B111, 6198 (2007).
25See supplementary material at http://dx.doi.org/10.1063/1.4894399 for a brief description of the methods and the potentials, and detailed results.
26S. Werth, S. Lishchuk, M. Horsh, and H. Hasse, Physica A392, 2359 (2013).
27J. Janecek, H. Krienke, and G. Schmeer,J. Phys. Chem. B 110, 6916 (2006).
28J. Janecek,J. Phys. Chem. B110, 6264 (2006).
29J. Vrabec, G. K. Kedia, G. Fuchs, and H. Hasse,Mol. Phys.104, 1509 (2006).
30J. G. Sampayo, A. Malijevsky, E. A. Muller, E. de Miguel, and G. Jackson,
J. Chem. Phys.132, 141101 (2010).
31B. Block, S. K. Das, M. Oettel, P. Virnau, and K. Binder,J. Chem. Phys.
133, 154702 (2010).
32A. Malijevsky and G. Jackson, J. Phys.: Condens. Matter 24, 464121 (2012).
33A.-A. Homman, E. Bourasseau, G. Stoltz, P. Malfreyt, L. Strafella, and A. Ghoufi,J. Chem. Phys.140, 034110 (2014).
34P. Ungerer, B. Tavitian, and A. Boutin, Applications of Molecular Simula-tion in the Oil and Gas Industry (IFP PublicaSimula-tions, 2005).