Publisher’s version / Version de l'éditeur:
Vous avez des questions? Nous pouvons vous aider. Pour communiquer directement avec un auteur, consultez la première page de la revue dans laquelle son article a été publié afin de trouver ses coordonnées. Si vous n’arrivez pas à les repérer, communiquez avec nous à [email protected].
Questions? Contact the NRC Publications Archive team at
[email protected]. If you wish to email the authors directly, please see the first page of the publication for their contact information.
https://publications-cnrc.canada.ca/fra/droits
L’accès à ce site Web et l’utilisation de son contenu sont assujettis aux conditions présentées dans le site
LISEZ CES CONDITIONS ATTENTIVEMENT AVANT D’UTILISER CE SITE WEB.
CCWI 2005 [Proceedings], pp. 1-6, 2005-09-01
READ THESE TERMS AND CONDITIONS CAREFULLY BEFORE USING THIS WEBSITE.
https://nrc-publications.canada.ca/eng/copyright
NRC Publications Archive Record / Notice des Archives des publications du CNRC : https://nrc-publications.canada.ca/eng/view/object/?id=8ba50ec0-4ddf-460d-b8f6-ec276c0728e4 https://publications-cnrc.canada.ca/fra/voir/objet/?id=8ba50ec0-4ddf-460d-b8f6-ec276c0728e4
NRC Publications Archive
Archives des publications du CNRC
This publication could be one of several versions: author’s original, accepted manuscript or the publisher’s version. / La version de cette publication peut être l’une des suivantes : la version prépublication de l’auteur, la version acceptée du manuscrit ou la version de l’éditeur.
Access and use of this website and the material on it are subject to the Terms and Conditions set forth at
An evidential reasoning approach to evaluate intrusion vulnerability in
distribution networks
An Evidential reasoning approach to evaluate
intrusion vulnerability in distribution networks
Sadiq, R.; Kleiner, Y.; Rajani, B.
NRCC-48344
A version of this document is published in / Une version de ce document se trouve dans :
CCWI 2005, Exeter, UK, Sept. 5-7, 2005, pp. 1-6
AN EVIDENTIAL REASONING APPROACH TO EVALUATE
INTRUSION VULNERABILITY IN DISTRIBUTION NETWORKS
Rehan Sadiq, Yehuda Kleiner, and Balvant Rajani
Institute for Research in Construction, National Research Council Canada (NRC) Ottawa, Ontario, K1A 0R6, Canada
[email protected]; [email protected]; [email protected]
Abstract
Intrusion, a primary mechanism of water quality failures in distribution networks, has accounted for approximately 15% of the total documented cases of waterborne illnesses in the Unites States in the last 30 years. Intrusion through water mains may occur during maintenance and repair events, through broken pipes and gaskets in the presence of contaminated soil and/or cross-connections. The potential of contamination through backflow or through leaky pipes increases whenever the water pressure in a pipe is very low or negative. This can occur when the pipe is de-pressurized for repair or when it is used to extinguish fire or during episodes of transient pressures.
Intrusion of contaminants into water distribution networks requires the simultaneous occurrence of three elements; a contamination source, a pathway and a driving force. Each of these elements provides an independent body of evidence (typically incomplete and non-specific) which can give hint(s) of the occurrence of intrusion into distribution networks. Inference using traditional Bayesian analysis involves assumptions in case of incomplete information and partial ignorance. Evidential reasoning, also called Dempster-Shafer (DS) theory, has proved very useful in this situation and has the ability to incorporate both aleatory and epistemic uncertainties in the inference mechanism. The bodies of evidence from contamination source(s), intrusion pathway(s) and driving force(s) are mapped over a ‘frame of discernment’ of vulnerability of intrusion. Subsequently the DS rule of combination is applied to make an inference on the occurrence of intrusion. The implementation of the evidential reasoning method to assess vulnerability to intrusion in distribution networks is demonstrated with the help of an example.
Keywords
Intrusion, water distribution networks, evidential reasoning, simplex plot, body of evidence and uncertainties
1 INTRODUCTION
Water quality in a distribution network can be described by specific microbiological, physico-chemical and aesthetic attributes of the water. These attributes are generally maintained in a desirable range, predefined by upper and/or lower limits. Each water quality attribute encompasses a number of water quality indicators. The overall acceptability of water quality for its intended use depends on the magnitude of these indicators and is often governed by regulations and guidelines. A water quality failure is defined as violation of regulations (or guidelines or self imposed limits) of one or more water quality indicators.
Five mechanisms namely intrusion, regrowth, breakthrough, internal corrosion / leaching and permeation can cause water quality failures. Of the five, four mechanisms (breakthrough is the exception), are directly affected by the pipe material type, size, structural condition, hydraulic / operational conditions and surface degradation. Environmental conditions such as the quality of the raw water, temperature and soil conditions around pipes can also have a direct or indirect impact on fluctuations of water quality in distribution networks [1].
The deterioration of pipe structural integrity can have a multi-faceted impact on water quality, especially in the domain of contaminant intrusion. Frequent pipe breaks increase the possibility of intrusion through the compromised sections in several ways. During repairs, intrusion can occur if flushing and local disinfection procedures are not appropriately followed. Furthermore, pipes are de-pressurized in the vicinity of a break during repair. This low pressure increases the potential of contaminant intrusion through unprotected cross connections. If the pipe has holes then de-pressurization will increase the likelihood of contaminant intrusion, which can be especially detrimental if the surrounding soil is contaminated or if there are leaky sewers nearby.
Data fusion refers to scientific aggregation of the information available in the form of observations and/or measurements. In some cases, different data sets give complementary information on various aspects of an event. Therefore, there is motivation to collect more information to increase the accuracy of the prediction. Information can also be redundant if it deals with the same aspect of the problem, but redundancy improves the reliability of
the prediction as one measurement / observation is confirmed by the other. Complementary and redundant information in data sets are the basis of data fusion applications in water quality modelling.
Quantitative aggregation of ‘incomplete’, ‘uncertain’ and ‘imprecise’ (vague) information / data warrants soft
computing methods, which are tolerant to imprecision, uncertainties and partial truths [2]. The term soft
computing comprises an array of heuristic techniques such as fuzzy logic, evidential reasoning, neural networks, and genetic algorithms, which essentially provide rational solutions for complex real-world problems [3]. The traditional soft computing method for data fusion is the Bayesian (subjectivist) probability approach, which cannot differentiate between aleatory and epistemic uncertainties and is unable to handle non-specific, ambiguous and conflicting information without making strong assumptions. These issues are addressed in this paper by the application of Dempster-Shafer (DS) theory or theory of evidence. The evidential reasoning based on DS theory is named after Dempster [4] and Shafer [5] and is a generalization of the Bayesian theory. The DS theory was found to be flexible enough to combine the rigor of probability theory with the flexibility of rule-based systems. The DS theory applications in civil and environmental engineering range from slope stability [6], environmental decision-making [7], seismic analysis [8], failure detection [9], construction management [10], water quality [11] to climate change [12]. Many more applications of DS theory can be seen in the detailed bibliography provided in [13]. This paper presents an approach that uses DS theory to quantify the vulnerability to contaminant intrusion in the distribution network.
The remaining paper is organised as follows: Section 2 provides an introduction to the mechanism of contaminant intrusion in distribution water mains. Section 3 presents a brief background and formulation of evidential reasoning. Section 4 demonstrates the approach using an example, and Section 5 concludes with a summary.
2 CONTAMINANT
INTRUSION
Intrusion, a primary mechanism of water quality failures in distribution networks, has accounted for approximately 15% of the total documented cases of waterborne illnesses in the Unites States in the last 30 years [1]. Intrusion of contaminants into the water distribution network can occur through pipes and storage tanks (animals, dust-carrying bacteria, infiltration). Table 1 lists routes of entry for pathogens in distribution networks and their associated levels of risk. The vulnerability to (or potential for) intrusion of contaminants in water mains can be evaluated based on the simultaneous occurrence of three elements, a contamination source, a pathway and a driving force [14].
Table1. Microbial risk in the water distribution network - routes of entries [1]
Route of entry Priority/risk level
Transitory contamination (intrusion) High
Water treatment breakthrough High
Water main repair/break (intrusion) High
Cross connection (intrusion) High
Uncovered storage facilities (intrusion) Medium-High
New main installations (intrusion) Medium
Covered storage facilities (intrusion) Medium
Growth/re-suspension Low *Purposeful contamination (intentional intrusion) No
* In the light of recent terrorist activities, the purposeful contamination might be rated as a high level risk.
2.1 Sources of contamination
Possible sources of contamination around water mains include sanitary sewers, septic tanks, contaminated soil and water and high-risk service connections (e.g., heat exchangers with secondary fluids, or car washes that use recycled water) [14]. Contamination sources can be either chemical (pesticides, petroleum products, fertilizers, solvents, detergents, pharmaceuticals, etc.) or microbiological (microbes, viruses, bacteria) [15]. In addition, the intrusion mechanism can also introduce contaminants such as plant debris and soil particles into the pipe, which can be contaminated due to animal feces, hydrocarbon spillage etc. The physical distance between contaminant sources and water mains plays a crucial role in avoiding an intrusion event.
2.2 Intrusion pathways
A water distribution network can never be completely watertight. Possible intrusion pathways include pipe cracks, holes, faulty gaskets and appurtenances as well as compromised tanks. Unprotected cross-connections can also serve as intrusion pathways. The environs of a pipe have a significant impact on its deterioration rate. Stray electrical currents, aggressive soils (soil moisture, chemical and microbiological content, electrical resistivity, aeration, redox potential), and the presence of more active metals (e.g., copper services), are all factors that accelerate corrosion of metallic pipes [16]. Severe internal corrosion may also impact the structural deterioration of metallic pipes through chemical properties (pH, dissolved oxygen, free chlorine residual, alkalinity), as well as temperature and microbiological activity of the distributed water. Non-metallic pipes (PVC, asbestos cement, PE) have different deterioration mechanisms, such as leaching of cement from the asbestos matrix in asbestos cement pipes, and the softening of PVC in the presence of hydrocarbons, etc. [17]. Water utilities use various criteria to assess the structural deterioration of pipes, among which breakage frequency (# of breaks/100km/yr) and corrosion pitting rates (mm/yr) are principal. Different mathematical and statistical techniques have been developed to model pipe deterioration. Comprehensive reviews of the published work related to physical and statistical models, respectively can be found in [18] and [19].
2.3 Driving force – pressure gradient
The driving force behind contaminant intrusion is invariably attributed to pressure gradients whereby the pressure inside the distribution pipe is lower than outside the pipe. This pressure gradient can occur during maintenance events, transient pressure events and cross connections to pressurised non-potable systems.
When pipes are de-pressurised for maintenance or breakage repair a pressure gradient can develop between the pipe and a saturated soil environment, as well as between the pipe and non-protected service connection. Extreme transient pressures in a water supply system can occur as a result of power failure in a pumping station, fast closure of valves, fire flows, pipe rupture, etc. These transients can cause negative pressures in pipes, which sometimes may be exacerbated by peculiar topographical conditions. Extreme transient pressures are more typical of long transmission mains and are less likely in the normal operation of an urban distribution networks. When the distribution system is cross-connected with a another pressurised non-potable system (e.g., car wash, landscape fertilizer pump) a pressure gradient may exist. If this connection is not adequately protected an intrusion can occur.
Intrusion is a complex phenomenon which depends on multiple factors. Generally, the data on these factors are incomplete, imprecise and uncertain, but evidential reasoning provides a meaningful way to fuse / aggregate this data to make inferences on the vulnerability of intrusion.
3 EVIDENTIAL
REASONING
The idea of integration of beliefs is commonly used in Bayesian inference, which implies that p(X) + p(¬X) = 1, i.e., the probability (belief) in a hypothesis X can be used to derive the probability (belief) in its complement [8]. The proposition p(¬X) reflects missing evidence (lack of knowledge) that is dealt with as equal non-informative
priors in Bayesian inference. The basic motivation behind DS theory [8], however, is the premise that ‘no
evidence’ is not equivalent to having the same degree of confidence in all hypotheses, as is the case for Bayesian approach. In the DS theory, the frame of discernment Θ is defined as a set of mutually exclusive and exhaustive hypotheses. The cardinality of the frame of discernment is equal to Θ and the power set of Θ will have 2Θ subsets in the domain. For example, if Θ = {X, ¬X}, its cardinality is 2 and its power set has 4 subsets, including φ (a null set), {X}, {¬X}, and {X, ¬X}. Suppose that p(X) = 0.6; the Bayesian approach will assign the remaining 0.4 probability to {¬X}, but the DS theory will assign this 0.4 probability to subset {X, ¬X}, which is an ignorance Θ.
The basic probability assignment (bpa) of a subset A, m(A) is the mass attached to it. The sum of the bpas of all subsets in given evidence is equal to ‘1’. In the example above, the proposition is that p(X) = 0.6. It follows that
m(X)=0.6 and m(X, ¬X) = 0.4. Continuing with subset A, let B be a subset of A, i.e., B ⊆ A. The belief for A denoted as bl(A) is defined as the sum of all the bpas of B, that is bel . The term bl(A) is the lower probability bound of A. If B is any subset in 2
∑ = ⊆A B B m A) ( ) ( ∑ = ≠ ∩Aφ B m A pl( )
Θ, then the upper probability bound, also called plausibility, is the
summation of bpas of the intersection B ∩ A ≠φ, and can be written as (B)
.
The DS rule of combination strictly emphasizes the agreement between multiple sources of evidence and ignores all the conflicting evidence through normalization. The DS rule of combination determines the joint m1-2 from
the aggregation of two bpas m1 and m2 for two subsets B and C obtained from two different sources, by following equation: φ ≠ − ∑ = ∩= − for A K C m B m A m B CA 1 ) ( ) ( ) ( 1 2 2 1 ; m1-2 (φ) = 0; and (1)
where is the degree of conflict in two sources of evidences. The denominator (1-K) in equation (1) is a normalization factor, which helps the aggregation by completely ignoring conflicting evidence. The body of evidence obtained from different sources can be adjusted using a credibility factor (α) that reflects the strength and/or reliability of a particular body of evidence [10].
) ( ) ( 2 1 B m C m K A B ∑ = = ∩ φ
(
)
− + ⋅ Θ = Θ ⋅ = − − − − α α α α α 1 ) ( ) ( ) ( ) ( 2 1 2 1 2 1 2 1 m m A m A m (2) The credibility factor is constrained by 0 ≤α≤ 1, where ‘0’ represents ‘completely non-credible evidence’, and ‘1’ represents ‘completely credible evidence’.4 ESTIMATING
VULNERABILITY TO INTRUSION
The frame of discernment of vulnerability to an intrusion can be described by a universal set Θ = {P, NP}, in which ‘P’ denotes ‘possible’ and NP denotes ‘not-possible’ intrusion. The power set of the vulnerability to intrusion consists of two singletons {P} and, {NP}, a universal set {P, NP} and the empty set {φ}. As described earlier, the vulnerability to intrusion of contaminants can be evaluated based on three bodies of evidence, a contamination source (e1), a pathway (e2) and a driving force (e3).
0.0 0.2 0.4 0.6 0.8 1.0 0 20 40 6 Separation distance (m) {P} {P, NP} {NP} 0 0.0 0.2 0.4 0.6 0.8 1.0 -20 0 20 40 Pressure (psi) {P} {P, NP} {NP} Evidence Value {P} {P, NP} {NP} α Contaminant source (m) 3 m1 (P) = 1 m1 (P/NP) = 0 m1 (NP) = 0 α1 = 0.6 Pathway (# bks/100km/year) 10§ m2 (P) = 0 m2 (P/NP) = 0 m2 (NP) = 1 α2 = 0.7 Pressure (psi) 0 m3 (P) = 0 m3 (P/NP) = 1 m3 (NP) = 0 α3 = 0.9
0 psi
3m
0.0 0.2 0.4 0.6 0.8 1.0 0 20 40 60Breakage rate (# of bk/100km/yr)
{NP} {P, NP} {P}
10
§Statistical information obtained based on pipe diameter, age, material and surrounding soil conditions
Figure 1. Estimating vulnerability of intrusion using evidential reasoning
In the following example the separation distance between a contaminant source and a water main is taken as surrogate for a source of contamination, the breakage rate (# of breaks/100km/yr) as a surrogate for an intrusion pathway and transient pressure (psi) for the driving force. The frames of discernment for all three bodies of evidence are mapped over the frame of discernment of intrusion vulnerability. The translation of bodies of evidence into basic probability assignments m1, m2 and m3 is shown in Figure 1. It refers to a scenario where a
rate of a particular type of water main is 10 breaks/100km/year and hydraulic simulations suggest a possibility of pressure drop to 0 psi at the respective node. After bpas m1, m2 and m3, are estimated they are adjusted by
credibility factors (equation 2). For example, the credibility factor for contaminant source α1 is 0.6, therefore the
adjusted basic probability assignment is mα1 (P) = 0.6, mα1 (P, NP) = 0.4, and mα1 (NP) = 0.
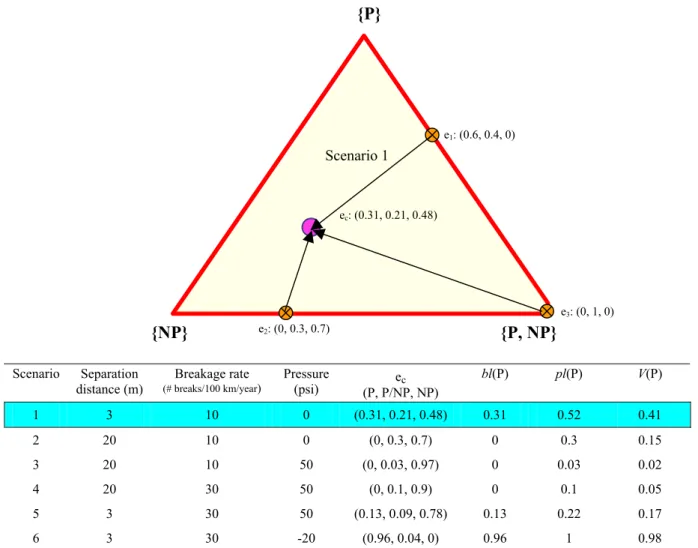
The three bodies of evidence are combined using the DS rule of combination as described above. The simplex
plot is a tri-linear diagram, which is used to illustrate the three dimensions of intrusion vulnerability, i.e., {P},
{P, NP}, and {NP} as shown in Figure 2. The vertex {P, NP} represents the ignorance; therefore any point closer to this vertex represents higher level of ignorance and ambiguity. Points e1, e2 and e3 represent three pieces
of information which are fused together using the DS rule of combination to obtain combined evidence (ec) of
(0.31, 0.21, 0.48) as shown in Figure 2. Under given conditions an alternative interpretations that the belief of intrusion vulnerability bel(P) is 31%, the corresponding plausibility pl(P) is 52%, and that there is 48% belief
bel(NP) of no intrusion vulnerability. The belief interval [0.31 0.52] represents the lower and upper values of
probabilities. The belief interval can be converted into a crisp ‘expected utility’ V(P) of vulnerability to intrusion. For example, this can be done by assigning a set of weights 1, 0.5, and 0 to {P}, {P, NP}, {NP}, respectively, which will yield an expected utility value V(P) of 0.41.
{NP}
{P, NP}
{P}
e1: (0.6, 0.4, 0) ec: (0.31, 0.21, 0.48) Scenario 1 e3: (0, 1, 0) e2: (0, 0.3, 0.7) Scenario Separation distance (m) Breakage rate (# breaks/100 km/year) Pressure (psi) (P, P/NP, NP) ec bl(P) pl(P) V(P) 1 3 10 0 (0.31, 0.21, 0.48) 0.31 0.52 0.41 2 20 10 0 (0, 0.3, 0.7) 0 0.3 0.15 3 20 10 50 (0, 0.03, 0.97) 0 0.03 0.02 4 20 30 50 (0, 0.1, 0.9) 0 0.1 0.05 5 3 30 50 (0.13, 0.09, 0.78) 0.13 0.22 0.17 6 3 30 -20 (0.96, 0.04, 0) 0.96 1 0.98Figure 2. Simplex plot (tri-linear diagram) representing individual and combined body of evidences
Five additional scenarios for the example in Fig. 1 are identified in the table at the bottom of Figure 2. The pressure and intrusion pathways in scenario 2 remain unchanged from those in scenario 1, but the contaminant source is assumed to be at a distance of 20m rather than 3m from the water main. The belief is now reduced to zero but the plausibility is 0.3, which is due to low pressure at that node. However if transient pressure is increased to 50 psi (normal operating pressure for scenario 3), the belief remains zero but the belief interval is reduced to [0 0.03]. In scenario 4, where the breakage rate is increased to very high rate of 30 breaks/100 km/year, belief remains the same (at zero) but plausibility increases to 0.1, making it a more uncertain event. The expected vulnerability increases to 0.17 from 0.05 for scenario 5 where the sewer is very near (at 3m) the water
main, and the breakage rate is very high. Scenario 6 corresponds to an extreme case (negative pressures, contaminant source very near and very high breakage rate) in which all bodies of evidence hint to a ‘certain’ intrusion and the ignorance is almost negligible.
5 SUMMARY
The intrusion of contaminants into water distribution networks requires the simultaneous occurrence of three elements, a contamination source, a pathway and a driving force. Each of these elements provides an independent body of evidence of the vulnerability of ‘intrusion’ in the distribution network. Evidential reasoning, also called Dempster-Shafer (DS) theory, has proved effective in dealing with this type of situation. Bodies of evidence representing contamination source(s), intrusion pathway(s) and driving force(s) are mapped over a frame of discernment of intrusion vulnerability. Subsequently the DS rule of combination is applied to make an inference on the occurrence of intrusion. The implementation of this evidential reasoning method to assess vulnerability to intrusion in distribution network is described with the help of a simplex plot where vertices of an equilateral triangle represent potential for intrusion, not-intrusion and ignorance. Six scenarios were generated to demonstrate the application of the proposed method under varying conditions.
Acknowledgements
This paper presents results of a preliminary investigation of an on-going research project, which is co-sponsored by the American Water Works Association Research Foundation (AwwaRF) and National Research Council of Canada (NRC).
References
[1] Kirmeyer, G.J., Friedman, M., Martel, K., and Howie, D., Pathogen Intrusion into Distribution System, AwwaRF, Denver, CO, USA, 2001
[2] Zadeh, L.A, Review of books: A mathematical theory of evidence, The AI Magazine, 1984, pp. 81-83 [3] Bonissone, P.P., “Soft computing: the convergence of emerging reasoning technologies”, Soft Computing,
1997, pp. 6-18
[4] Dempster, A., “Upper and lower probabilities induced by a multi-valued mapping”, The Annals of Statistics, 1967, pp. 325-339
[5] Shafer, G., A mathematical theory of evidence, Princeton University Press, Princeton, NJ, 1976
[6] Binaghi, E. Luzi, L., Madella, P., Pergalani, F., and Rampini, A., “Slope instability zonation: a comparison between certainty factor and fuzzy Dempster–Shafer approaches”, Natural Hazards, 1998, pp. 77–97 [7] Attoh-Okine, N.O., and Gibbons, J., “Use of belief function in brownfield infrastructure redevelopment
decision making”, ASCE Journal of Urban Planning and Development, 2001, pp. 126-143
[8] Alim, S., “Application of Dempster-Shafer theory for interpretation of seismic parameters”, ASCE Journal
of Structural Engineering, 1988, pp. 2070-2084
[9] Tanaka, K. and Klir, G.J., “Design condition for incorporating human judgment into monitoring systems”,
Reliability Engineering and System Safety, 1999, pp. 251-258
[10] Sönmez, M., Holt, G.D., Yang, J.B. and Graham, G., “Applying evidential reasoning to prequalifying construction contractors”, ASCE Journal of Management in Engineering, 2002, pp. 111-119
[11] Sadiq, R., and Rodriguez, M.J. “Predicting water quality in the distribution system using evidential theory”,
Chemosphere, 2005, pp. 177-188
[12] Luo, W.B., and Caselton, B., “Using Dempster-Shafer theory to represent climate change uncertainties”,
Journal of Environmental Management, 1997, pp. 73-93
[13] Sentz, K. and Ferson, S., Combination of evidence in Dempster-Shafer theory, SAND 2002-0835, 2002 [14] Lindeley, T.R., and Buchberger, S.G., “Assessing intrusion susceptibility in distribution systems”, Journal
of the American Water Works Association, 2002, pp. 66-79
[15] Karim, M., Abbaszadegan, M., and LeChevallier, M.W., “Potential for pathogen intrusion”, Journal of the
American Water Works Association, 2003, pp. 134-146
[16] Sadiq, R., Rajani, B. and Kleiner, Y., “A fuzzy based method of soil corrosivity evaluation for predicting water main deterioration”, ASCE Journal of Infrastructure Systems, 2004, pp. 149-156
[17] US Environmental Protection Agency (US EPA) white papers, http://www.epa.gov/safewater/tcr/tcr.html, 2004
[18] Rajani B., and Kleiner Y., “Comprehensive review of structural deterioration of water mains: Physical based models”, Urban Water, 2001, pp. 51-164
[19] Kleiner Y., and Rajani B., “Comprehensive review of structural deterioration of water mains: statistical models”, Urban Water, 2001, pp. 131-150