Publisher’s version / Version de l'éditeur:
Chemistry of Materials, 26, 16, pp. 4796-4804, 2014-06-24
READ THESE TERMS AND CONDITIONS CAREFULLY BEFORE USING THIS WEBSITE.
https://nrc-publications.canada.ca/eng/copyright
Vous avez des questions? Nous pouvons vous aider. Pour communiquer directement avec un auteur, consultez la première page de la revue dans laquelle son article a été publié afin de trouver ses coordonnées. Si vous n’arrivez pas à les repérer, communiquez avec nous à [email protected].
Questions? Contact the NRC Publications Archive team at
[email protected]. If you wish to email the authors directly, please see the first page of the publication for their contact information.
NRC Publications Archive
Archives des publications du CNRC
This publication could be one of several versions: author’s original, accepted manuscript or the publisher’s version. / La version de cette publication peut être l’une des suivantes : la version prépublication de l’auteur, la version acceptée du manuscrit ou la version de l’éditeur.
For the publisher’s version, please access the DOI link below./ Pour consulter la version de l’éditeur, utilisez le lien DOI ci-dessous.
https://doi.org/10.1021/cm501881a
Access and use of this website and the material on it are subject to the Terms and Conditions set forth at
Nickel/iron oxide nanocrystals with a nonequilibrium phase:
Controlling size, shape, and composition
Bau, Jeremy A.; Li, Peng; Marenco, Armando J.; Trudel, Simon; Olsen, Brian
C.; Luber, Erik J.; Buriak, Jillian M.
https://publications-cnrc.canada.ca/fra/droits
L’accès à ce site Web et l’utilisation de son contenu sont assujettis aux conditions présentées dans le site LISEZ CES CONDITIONS ATTENTIVEMENT AVANT D’UTILISER CE SITE WEB.
NRC Publications Record / Notice d'Archives des publications de CNRC:
https://nrc-publications.canada.ca/eng/view/object/?id=1ad07b5e-194b-42c9-919b-bf98553736f7 https://publications-cnrc.canada.ca/fra/voir/objet/?id=1ad07b5e-194b-42c9-919b-bf98553736f7
Nickel/Iron Oxide Nanocrystals with a Nonequilibrium Phase:
Controlling Size, Shape, and Composition
Jeremy A. Bau,
†,‡Peng Li,
†Armando J. Marenco,
§Simon Trudel,
§Brian C. Olsen,
†,‡Erik J. Luber,*
,†,‡and Jillian M. Buriak*
,†,‡‡
Department of Chemistry, University of Alberta, Edmonton, Alberta T6G 2G2, Canada
†
National Institute for Nanotechnology (NINT), National Research Council, 11421 Saskatchewan Drive, Edmonton, Alberta T6G 2M9, Canada
§
Department of Chemistry, University of Calgary, 2500 University Drive NW, Calgary, Alberta T2N 1N4, Canada
*
S Supporting InformationABSTRACT: Mixed nickel iron oxide nanomaterials have great potential for use in fields as wide-ranging as optics, water oxidation catalysis, and biomedical applications; large-scale deployment for any of these applications is possible due to the abundance of iron and nickel in the earth’s crust. Here, we describe single-crystal mixed nickel iron oxide nanoparticles with a rocksalt crystal structure and an iron content greater than >10 at%. The nanoparticles were synthesized via thermal decomposition of nickel and iron oleates, yielding monodisperse nanoparticles <12 nm in size. A range of compositions were accessible, ranging from iron-poor to iron-rich. Despite the predicted poor solubility of iron in the NiO lattice, as based upon the equilibrium phase diagram, and the general tendency
of pure FexO to oxidize, the single-crystal nanoparticles are nonetheless kinetically persistent even at elevated temperatures (200
°C). Furthermore, by controlling the drying conditions and decomposition time of the oleate precursors as well as the initial ratio of nickel to iron in the precursor oleate mixture a variety of nanoparticle shapes−namely stars, cubes, and spheres−were formed. This control of shape and composition affords tunability of physical properties, exemplified by magnetic properties herein.
■
INTRODUCTIONMetal oxides and mixed metal oxides (MMOs) are of significant interest as electrode materials in a broad range of device applications, including Li-ion batteries,1−3 electro-chemical capacitors,2,4,5 fuel cells,6,7 gas sensors,8,9 thin film
transistors10−12 and electrochemical water oxidation
cata-lysts.13−16 Many synthetic methods have been reported for
the production of high-purity MMOs, including the mechanical mixing of metal precursors,17−19 spray pyrolysis,20,21 sol−gel decomposition,11,22−24hydrothermal processing,24−27 polymer-based processes,28,29and solution-phase thermal decomposition of metal−organic precursors.30,31 However, the use and synthesis of MMOs is complicated by the presence of different metal species. Unlike monometallic metal oxides, it can be challenging to control the size and shapes of MMO particles using these methods since it is also necessary to control the homogeneity, composition, and phase purity of the resulting crystalline materials.32
The ability to tune the chemical composition of solid solution MMOs is of particular interest as it enables the properties of the material to be tailored for a specific application. This principle has been successfully used to improve the activity and selectivity of catalysts,25,33−35 change
the sensitivity of gas sensors,9,36and modify the electronic and optical properties of semiconductor materials.37−40 These studies demonstrate that it is possible to develop novel MMOs with comparable or even improved activities over more traditionally used materials like monometallic oxides and noble metals. Therefore, in order to exploit the potential of MMOs, it is important that synthetic methods are developed that allow fine-tuning of MMO particle shape and composition. In this work, we explore MMO nanoparticles composed of nickel and iron synthesized by thermal decomposition of metal oleates in solution. In previously reported syntheses of mixed nickel−iron oxide nanoparticles, the two commonly reported phases are spinel nickel ferrite (NiFe2O4)41,42 and rocksalt
bunsenite (NiO) with iron in solid solution.43−47Although the equilibrium phase diagram of the Ni−Fe−O system predicts negligible solubility of Fe in the rocksalt NiO phase below 800 °C,44,48 synthetic preparation of phase-pure 10 at% Fe-doped NiO has been previously reported.47Here, we present mixed metal nickel−iron oxide nanoparticles possessing a rocksalt
Received: May 23, 2014 Revised: June 24, 2014 Published: June 26, 2014
crystal structure, synthesized via solution-phase decomposition of metal oleate precursors. The nanoparticle products maintain a single-crystal rocksalt structure over almost the entire range of nickel:iron ratios. Several synthetic variables, such as the ratio of nickel to iron in the oleate precursor, solution decomposition time, and the precursor drying time49are used to modify the nanoparticle composition, size, and shape. The magnetic properties of these nanoparticles are investigated, and it is found that they show size-dependent superparamagnetic properties. Lastly, thermal annealing of these metastable nanoparticles demonstrates that they are kinetically stable at elevated temperatures.
■
EXPERIMENTAL SECTIONChemicals.All chemicals were used as received. Anhydrous FeCl3
(98%) was obtained from Strem Chemicals and stored in a N2
glovebox. NiCl2•6H2O was from ACP Chemicals and sodium oleate
(>97%) from Tokyo Chemical Industry. Anhydrous ethanol was obtained from Commercial Alcohols, hexanes and isopropyl alcohol were from Fisher Chemicals, while oleic acid (technical grade, 90%) and 1-octadecene (technical grade, 90%) were from Sigma-Aldrich.
Preparation of Metal Oleate Precursors. The procedure was based on the previously reported synthesis of ferrite nanoparticles from metal oleates.30,50In a typical reaction, 2 mmol of NiCl
2•6H2O,
4 mmol of FeCl3, and 16 mmol of sodium oleate were dissolved in 10
mL of deionized water, 10 mL of ethanol, and 20 mL of hexane in a 100 mL round-bottom flask. The sample was refluxed at 60 °C for 4 h. After the sample had been cooled to room temperature, the red-brown organic layer containing the metal oleate complex was separated and washed twice with Milli-Q deionized water in a separatory funnel and centrifuged at 3000g.51The red-brown liquid was separated and dried in an oven heated to 100 °C under atmospheric pressure for 1 h to yield a viscous product of metal oleates.49For reactions with varied initial compositions of nickel to iron, the total amount of metal was kept at 6 mmol, while 2 mmol of sodium oleate was added for every mmol of nickel and 3 mmol for every mmol of iron, respectively.
Nanoparticle Synthesis. The entirety of the preformed metal oleate complex (∼4.8 g), as described above, was used as-is and was mixed with 20 mL of 1-octadecene and 0.951 mL of oleic acid in a 250 mL three-neck flask to form a homogeneous solution. The flask was evacuated three times using a vacuum Schlenk line and refilled with Ar. The reaction solution was heated to 110 °C and again evacuated three times via the same method. After evacuation, the solution was heated under argon at a heat ramp rate of 3 °C/min to 305 °C and held at this temperature for 20 min before cooling to room temperature. To isolate the nanoparticles, 40 mL of isopropyl alcohol was added. This mixture was then centrifuged at 3000g for 10 min. The pellet was resuspended in 20 mL of hexane, and an equal part of isopropyl alcohol was then added before being centrifuged again, in the same manner. Washing was repeated once more. The final pellet was then resuspended in 20 mL of hexane to form a dark brown solution to yield a concentrated solution of ∼15 mg/mL. For yield calculations, thermogravimetric analysis was performed by the University of Alberta Department of Chemistry Analytical and Instrumentation Lab in order to determine the metal oxide portion of the final nanoparticle product. Electron Microscopy.Hexane-diluted nanoparticle solutions of 1 mg/mL were dropped and dried onto 200 mesh copper transmission electron microscope (TEM) grids. Imaging and electron diffraction were performed on a JEOL JEM-2100 TEM with an accelerating voltage of 200 kV. Selected area electron diffraction (SAED) was acquired on the same system. The distributions of particle area were determined from the TEM micrographs using a thresholding algorithm implemented in Gwyddion.52From this, the particle sizes are taken as
the square root of particle area.
Further examination of the nanoparticles (bright field images and electron energy loss spectroscopy (EELS)) were acquired on a JEOL JEM-2200FS TEM equipped with a Schottky field-emission gun and
an in-column energy filter (Omega filter) and operated at 200 kV accelerating voltage.
Atomic-resolution high-angle annular dark-field scanning TEM (HAADF-STEM) images and energy dispersive X-ray spectroscopy mapping (EDX) were performed on a JEOL JEM-ARM200F spherical aberration corrected STEM/TEM, equipped with a cold-field-emission gun (c-FEG) and operated at an accelerating voltage of 200 kV.
EDX characterization of nanoparticle compositions was performed on a JEOL JSM-6010LA InTouchScope equipped with a Bruker Silicon Drift Detector. Nanoparticle samples were drop-cast on Si wafers. Each reported composition is the average of three different measurements in separate locations.
Fourier Transform Infrared Spectroscopy (FTIR). Scans were collected using a Nicolet Nexus 760 spectrometer with a DTGS detector and a N2-purged sample chamber (64 scans, 4 cm−1
resolution). Metal oleate samples were drop-cast on Si wafers (∼10 Ω·cm) for data collection in transmission mode.
X-ray Diffraction Analysis. X-ray diffraction (XRD) was performed using a Bruker D8 Discover with a Cu Kα beam (40 kV, 40 mA, λ = 1.5406 Å) equipped with a 2D detector. XRD spectra were collected from the 2D ring patterns by radial integration. Samples were prepared by filling polyethylene terephthalate (PET) capillary tubes with concentrated stock solutions of nanoparticles suspended in hexane. XRD spectra of these samples were then collected in transmission mode. Special care was taken to ensure the samples were correctly aligned to achieve accurate peak positions. Calibration of peak positions was done using a capillary tube filled with a LaB6
powder. Samples with a planar geometry were prepared by drop-casting nanoparticle solution on silicon (100) substrates. Scans were performed in a grazing incidence configuration with an incident angle of ω = 5°. Calibration of peaks was performed with a LaB6standard
sample. Instrument line broadening was determined to be 0.28°. X-ray Photoelectron Spectroscopy. X-ray photoelectron spec-troscopy (XPS) spectra were collected by Kratos Ultra spectrometer with a base pressure less than 4 × 10⁻⁸Pa. A monochromatic Al Kα
source (hν = 1486.6 eV) was run at a power of 168 W. The analysis spot was 300 × 700 μm, and the analyzer resolution was 0.80 eV for Au 4f peaks. The survey scans were collected for binding energies spanning 1100 to 0 eV at a constant energy of 160 eV and high resolution spectra were collected at a pass-energy of 20 eV. Sample charging was compensated by electron flooding. The binding energy (BE) scale was calibrated by assigning C 1s peak from surface contamination at 284.8 eV.
Magnetometry. Superconducting quantum interference device (SQUID) magnetometry measurements were carried out using a Quantum Design MPMS XL-7S system. Dried powdered samples were loaded into a gelatin capsule, which was sealed with Kapton tape and inserted in a clear diamagnetic plastic straw. Zero field-cooled (ZFC) and field-cooled (FC) measurements were carried out by cooling the samples from 300 to 1.9 K in the absence (ZFC) or presence (FC, μ0H = 10 mT) of an applied magnetic field. A magnetic
field strength of 10 mT was applied at 1.9 K, and the magnetization of the sample was measured upon warming from 1.9 to 300 K. Isothermal magnetization as a function of field strength measurements were also carried out at temperatures of 1.9 and 300 K by cycling the applied magnetic field strength between 7 and −7 T.
■
RESULTS AND DISCUSSIONAlthough a wide variety of metal−organic precursors will decompose to yield an assortment of metal oxide nanoparticle products,53−56 metal oleate precursors present several
advan-tages that include high reaction yields and ease of syn-thesis.30,50,57 In this work, metal oleate precursors were prepared by refluxing a mixture of NiCl2•6H2O and FeCl3
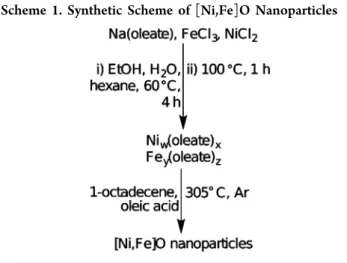
with sodium oleate (Scheme 1).30 Throughout this work, a ratio of X:Y Ni:Fe oleate precursor refers to a sample prepared from a X:Y ratio (by metal molarity) of NiCl2•6H2O to FeCl3.
The metal oleate precursors were then heated to 305 °C for a
Chemistry of Materials Article
dx.doi.org/10.1021/cm501881a | Chem. Mater. 2014, 26, 4796−4804
given period of time, denoted as the decomposition time (td),
in 1-octadecene under argon to produce nanoparticle products. Figure 1 shows electron microscopy characterization of nanoparticles formed from the decomposition of 33:67 Ni:Fe
oleate precursor in 1-octadecene at 305 °C (td= 20 min). From
these micrographs we see that the nanoparticles have a cubic-like shape with rounded edges and vertices (herein referred to as nanocubes). Moreover, the HAADF-STEM micrograph of these nanocubes (Figure 1a) reveals that they are single-crystal nanoparticles with sizes on the order of 8 nm. High-resolution EDX mapping of the nanoparticles (Figures 1b-c) reveals that both nickel and iron are uniformly distributed throughout the nanoparticles, with all of the observed nanoparticles having the same composition. However, the final composition of metal in the nanoparticles varied from that of the nickel and iron precursor ratio; while the starting molar ratio of nickel to iron
in the oleate precursor was 33:67, the final molar ratio of metals in the nanoparticles was ∼50:50, as determined by EDX (Supporting Information, Table S1). Modified synthetic reactions, where nickel and iron oleate complexes were prepared individually and then subsequently combined, yielded nanoparticle products that were identical in appearance and crystal structure, as determined by TEM and XRD (Supporting Information, Figure S1). Subtle differences in the carbonyl stretching region of the FTIR spectra, ν(CO), of individually prepared iron and nickel oleate complex precursors, and the mixed Fe/Ni complex mixture, suggest that the precursor identities may differ, but the structures of these metal carboxylate complexes have no effect, however, on the resulting nanoparticle products (Supporting Information, Figure S2). The final yield of metal oxide nanoparticle product was determined to be ∼55% based on the remaining metal oxide mass after calcination.
Shown in Figure 2a (right) is the electron diffraction pattern of nanoparticles synthesized with a precursor ratio of 33:67 and
decomposition time of 20 min. All of the observed Debye rings can be matched to that of a rocksalt crystal latttice, similar to that found in phase pure NiO and FexO.58,59Furthermore, the
XRD spectrum of these nanocubes displays a shift in peak positions relative to pure NiO and FexO such that the peak
positions of the nanocubes lie between the peak positions of pure NiO and FexO. Using the (200) peak position, the lattice
parameter of these nanocubes is calculated to be 4.22 Å, which is roughly halfway between pure FexO (4.29 Å) and
Scheme 1. Synthetic Scheme of [Ni,Fe]O Nanoparticles
Figure 1. (a) High-resolution HAADF-STEM micrograph of nano-particles synthesized with a nickel to iron precursor ratio of 33:67 and decomposition time of 20 min (inset: FFT diffractogram). (b,c) EDX maps of (b) nickel and (c) iron of nanoparticles produced via the same
synthesis. Figure 2. (a) Electron diffraction pattern of [Ni,Fe]O nanocubes
(right) and simulated electron diffraction pattern of a rocksalt crystal structure (left). (b) XRD spectrum of nanocubes with spectra of bulk NiO and FexO overlaid.
NiO (4.18 Å). This shift in lattice parameter is characteristic of substitutional solid-solutions, where the lattice parameter must change in order to accommodate for strain that arises due to the differing atomic sizes of the constituent atoms as well as attractive and repulsive forces between the guest and host metal atoms.60,61 From the HRTEM, EDX mapping, X-ray and electron diffraction data, we propose that the products of the decomposition reaction are single-crystal nanoparticles consist-ing of a substitutional solid-solution of nickel and iron in rocksalt crystal structure. As short hand, we refer to this phase as [Ni,Fe]O, a nonequilibrium phase under ambient con-ditions.44,48
The valence states of iron within these nanoparticles (33:67 Ni:Fe precursor ratio, 20 min decomposition time) were studied using EELS and XPS, as shown in Figure 3. The shapes and relative areas of the iron L2,3 peaks acquired using EELS
(Figure 3a) were found to be consistent with those reported for a Fe2+-containing oxide.62,63
Further characterization of the iron valence states was performed using XPS (Figure 3b). The Fe
2p3/2 spectrum of the nanocubes displayed a major peak at
710.6 eV, which is consistent with the 710.5 eV Fe 2p3/2peak
position of FexO. 64
Moreover there are no clearly distinguish-able satellite peaks, which are characteristic features of pure (α,γ)-Fe2O3and Fe3O4.64However, it is well-known that it is
difficult to distinguish iron oxides species from the core-level XPS spectra,64 since the peak positions of Fe
xO, Fe3O4, and
(α,γ)-Fe2O3are all within a 0.5 eV range. Furthermore, there is
a significant amount of Ni substitution within the FexO lattice,
which can cause a shift in the peak position. Looking at the Ni 2p XPS spectrum in Figure 3c, we see that the Ni 2p peak positions correspond well with literature values for bivalent nickel oxide.65,66 From these XPS and EELS data we can conclude that the majority of the Fe and Ni is in a bivalent state; due to the ambiguity of XPS of these materials, however, the presence of Fe3+cannot be ruled out.
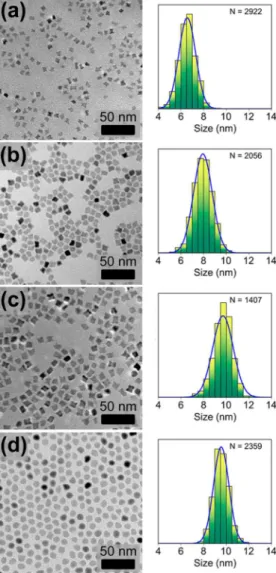
The shape and composition of the nanocubes were found to be tunable via modifications of the synthetic procedure. For example, when the decomposition time of the 33:67 Ni:Fe metal oleate precursor was varied within the range of 15 to 30 min, the nanoparticles underwent a continuous morphological transformation from stars to rounded cubes to spheres (for td<
15 min no solid product could be isolated). At td= 15 min, the
final product was found to be a mixture of concave star-like particles and cubic-like particles with rounded edges and vertices, with an average size of 6.5 nm (Figure 4a). As the decomposition time of the reaction is increased (td = 20, 25
min) we see that the fraction of cubes increases, while the average size also increases up to 9.7 nm (Figures 4b,c). Finally at a td = 30 min (Figure 4d), almost all of the nanoparticles
possess a spherical shape, with an average size of 9.6 nm. In addition, an increased decomposition time led to reduced polydispersity, as defined by the standard deviation in size divided by the mean size.67As tdincreased from 15 to 30 min,
the polydispersity was reduced from 11.3% to 7.1%. This reduction in polydispersity is significant, since sub-10% polydispersity is considered the benchmark value of a highly monodisperse nanoparticle solution.67 Interestingly it was found that at smaller decomposition times (td= 15−25 min),
the molar metal ratio of these nanoparticles (as measured by EDX) was ∼ Ni:Fe 50:50, but when td=30 min, the Ni:Fe ratio
changed to 33:67.
Bronstein and co-workers demonstrated that the structure of the precursor iron oleate complex can have important effects on the resulting iron oxide nanoparticle products.49 In the work reported here, up to this point, the mixed metal nickel−iron oleate complexes time were dried, in air, at 100 °C for 1 h. If the drying time (air, 100 °C) was increased to 3 h or longer, a dramatic change in the resulting nanoparticle products was noted. When a mixed metal oleate precursor with an initial ratio of Ni:Fe of 33:67 (td = 20 min) was dried for 12 h,
nanoparticles with sizes of ∼7−8 nm with an octopod star-like morphology were produced, as shown in Figures 5a-b. As with the nanocubes, the stars maintained a single-crystal rocksalt structure as determined by electron diffraction (Figures 5b-c). Both nickel and iron were found to be uniformly distributed throughout the stars, as shown by EDX mapping (Figures 5e-f). The final compositions of the nanoparticles were relatively unaffected by drying; short drying times (0−1 h) led to final composition ratios of Ni:Fe of ∼50:50, while the longer drying times producing slightly Ni-richer (∼55:45) nanoparticles (Supporting Information Table S2). Using FTIR, it was determined that undried metal oleate precursors had a broad
Figure 3.(a) Fe EELS spectrum of nanocubes showing L2 and L3
peaks. Corresponding (b) Fe 2p3/2and (c) Ni 2p XPS spectra.
Chemistry of Materials Article
dx.doi.org/10.1021/cm501881a | Chem. Mater. 2014, 26, 4796−4804
shoulder around 3300 cm−1, suggestive of residual ethanol or
water.49Drying the precursor for a minimum of 3 h resulted in the disappearance of this shoulder (Supporting Information, Figure S6).
The initial ratios of nickel and iron oleate precursors were varied to further investigate the products of this synthetic approach. Nanoparticles were synthesized from Ni:Fe precursor ratios of 83:17, 67:33, 50:50, 33:67, and 17:83, with metal precursors being refluxed together. The metal oleate precursor was then thermolyzed using a decomposition time of 30 min. The resulting nanoparticle products all exhibited a rocksalt crystal structure as determined by XRD (Figure 6), with resulting Ni:Fe product ratios of 88:12, 49:51, 62:38, 33:67, and 24:76, respectively, as determined by EDX (Supporting Information Table S3). As expected, there is also a monotonic decrease in the lattice parameter as the Ni content of the nanoparticles increases. For control purposes, a Ni:Fe ratio of 100:0 (pure nickel oleate) was synthesized using a tdof 30 min,
yielding a black powder that did not resuspend in hexane; XRD analysis revealed that the powder was composed of both hexagonal and fcc nickel (Supporting Information, Figure S7). Under TEM, the powder appeared as ∼25 nm aggregates of smaller nanoparticles (Supporting Information, Figure S7). In
contrast, a synthesis of nanoparticles (td= 30 min) using 0:100
Ni:Fe (pure iron oleate) yielded ∼21 nm diameter nano-particles. From XRD characterization, the dominant crystalline phase was found to be FexO; however, the presence of a very
broad peak centered at 2θ ∼ 35° indicates the presence of a secondary iron oxide, likely due to deeper oxidation of the
Figure 4. TEM micrographs (left) and size distributions (right) of [Ni,Fe]O nanoparticles synthesized by heating the precursor for (a) 15, (b) 20, (c) 25, and (d) 30 min.
Figure 5.(a) TEM micrograph and corresponding size distribution of nanoparticles synthesized from a 33:67 precursor ratio, 20 min decomposition time, and 12 h drying time. (b) High-resolution HAADF-STEM image of a nanoparticle (inset: FFT diffractogram). (c) Corresponding electron diffraction pattern of the nanoparticles (right) and simulated electron diffraction pattern of a rocksalt crystal structure (left). (d,e) EDX maps of nanoparticles for (d) nickel and (e) iron.
Figure 6. XRD spectra of nanoparticles synthesized with different compositions of metals in the initial precursor solution with td = 30
min. All ratios are listed as nickel:iron.
FexO phase, similar to previous reports on iron oleate
decomposition (Supporting Information Figure S7).49,68,69
Changing the initial metal oleate composition also affected nanoparticle shape, as shown in Figure 7. Nanoparticles synthesized from Ni:Fe 83:17 (td = 30 min for all samples)
precursors appeared as irregularly shaped star-like particles with an average size of 7.3 nm, while nanoparticles synthesized from Ni:Fe 67:33 precursors consisted of a mixture of stars and rounded cubes. The Ni:Fe 50:50 precursors yielded 7.3 nm nanoparticles that appeared to be a mixture of cubes and spheres. Finally, the Ni:Fe 83:17 precursor product was composed of spheres that were 11.0 nm in diameter. While most samples maintained a high degree of monodispersity (9− 13%), the nanoparticles produced from the Ni:Fe 83:17 precursor had polydispersity values exceeding 15%, and the pure iron oleate sample had a polydispersity value of almost 20%.
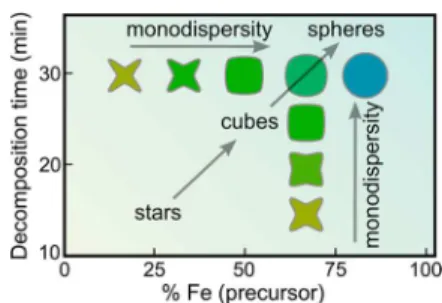
By changing the initial precursor ratio of nickel to iron and the decomposition time, we see that a diverse set of nanoparticle shapes can be synthesized; ranging from concave octopod stars, rounded cubes, and spherical nanoparticles. The results of these syntheses can be neatly summarized in what can
loosely be described as a “phase diagram”, shown in Figure 8. In this diagram, two consistent trends emerge. For a fixed precursor ratio, as the decomposition time is increased, the shapes of the resultant nanoparticles evolve in a continuous fashion from star-like concave octopods, to rounded cubes, and finally to spherical nanoparticles. Moreover, the monodispersity of the nanoparticles is found to increase with decomposition time. Alternatively, for a fixed decomposition time, as the nickel to iron precursor ratio is decreased, the same continuous transformation from stars to spheres is observed, with a similar increase in monodispersity. In summary, with high nickel to iron precursor ratios and at short decomposition times, octopod stars are produced; at intermediate nickel to iron precursor ratios and decomposition times, rounded cubes are produced; at low nickel to iron precursor ratios and long decomposition times, spherical nanoparticles are produced.
In order to understand the evolution of nanoparticle shape shown in Figure 8, we must first understand the origin of star-shaped nanoparticles. In another study of iron oleate decomposition in the presence of oleic acid, varying the ratio of iron oleate to oleic acid allowed for nanoparticle shape control.70 Specifically, as the ratio of iron oleate to oleic acid
was decreased, the shapes of the nanoparticles changed from spheres to stars. The formation of stars was attributed to be a result of uneven growth of the nanoparticles around the nuclei due to increased relative concentration of strongly adsorbing oleic acid. Given the similarity of our synthetic procedure and nanoparticles shapes to those found by Bronstein et al.,70it is
proposed that in the initial stages of the reaction (short decomposition times) the nanoparticle growth is kinetically limited, resulting in the formation of stars. However, once the faster growing faces become self-terminated (resulting in a star shape) and the reaction is allowed to continue, the higher energy curved concave surfaces are filled in and the stars transition to cubes and eventually to equilibrium spheres. Furthermore, as summarized in Figure 8, as the iron content of the oleate precursor increases, the reaction proceeds more rapidly. This result suggests that the decomposition of the mixed metal nickel/iron-oleate processed more slowly as the iron content of the mixed metal oleate is increased. However, further investigation will be required to test these hypotheses. Magnetometry was used to examine the magnetic properties of these nanoparticles. Three nanoparticle samples were used for comparison: 7.5 nm stars (Ni:Fe 33:67 precursor, td= 20
min and dried for 12 h), 7.9 nm nanocubes (Ni:Fe 33:67 precursor, td = 20 min), and 9.6 nm spheres (Ni:Fe 33:67
precursor, td= 30 min). In addition to slightly differing sizes,
the samples have different final metal compositions, ranging from 55:45 (stars) to 51:49 (nanocubes) to 33:67 (spheres). In all three samples examined, two magnetic transitions were
Figure 7.TEM micrographs (left) and corresponding size distribution (right) of [Ni,Fe]O nanoparticles synthesized when metal composi-tions in precursor oleate were modified before synthesis at td= 30 min.
Metal ratios are listed as nickel:iron. (a) 83:17, (b) 66:33, (c) 50:50, (d) 17:83.
Figure 8.Phase diagram of resultant nanoparticle shapes as a function of nickel to iron precursor ratio and decomposition time.
Chemistry of Materials Article
dx.doi.org/10.1021/cm501881a | Chem. Mater. 2014, 26, 4796−4804
found in the ZFC curves−a small transition around 50 K and a much larger one that varies in position from 181 K in spheres to 141 K in nanocubes to 111 K in stars (Figure 9a). Magnetic transitions observed in FC/ZFC measurements for nano-particle samples are usually taken to represent the blocking temperature (TB), the point at which the magnetic moment of a
nanoparticle is no longer pinned to the nanoparticle’s crystalline lattice and the nanoparticle’s behavior switches from being blocked to being superparamagnetic. The convergence of the FC and ZFC curves at the higher transition is consistent with this behavior and represents the TB of the
nanoparticles. For superparamagnetic nanoparticles with overall uniaxial anisotropy, the energy barrier Ebarrierto be overcome to
undergo the blocked-to-superparamagnetic transition is propor-tional to the product of the volume V of the nanoparticle and its effective anisotropy constant Keff (i.e., Ebarrier = KeffV). As
such, the increase in TBin going from stars to cubes to spheres
can be, to a first order, ascribed to the increase in volume of the nanoparticles. However, it must be noted that the differing compositions and shape will both contribute to modifying Keff,
although we believe these changes are less determining than volume in these samples. The position of the minor transition at 50 K does not change significantly and appears to be independent of the major transition.
In order to understand the nature of the major transitions and, therefore, the TB values of the nanoparticles, magnetic
hysteresis loops of these three samples were taken at 300 and 1.9 K. None of the samples exhibited any saturation or significant hysteresis at 300 K, even with the application of a 7 T magnetic field strength (Figure 9b). This lack of saturation or hysteresis is indicative of antiferromagnetic behavior at 300 K. In contrast, hysteresis measurements performed at 1.9 K revealed that all three samples showed some degree of hysteresis (Figure 9c). Both stars and nanocubes had low coercivities of 5.3 and 5.5 mT, respectively. However, the spheres had a much higher coercivity of 165.2 mT. The 300 K magnetization remained low even under a 7 T field (stars: 2.9 emu/g; cubes: 5.4 emu/g; spheres: 5.6 emu/g). This result is interesting because more anisotropic shapes, such as cubes and stars, are typically more magnetizable than spheres, which are geometrically isotropic.71,72In this system, the opposite trend is
observed, suggesting that volume may play a more important role than shape. It is often observed that the surface of magnetic nanoparticles is weakly/nonmagnetic.73However, as the shapes of these nanoparticles are changed from stars to cubes to spheres, the relative proportion of surface atoms increases, which could explain the decreasing trend in magnetization, as a higher fraction of the nanoparticle is weakly magnetic. Finally, the metallic composition may also play a role in determining the saturation magnetization. Nonetheless, these curves suggest that [Ni,Fe]O is an antiferromagnetic material that exhibits superparamagnetic behavior, as had been previously observed for nanoparticles of antiferromagnetic materials.74−76Both bulk FexO and NiO are considered antiferromagnetic with Néel
temperatures of 210 K and 525 K, respectively,77,78 so the
antiferromagnetic behavior is in line with that of the parent materials.
The low temperature transition is unusual because it is stable in position and size regardless of variations in bulk nanoparticle properties such as shape and composition. While a similar double peak complex was seen in FexO nanoparticles,
79
it was absent in 10 at% Fe-doped NiO nanoparticles,47suggesting that
the low transition peak is dependent on the increasing presence of Fe2+. Given the existence of Fe
3O4surface states in the FexO
nanoparticles,79 we propose that the low temperature peak arises from the presence and subsequent oxidation of Fe2+at
the surface of the nanoparticles, resulting in the formation of a surface region with unique magnetic properties. In contrast, surface anisotropy contributions to magnetic properties in pure antiferromagnetic materials usually arise from unpaired surface states.55Together with XPS oxidation data, we further propose
that [Ni,Fe]O nanoparticles exist primarily as bivalent metal oxides with a surface layer of Fe3+, as illustrated in Figure 9d.
The thermal stability of [Ni,Fe]O nanocubes (33:67 Ni:Fe precursor ratio and td= 20 min) was studied by monitoring the
XRD spectrum of films heated at three different temperatures
Figure 9.Magnetic measurements of differently shaped nanoparticles, including (a) ZFC and FC curves and magnetic hysteresis loops taken at (b) 300 K and (c) 1.9 K. (d) Proposed scheme of Fe and Ni atoms [Ni,Fe]O nanoparticles.
(200 °C, 400 °C, 600 °C) for 2 h under air. The nanocubes demonstrated little structural change when heated to 200 °C in air, as seen in Figure 10a. At 400 °C, however, the expected
equilibrium crystalline NiFe2O4 phase began to appear,
eventually becoming the dominant phase (based on peak heights) at 600 °C. When these experiments were repeated under argon (Figure 10b), few differences were observed at 200 and 400 °C. However, nanocubes heated to 600 °C in argon exhibited 4 new phases − NiFe2O4, NiO, α-Fe2O3, and metallic
nickel. The metastable [Ni,Fe]O phase of the nanoparticles therefore appear to be kinetically persistent up to 200 °C, as it is observed that the [Ni,Fe]O phase does not readily decompose below 200 °C despite the fact that it is not the equilibrium phase at these temperatures.
■
CONCLUSIONSWe have demonstrated the synthesis of monodisperse single-crystal [Ni,Fe]O nanoparticles with a rocksalt single-crystal structure by thermolysis of a metal oleate precursor. By tuning simple reaction conditions−the decomposition time at 305 °C and the metal ratio within the precursor complex−the shapes and monodispersity could be modified in a continuous fashion. Specifically, as the nickel to iron precursor ratio is decreased and/or the decomposition time is increased, there is a continuous shape transformation from octopod stars, to rounded cubes to spherical nanoparticles, with a subsequent decrease in polydispersity. Moreover, very monodisperse (<10% polydispersity) nanoparticles, less than 10 nm large, could be synthesized. Despite the nonequilibrium phase of the
nanoparticles, it is kinetically persistent; evidence of phase changes were not observed after storage under ambient conditions for several months or annealing at 200 °C for 2 h. These nanoparticles also had interesting magnetic properties; the blocking temperature was dependent on the composition and shape of the nanoparticles, but the behavior seen in ZFC/ FC curves was more reminiscent of FexO. These data,
combined with XPS characterization, suggest that the surface of the nanoparticles contains trivalent iron. Together, these data highlight the potential to synthesize a range of solid solution nickel−iron oxide materials with varying properties via a synthetic route that enables access to a metastable phase.
■
ASSOCIATED CONTENT*
S Supporting InformationAdditional TEM micrographs, size distributions, XRD spectra of [Ni,Fe]O nanoparticles, and FTIR characterization of metal oleate precursors. This material is available free of charge via the Internet at http://pubs.acs.org.
■
AUTHOR INFORMATIONCorresponding Authors
*E-mail: [email protected]. *E-mail: [email protected].
Notes
The authors declare no competing financial interest.
■
ACKNOWLEDGMENTSThis work was supported by NSERC, the National Institute for Nanotechnology (NRC-NINT), the Canadian Foundation for Innovation (CFI), Alberta Innovates Energy and Environment Solutions (AIEES), and the Canada Research Chairs (CRC) program. We thank Mr. Akira Yasuhara of JEOL Ltd. and Dr. Masahiro Kawasaki of JEOL USA Inc. for obtaining STEM images and EDX data. We thank Dr. Eric Flaim from the University of Alberta nanoFAB for microscopy consulting.
■
REFERENCES(1) Jiang, J.; Li, Y.; Liu, J.; Huang, X.; Yuan, C.; Lou, X. W. (D.) Adv. Mater. 2012, 24, 5166.
(2) Liu, C.; Li, F.; Ma, L.-P.; Cheng, H.-M. Adv. Mater. 2010, 22, E28. (3) Reddy, M. V.; Subba Rao, G. V.; Chowdari, B. V. R. Chem. Rev. 2013, 113, 5364.
(4) Deng, W.; Ji, X.; Chen, Q.; Banks, C. E. RSC Adv. 2011, 1, 1171. (5) Sassin, M. B.; Chervin, C. N.; Rolison, D. R.; Long, J. W. Acc. Chem. Res. 2013, 46, 1062.
(6) Suntivich, J.; Gasteiger, H. A.; Yabuuchi, N.; Nakanishi, H.; Goodenough, J. B.; Shao-Horn, Y. Nat. Chem. 2011, 3, 546.
(7) Chen, Z.; Higgins, D.; Yu, A.; Zhang, L.; Zhang, J. Energy Environ. Sci. 2011, 4, 3167.
(8) Wang, C.; Yin, L.; Zhang, L.; Xiang, D.; Gao, R. Sensors 2010, 10, 2088.
(9) Zakrzewska, K. Thin Solid Films 2001, 391, 229.
(10) Kim, M.-G.; Kanatzidis, M. G.; Facchetti, A.; Marks, T. J. Nat. Mater. 2011, 10, 382.
(11) Banger, K. K.; Yamashita, Y.; Mori, K.; Peterson, R. L.; Leedham, T.; Rickard, J.; Sirringhaus, H. Nat. Mater. 2011, 10, 45.
(12) Jeong, S.; Moon, J. J. Mater. Chem. 2012, 22, 1243.
(13) Smith, R. D. L.; Prévot, M. S.; Fagan, R. D.; Zhang, Z.; Sedach, P. A.; Siu, M. K. J.; Trudel, S.; Berlinguette, C. P. Science 2013, 340, 60. (14) Trotochaud, L.; Ranney, J. K.; Williams, K. N.; Boettcher, S. W. J. Am. Chem. Soc. 2012, 134, 17253.
(15) McCrory, C. C. L.; Jung, S.; Peters, J. C.; Jaramillo, T. F. J. Am. Chem. Soc. 2013, 135, 16977.
Figure 10. Effects of thermal annealing [Ni,Fe]O nanoparticles synthesized with a nickel to iron precursor ratio of 33:67 and decomposition time of 20 min. XRD spectra in (a) air and (b) argon.
Chemistry of Materials Article
dx.doi.org/10.1021/cm501881a | Chem. Mater. 2014, 26, 4796−4804
(16) Landon, J.; Demeter, E.; İnoğlu, N.; Keturakis, C.; Wachs, I. E.; Vasić, R.; Frenkel, A. I.; Kitchin, J. R. ACS Catal. 2012, 2, 1793.
(17) Wang, Z.; Zhou, L.; Lou, X. W. (D.) Adv. Mater. 2012, 24, 1903. (18) Sharma, Y.; Sharma, N.; Subba Rao, G. V.; Chowdari, B. V. R. Adv. Funct. Mater. 2007, 17, 2855.
(19) Henkes, A. E.; Bauer, J. C.; Sra, A. K.; Johnson, R. D.; Cable, R. E.; Schaak, R. E. Chem. Mater. 2006, 18, 567.
(20) Dunkle, S. S.; Helmich, R. J.; Suslick, K. S. J. Phys. Chem. C 2009, 113, 11980.
(21) Azurdia, J. A.; Marchal, J.; Shea, P.; Sun, H.; Pan, X. Q.; Laine, R. M. Chem. Mater. 2006, 18, 731.
(22) Subban, C. V.; Zhou, Q.; Hu, A.; Moylan, T. E.; Wagner, F. T.; DiSalvo, F. J. J. Am. Chem. Soc. 2010, 132, 17531.
(23) Debecker, D. P.; Mutin, P. H. Chem. Soc. Rev. 2012, 41, 3624. (24) Chandler, C. D.; Roger, C.; Hampden-Smith, M. J. Chem. Rev. 1993, 93, 1205.
(25) Sadakane, M.; Watanabe, N.; Katou, T.; Nodasaka, Y.; Ueda, W. Angew. Chem., Int. Ed. 2007, 46, 1493.
(26) Spooren, J.; Rumplecker, A.; Millange, F.; Walton, R. I. Chem. Mater. 2003, 15, 1401.
(27) Nguyen, T.-D.; Dinh, C.-T.; Do, T.-O. Nanoscale 2011, 3, 1861. (28) Sadakane, M.; Horiuchi, T.; Kato, N.; Takahashi, C.; Ueda, W. Chem. Mater. 2007, 19, 5779.
(29) Gülgün, M. A.; Nguyen, M. H.; Kriven, W. M. J. Am. Ceram. Soc. 1999, 82, 556.
(30) Bao, N.; Shen, L.; Wang, Y.; Padhan, P.; Gupta, A. J. Am. Chem. Soc. 2007, 129, 12374.
(31) Sun, S.; Zeng, H.; Robinson, D. B.; Raoux, S.; Rice, P. M.; Wang, S. X.; Li, G. J. Am. Chem. Soc. 2004, 126, 273.
(32) Dawood, F.; Leonard, B. M.; Schaak, R. E. Chem. Mater. 2007, 19, 4545.
(33) Su, F.-Z.; Liu, Y.-M.; Wang, L.-C.; Cao, Y.; He, H.-Y.; Fan, K.-N. Angew. Chem. 2008, 120, 340.
(34) Smith, R. D. L.; Prévot, M. S.; Fagan, R. D.; Trudel, S.; Berlinguette, C. P. J. Am. Chem. Soc. 2013, 135, 11580.
(35) Royer, S.; Duprez, D. ChemCatChem 2011, 3, 24.
(36) Galatsis, K.; Li, Y. X.; Wlodarski, W.; Comini, E.; Sberveglieri, G.; Cantalini, C.; Santucci, S.; Passacantando, M. Sens. Actuators, B 2002, 83, 276.
(37) Wang, D.; Kako, T.; Ye, J. J. Am. Chem. Soc. 2008, 130, 2724. (38) Machida, M.; Yabunaka, J.; Kijima, T. Chem. Mater. 2000, 12, 812.
(39) Toroker, M. C.; Carter, E. A. J. Mater. Chem. A 2013, 1, 2474. (40) Maeda, K.; Domen, K. Chem. Mater. 2010, 22, 612.
(41) Chen, D.-H.; He, X.-R. Mater. Res. Bull. 2001, 36, 1369. (42) Zhou, J.; Ma, J.; Sun, C.; Xie, L.; Zhao, Z.; Tian, H.; Wang, Y.; Tao, J.; Zhu, X. J. Am. Ceram. Soc. 2005, 88, 3535.
(43) Wang, J.; Cai, J.; Lin, Y.-H.; Nan, C.-W. Appl. Phys. Lett. 2005, 87, 202501.
(44) Mallick, P.; Rath, C.; Biswal, R.; Mishra, N. C. Indian J. Phys. 2009, 83, 517.
(45) Manna, S.; Deb, A. K.; Jagannath, J.; De, S. K. J. Phys. Chem. C 2008, 112, 10659.
(46) He, J. H.; Yuan, S. L.; Yin, Y. S.; Tian, Z. M.; Li, P.; Wang, Y. Q.; Liu, K. L.; Wang, C. H. J. Appl. Phys. 2008, 103, 023906.
(47) Moura, K. O.; Lima, R. J. S.; Coelho, A. A.; Souza-Junior, E. A.; Duque, J. G. S.; Meneses, C. T. Nanoscale 2014, 6, 352.
(48) Rhamdhani, M. A.; Hayes, P. C.; Jak, E. Metall. Mater. Trans. B 2008, 39, 690.
(49) Bronstein, L. M.; Huang, X.; Retrum, J.; Schmucker, A.; Pink, M.; Stein, B. D.; Dragnea, B. Chem. Mater. 2007, 19, 3624.
(50) Park, J.; An, K.; Hwang, Y.; Park, J.-G.; Noh, H.-J.; Kim, J.-Y.; Park, J.-H.; Hwang, N.-M.; Hyeon, T. Nat. Mater. 2004, 3, 891.
(51) Buck, M. R.; Biacchi, A. J.; Schaak, R. E. Chem. Mater. 2014, 26, 1492.
(52) Nečas, D.; Klapetek, P. Cent. Eur. J. Phys. 2012, 10, 181. (53) Laurent, S.; Forge, D.; Port, M.; Roch, A.; Robic, C.; Vander Elst, L.; Muller, R. N. Chem. Rev. 2008, 108, 2064.
(54) Niederberger, M. Acc. Chem. Res. 2007, 40, 793.
(55) Lu, A.-H.; Salabas, E. L.; Schüth, F. Angew. Chem., Int. Ed. 2007, 46, 1222.
(56) Kwon, S. G.; Hyeon, T. Acc. Chem. Res. 2008, 41, 1696. (57) Gu, H.; Soucek, M. D. Chem. Mater. 2007, 19, 1103. (58) Jette, E. R.; Foote, F. J. Chem. Phys. 2004, 1, 29. (59) Roth, W. L. Phys. Rev. 1958, 111, 772.
(60) King, H. W. J. Mater. Sci. 1966, 1, 79.
(61) Castellanos, M.; West, A. R. J. Chem. Soc., Faraday Trans. 1 1980, 76, 2159.
(62) Leapman, R. D.; Grunes, L. A.; Fejes, P. L. Phys. Rev. B 1982, 26, 614.
(63) Schedel-Niedrig, T.; Weiss, W.; Schlögl, R. Phys. Rev. B 1995, 52, 17449.
(64) Temesghen, W.; Sherwood, P. Anal. Bioanal. Chem. 2002, 373, 601.
(65) Kim, K. S.; Winograd, N. Surf. Sci. 1974, 43, 625. (66) Mansour, A. N. Surf. Sci. Spectra 1994, 3, 231.
(67) Yang, J.; Ling, T.; Wu, W.-T.; Liu, H.; Gao, M.-R.; Ling, C.; Li, L.; Du, X.-W. Nat. Commun. 2013, 4, 1695.
(68) Hai, H. T.; Yang, H. T.; Kura, H.; Hasegawa, D.; Ogata, Y.; Takahashi, M.; Ogawa, T. J. Colloid Interface Sci. 2010, 346, 37.
(69) Pichon, B. P.; Gerber, O.; Lefevre, C.; Florea, I.; Fleutot, S.; Baaziz, W.; Pauly, M.; Ohlmann, M.; Ulhaq, C.; Ersen, O.; Pierron-Bohnes, V.; Panissod, P.; Drillon, M.; Begin-Colin, S. Chem. Mater. 2011, 23, 2886.
(70) Bronstein, L. M.; Atkinson, J. E.; Malyutin, A. G.; Kidwai, F.; Stein, B. D.; Morgan, D. G.; Perry, J. M.; Karty, J. A. Langmuir 2011, 27, 3044.
(71) Zhen, G.; Muir, B. W.; Moffat, B. A.; Harbour, P.; Murray, K. S.; Moubaraki, B.; Suzuki, K.; Madsen, I.; Agron-Olshina, N.; Waddington, L.; Mulvaney, P.; Hartley, P. G. J. Phys. Chem. C 2011, 115, 327.
(72) Kovalenko, M. V.; Bodnarchuk, M. I.; Lechner, R. T.; Hesser, G.; Schäffler, F.; Heiss, W. J. Am. Chem. Soc. 2007, 129, 6352.
(73) Na, H. B.; Song, I. C.; Hyeon, T. Adv. Mater. 2009, 21, 2133. (74) Schuele, W. J.; Deetscreek, V. D. J. Appl. Phys. 1962, 33, 1136. (75) Kodama, R. H.; Makhlouf, S. A.; Berkowitz, A. E. Phys. Rev. Lett. 1997, 79, 1393.
(76) Richardson, J. T.; Yiagas, D. I.; Turk, B.; Forster, K.; Twigg, M. V. J. Appl. Phys. 1991, 70, 6977.
(77) Cornell, R. M.; Schwertmann, U. The Iron Oxides: Structure, Properties, Reactions, Occurrences and Uses; John Wiley & Sons: 2003. (78) Rao, C. N. R.; Raveau, B. Transition Metal Oxides; Wiley: 1995. (79) Glaria, A.; Kahn, M. L.; Lecante, P.; Barbara, B.; Chaudret, B. ChemPhysChem 2008, 9, 776.
![Figure 10. E ff ects of thermal annealing [Ni,Fe]O nanoparticles synthesized with a nickel to iron precursor ratio of 33:67 and decomposition time of 20 min](https://thumb-eu.123doks.com/thumbv2/123doknet/14100517.465555/9.938.103.399.157.626/figure-thermal-annealing-nanoparticles-synthesized-nickel-precursor-decomposition.webp)
