Artificial Intelligence Opportunities and an End-To-End Data-Driven
Solution for Predicting Hardware Failures
by
Mario Orozco Gabriel
B.S. Chemical Engineering, Instituto Tecnol6gico y de Estudios Superiores de Monterrey, 2011 Submitted to the MIT Sloan School of Management and the Department of Mechanical
Engineering in partial Fulfillment of the Requirements for the Degrees of
Master of Science in Mechanical Engineering
and
Master of Business Administration
In conjunction with the Leaders for Global Operations Program at the
MASSACHUSETTS INSTITUTE OF TECHNOLOGY
June 2016
@
2016 Mario Orozco Gabriel. All rights reserved.
The author herby grants MIT permission to reproduce and to distribute publicly paper and electronic copies of this thesis document in w oleor-in part in any medium now or hereafter created.
Signature redacted
Signature of Author ....
re acted
Department of M
nical Engineering and MIT Sloan School of Management
May 6, 2016
C tifiA b
Signature redacted
e r e y ...
Kalyan Veeramachaneni, Thesis Supervisor Principal Research Scientist in Laboratory for Information and Decision Systems
Signature redacted
C e rtifie d b y . ...... ..,.. I ... ... I...
Tauhid Zaman, Thesis Supervisor KDD Career Development Professor in Communications and Technology
Signature redacted
I
John J. Leonard, Mechanical Engineering Reader
...Samuel C. Collins Professor of Mechanical and Ocean Engineering
Uigntu
re redac
Uted-A ccep ted b y ...
Rohan Abeyaratne, Chairman of the Committee of Graduate Students
Department / Mechanical Engineering
Accepted by
...
Signature redacted
...
MASSACHUSES INSTITUTE Maura Herson, Director of MIT Sloan MBA Program
I OFTECHNOLOGY . MIT Sloan School of Management
JUN 0
8
2016
y .. .... *THIS PAGE INTENTIONALLY LEFT BLANK
Artificial Intelligence Opportunities and an End-To-End Data-Driven Solution for Predicting Hardware Failures
by
Mario Orozco Gabriel
Submitted to the MIT Sloan School of Management and the Department of Mechanical Engineering on May 6, 2016 in partial Fulfillment of the Requirements for the Degrees of
Master of Business Administration and Master of Science in Mechanical Engineering
Abstract
Dell's target to provide quality products based on reliability, security, and
manageability, has driven Dell Inc. to become one of the largest PC suppliers. The recent developments in Artificial Intelligence (AI) combined with a competitive market situation have encouraged Dell to research new opportunities. Al research and breakthroughs have risen in the last years, bringing along revolutionary technologies and companies that are disrupting all businesses. Over 30 potential concepts for Al integration at Dell Inc. were identified and evaluated to select the ones with the highest potential. The top-most concept consisted of preventing in real time the failure of hardware. This concept was investigated using a data science process.
Currently, there exist a number of machine learning tools that automate the last stages of the proposed data science process to create predictive models. The utilized tools vary in functionality and evaluation standards, but also provide other services such as data and model storage and visualization options. The proposed solution utilizes the deep feature synthesis algorithm that automatically generates features from problem-specific data. These engineered features boosted predictive model accuracy by an average of 10% for the AUC and up to 250% in recall for test (out of sample) data.
The proposed solution estimates an impact exceeding $407M in the first five years for Dell Inc. and all of the involved suppliers. Conservatively, the direct impact on Dell Inc. is particular to batteries under warranty and is expected to surpass $2.7M during the first five years. The conclusions show a high potential for implementation.
Thesis Supervisor: Kalyan Veeramachaneni,
Title: Principal Research Scientist in Laboratory for Information and Decision Systems Thesis Supervisor: Tauhid Zaman,
Title: KDD Career Development Professor in Communications and Technology Thesis Reader: John J. Leonard,
Title: Samuel C. Collins Professor of Mechanical and Ocean Engineering
THIS PAGE INTENTIONALLY LEFT BLANK
Acknowledgments
This work was possible thanks to the help and contribution from many friends. First, I would like to thank Dell for giving me the opportunity for this incredible internship in Austin. The team at Client Services was comprised of some of the most supportive people I have worked with. Many thanks to Nikhil Vichare, Leonard Lo, Steve Herington, Doug Reeder, Chad Skipper, Rick Schuckle, Jim White, Eugene Minh, Kevin Terwilliger, Catherine Dibble, Neil Hand, Charles Brooker, Christophe Daguet, and the rest of the CS team. Everyone's support went beyond their work obligations and played a key part in the development of this project.
A special thanks is in order to my supervisor Neal Kohl, who supported me since
day one, helped me get familiarized with Dell and Austin, and made this experience a most positive one. He provided me with invaluable guidance, encouragement, and also demands to strive for excellence. Neal helped me define the scope, maintain focus, and set a strategy, among other crucial steps in the development of the project.
Thanks to my advisors, Kalyan and Tauhid, who guided me through a complex field. Their recommendations helped me navigate through this multifaceted area and grasp key points. Also, thanks to Kalyan, whose support was fundamental especially when developing this data science process and evaluating different technologies.
Thank you to MIT, LGO, and Mexico for allowing me to have enjoyed one of the most transformative experiences in my professional and personal life. I hope to provide someday such opportunities to more people and give back as much to the Institute, program, and my country. I would also like to thank all the LGO staff and
LGO Class of 2016 who have made these two years unforgettable.
Finally, I thank my parents Mario and Julia for their instrumental advice and the values they have instilled in me through their way of life, and also thank my sisters Julie, Regina, and Natalia for always cheering me on. My family has always been my unconditional foundation of support and inspiration. Through their constant encouragement, I was able to maintain focus, sail through the difficult times, and find motivation to always continue doing my best. This work is dedicated to them.
THIS PAGE INTENTIONALLY LEFT BLANK
Note on Proprietary Information
In order to protect proprietary Dell information, the data presented throughout this thesis has been altered and does not represent actual values used by Dell Inc. Any dollar values, hardware data, and product names have been disguised, altered, or converted to percentages in order to protect competitive information.
Contents
1 Introduction 21
1.1 Motivation: if an oven can be smart, why can't a computer be smart? 21
1.2 Problem description and goals . . . . 23
1.3 H ypothesis . . . . 23
1.4 Thesis overview . . . . 24
2 Background 27 2.1 What are the connections between Data Science, Artificial Intelligence and Machine Learning? . . . . 27
2.2 Three factors that are making Al very relevant now . . . . 29
2.3 Dell Background . . . . 33
3 Smart Machines: Al Opportunities for Dell 35 3.1 What is a Smart Machine? . . . . 35
3.2 A l taxonom y . . . . 35
3.3 A l fram ework . . . . 37
3.4 Opportunity detection . . . . 38
3.4.1 Opportunities within Dell . . . . 39
3.4.2 Why monitor hardware to prevent failures? . . . . 39
3.4.3 Opportunities outside of Dell . . . . 40
4 Literature Review 43 4.1 Statistical methods in hardware failure . . . . 43
4.2 4.3 5 The 5.1 5.2 5.3 5.4 5.5 5.6
Statistical and machine learning methods in hardware failure . . . . . Machine learning methods in hardware failure . . . .
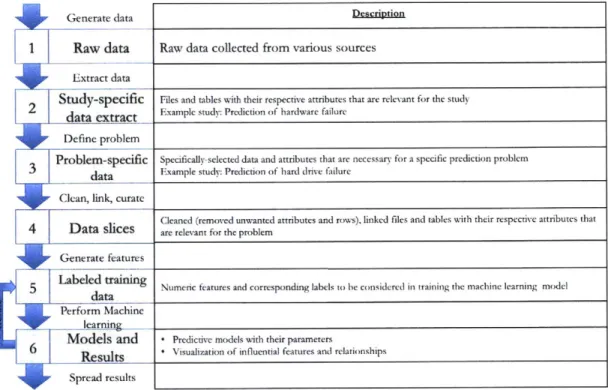
Data Science Pipeline
R aw d ata . . . .
Study-specific data extract . . . . Problem-specific data . . . . D ata slices . . . . Labeled training data . . . . Models and results . . . .
6 Machine Learning Tools
6.1 Ingesting and preparing the data . . . . .
6.2 Modeling and choosing parameters . . . .
6.3 Evaluating the trained models . . . .
6.4 R esults . . . .
6.5 Key findings . . . .
7 Financial Impact Analysis of the Proposed Solution 7.1 Incurred costs . . . . 7.2 Investm ent . . . . 7.3 Im pact . . . . 7.4 G oing big . . . . 8 Conclusions 8.1 Key Findings . 8.2 Contributions . 8.3 Recommendations 8.4 Future projects 8.5 Conclusions . . . 44 46 49 49 50 56 58 60 61 65 66 68 69 71 74 End-To-End Data-Driven 79 79 81 81 82 85 85 87 88 88 89
List of Figures
2-1 Exponential increase in data generation; 50-fold growth from 2010 to
2020. Greatly influenced by IoT . . . . 30
2-2 Increasing computing power as estimated by Ray Kurzweil. The y-axis describes the calculations per second (cps) per $1,000. As shown, $1,000 will be able to buy enough computing power as "one human brain" in
the next few years. . . . . 31
2-3 Total venture capital money for pure Al startups. The USA and London
lead in start-ups, with many in Canada, India, and China. About one half of the funding has gone into deep learning, one fourth into computer vision, and one eight into natural language processing (NLP). The most active funds have been Intel Capital, Techstars, 500 Startups, and Y
C om binator. . . . . 32
3-1 Al Framework and Market Potential. Today's estimated $4.5B market
is growing at 35% CAGR based on IDC's Cognitive software platform
forecast. . . . . 38
3-2 The categories and top-concept applications were evaluated and selected
using the shown parameters. . . . . 40
3-3 Summarized Al Competitive Analysis. There was a great deal of activity
in "cognitive" platforms, "data" machine learning, and analytics. Some
of the most relevant companies are shown in the figure. . . . . 41
5-2 The frequency of dispatches of different components closely follows the Pareto principle. As seen, hard drives are the most frequently
dispatched component. . . . . 53
5-3 There exist practically two data generation and acquisition paths that
are triggered by a daily rule or an unexpected alert or failure. . . . . 54
5-4 Problem-specific data file (newpd-log-datailarge.csv). It has the
Com-puterID, DataPointID, timestamps, and readings from multiple sensors. 57
5-5 Problem-specific data file (DispatchlnfoParsed.xls). It has the
Com-puterID, Dispatched Commodity (e.g. hard drive, motherboard, etc.),
and the date of dispatch. . . . . 57
5-6 Process of forming a slice of data corresponding to a specific computer
and then removing the sensor readings after the dispatch date. These sensor readings cannot be used for building the predictive model as
they happened after the dispatch event. . . . . 59
5-7 Labeled training data table (DFSFeatures.csv) has the ComputerID
field, 650 engineered feature fields, and Label. . . . . 61
5-8 Labeled training data table (NaiveFeatures.csv) has the
Computer-IDfield, 110 sensor fields, and Label . . . . 61
5-9 Data science process and results. Note the reduction in size of data
from 3.6GB to 40MB and 5MB by the time we bring it to a machine
learning modeling method. . . . . 62
5-10 Proposed end-to-end data-driven solution. . . . . 63
6-1 The AUC metric is the area under the ROC curve. . . . . 69
7-1 Summary of the financial yearly implications for both use cases and an
estimated global impact. Different variations of these use cases can be
7-2 Sensitivity analysis of the impact of the model's effectiveness. The call
center's call reduction impact is very relevant to Dell's case. Generally, it is worth noting how the performance of the predictive model has a very important financial impact. Hence, the relevance of the data,
List of Tables
5.1 DDSAC Summary between February 2015 and November 2015. . . 50
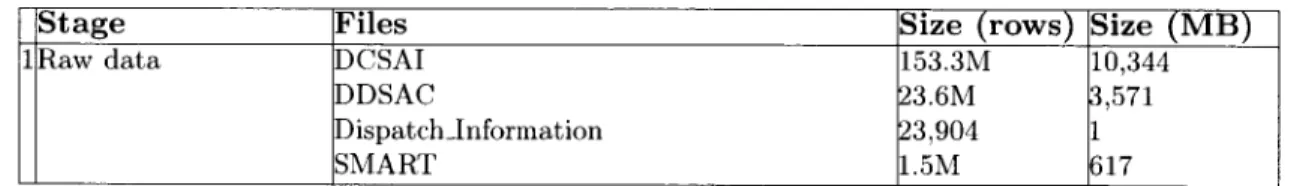
5.2 A set of databases in Dell's SQL servers. DCSAI (Dell Client Support Assist Internal), DDSAC (Dell Data Support Assist Client), Dispatch_ Information (dispatched hardware components for DDSAC), SMART (Hard drive sensor readings). . . . . 51
5.3 Study-specific data extract description. . . . . 55
5.4 Problem-specific data description. . . . . 56
5.5 Data slice file description. . . . . 58
5.6 Feature table description. . . . . 61
6.1 Data ingestion and preparation. For all tools, Labeled training data was uploaded as a csv file. Some tools offered options to select columns and features, handle missing values, among others. This table shows specific steps we took in each tool to prepare the data for machine learning. . 67 6.2 Modeling and parameter choices. The tools allowed different levels of customization for hyperparameters. Highlights: Skytree offered automatic modeling techniques and parameter tuning. IBM Watson did not allow setting parameters. . . . . 68
6.3 This table shows the evaluation techniques, which included cross
vali-dation for some tools, as well as splitting the data into train data and
test data for building and evaluating the predictive models. Data was
always split as: 70% for training and 30% for testing. Only three tools
6.4 Performance of different tools for our problem - NaiveFeatures. The predictive models created by each tool were evaluated with different datasets for their performance. The datasets were train data, which was comprised of 70% of the data in the original NaiveFeatures and test data, which was comprised of 30% of the data in the original NaiveFeatures and was not used to train the model. Some tools were evaluated with
100% of the data since they did not offer the option to split the data,
as seen in table 6.3. . . . .72
6.5 Performance of different tools for our problem - DFSFeatures. The
predictive models created by each tool were evaluated with different datasets for their performance. The datasets were train data, which was comprised of 70% of the data in the original DFSFeatures and test data, which was comprised of 30% of the data in the original DFSFeatures and was not used to train the model. Some tools were evaluated with
100% of the data since they did not offer the option to split the data,
as seen in table 6.3. . . . . 73
6.6 AUC DFSFeatures vs. AUC NaiveFeatures shows a vast improvement
in the models' predicting accuracy when using DFSFeatures instead of the NaiveFeatures. . . . .
Glossary of Terms
AI Artificial Intelligence
AGI Artificial General Intelligence
ANI Artificial Narrow Intelligence
AML Amazon Machine Learning
API Application Program Interfaces
ASI Artificial Super Intelligence
AUC Area under the curve
BP Backpropagation
CPU Central processing unit
CSV Comma Separated Value
CT Classification trees
DFS Deep feature synthesis algorithm
DS Data Science
DSM Data Science Machine
FAR False alarm rates, 100 times probability value
GB
GigabytesGBT Gradient Boosted Trees
GLM Generalized Linear Models
GPU Graphics processing unit
HDFS Hadoop Distributed File System
IoT Internet of Things
IT Information Technology
JSON JavaScript Object Notation
KNN K-nearest neighbor
NLI Natural Language Interaction
NLP Natural Language Processing
MARS Multivariate Adaptive Regression Splines
MLaaS Machine Learning as a Service
OCS Operations and Client Services
PMML Predictive Model Markup Language
RT Regression trees
SGD Stochastic Gradient Descent
SVM Support Vector Machines
RAM Random-access memory
RBF Radial Basis Function networks
RDF Random Decision Forests
RDS Relational Database Service
REST Representational State Transfer
ROC Receiver operating characteristic
SAAS
Software as a ServiceSAC Support Assist Clients
SMART Self-Monitoring and Reporting Technology
SPSS Statistical Package for the Social Sciences
SQL Structured Query Language
Chapter 1
Introduction
With the purpose of exploring the exponentially growing field of Artificial Intelligence
(AI) applications, this thesis has the objective to present an overview of Al technologies
and machine learning tools available today, as well as their specific application for the prevention of hardware failures. Al is enabling the new "smart" hardware and software applications that are disrupting businesses and the way we live our daily lives. Al is a broad term that will be explained later, but for the objective of this work, Al applied to a pragmatic business-applied purpose will be referred to as "Smart Machines" [1]. This is highly relevant in our time, as barriers to entry have been considerably lowered by the availability of open source Al algorithms and platforms, the increase in economical and scalable cloud computing power, and surge in data generation, which can easily enable anyone to become a "citizen data scientist."
1.1
Motivation: if an oven can be smart, why can't
a computer be smart?
Today, there is already a "smart" oven called June [2], which can precisely tell the difference between a chocolate and a raisin cookie, knows the weight, etc. to choose the right cooking time and temperature gradient to follow [3], while always improving its recipes. It has an NVIDIA central processing unit (CPU) and graphics processing
unit (GPU) along with two gigabytes (GB) of random access memory (RAM), Wi-Fi connectivity, a camera, and other sensors [2]. This is practically a computer. So, why aren't our computers even smarter?
The overarching goal behind this project is to explore the application of new data
science tools that can be applied to different business cases and for Dell Inc.1 to take
advantage of such opportunities in an extremely demanding market. This research also explores potential concepts that will allow Dell to develop a competitive and higher-quality product. The proposed concepts create value for the customer and provide a better customer experience.
Currently, Dell has over 100 million deployed systems comprising desktops and
laptops, and it is expected to ship around 20 million systems in the next year. Dell puts special emphasis to offer the most secure, manageable, and reliable products. Given this ambitious goal, there is always potential for improvement.
Today, computer failures are mostly treated post-event, which creates a major problem for the user and an important monetary impact on the service providers. However, Dell has recently launched Support Assist for Clients (SAC), software that enables the user to capture hardware data coming from hundreds of attributes pertaining to the hardware components, type of alerts, and failure types in a desktop or laptop.
The uses for this data can be quite varied and can provide valuable insights, such as system performance, influential interactions of hardware components and operation, etc. With this data, we can also potentially prevent hardware failures by warning the user, or even self-correcting based on real-time data that feeds into ever-improving predictive models. Just considering hardware cost and attending customers' calls, we have estimated these hardware failures to have an annual yearly cost of over $900M across the world. There is an interesting opportunity to make the products more reliable by making them predictive or proactive, rather than reactive, through an advanced and dependable process.
1.2
Problem description and goals
Hardware component failures in desktops and laptops can occur instantly, randomly, and without much warning. This affects Dell's customers globally, and Dell itself. These failures can cause great inconvenience to the customer, going beyond the physical damage to the product and data by extending to invaluable losses in time, productivity, and critical activities that depended on the reliability of these products. Additionally, Dell allocates resources consisting of people, customer service organizations and facilities, and hardware components to replace the damaged parts. This entire infrastructure to remedy failures is also reflected in a heavy financial burden that has the potential of being reduced or, in the best scenario, eliminated, and transformed into a business opportunity.
This thesis, instead of conducting a root cause analysis for the hardware failures themselves, focuses on seeking a solution to make desktops and laptops effectively robust against hardware failures. This will be done through a thorough analysis of available machine learning tools and testing them with Dell's available data for hardware failures. There will be a special focus on the tools' functionalities, available machine learning algorithms, tuning of hyperparameters, evaluation metrics, and other services, such as visualization options.
1.3
Hypothesis
The hypothesis of this inquiry is that an appropriate model to predict hardware failures can be built using data collected from different hardware sensors in the computer. The expected outcomes are a variety of accurate models to be created with the different available machine learning tools. Additionally, if the first hypothesis is proven true, another hypothesis will be explored that states that labeled training data generated with the deep feature synthesis algorithm (DFS) [4] will result in higher accuracy models. Finally, after this analysis, the development of an end-to-end data-driven solution for the problem of preventing hardware failure will be proposed on hindsight.
1.4
Thesis overview
Chapter 1 introduces the motivation for this project. Some context is given for
the problem to be solved: preventing hardware failures. Lastly, the hypotheses
are stated as: determining whether hardware sensor data can be used to prevent different hardware failures, and that features created with the "deep feature synthesis"' algorithm improve the accuracy of the predictive models.
Chapter 2 establishes the connection between data science, Al. and machine learn-ing. It also describes the background and factors that are making Al an increasingly relevant and applied topic today. Dell's background and interest in improving products through Al is explained.
Chapter 3 explores different Al opportunities that are available for Dell. For this., a taxonomy and framework to understand Al is proposed and explained. In the last section, the opportunities within and outside of Dell are presented, and the importance of preventing hardware failure is discussed.
Chapter 4 reviews literature on previous work on the subject of preventing hardware
failure. Statistical and machine learning methods are reviewed.
Chapter 5 proposes a data science process with six stages to follow an adequate path into solving prediction problems. The different stages and their connections are carefully explained. This section dives deeply into the available data, and especially the structure of the data, concerning hardware components in Dell's desktops and laptops. Also, the data science process is applied to Dell's particular problem to prevent hardware failures and focuses on hard drive failures due to their relevance and data availability.
Chapter 6 depicts seven different machine learning tools (platforms) and software that are currently available to analyze data, create predictive models, evaluate these models, and understand relationships and influences, among other uses. These tools are utilized to clarify their different capabilities, and specifically tested to build models to prevent hard drive failures using two different "labeled training data" approaches.
have across Dell and their suppliers. The last section emphasizes the value of the proposed end-to-end data-driven solution to prevent hardware failure in desktops and laptops on a global scale.
Chapter 8 concludes this thesis with a summary of the key findings and contribu-tions and provides recommendacontribu-tions that resulted from this work. Future potential projects at Dell are discussed and conclusions are presented.
Chapter 2
Background
2.1
What are the connections between Data
Sci-ence, Artificial Intelligence and Machine
Learn-ing?
Data science spans a broad range of interdisciplinary fields that includes computer science, mathematics, statistics, modeling, analytics, and information science, among others. The goal of data science is to utilize techniques to extract valuable knowledge from data with the aid of automated processes and systems. William Cleveland first introduced the discipline of data science in 2001, when he integrated the advances in "computing with data" to the field of statistics [5].
Like data science, Al is a broad subject and sometimes nebulous to people as it quickly convolutes into a topic dealing with machines that can think, reason, make decisions, and act like a human or have even higher capabilities than humans. Many researchers quickly turn to the psychology and philosophy of learning and discerning as humans and how this learning applies to these machines. More concretely, Tim Urban classifies AI into three categories [6]:
1. Artificial Superintelligence (ASI)
a human to one that is smarter than any combination of all human society including scientific creativity, social skills, and general wisdom.
2. Artificial General Intelligence (AGI)
AGI is also referred to as "Strong Al," or "human-level Al." It refers to a
computer that is as smart across the board as a human-a machine that can perform any intellectual task that a human being can. This category of Al means machines have abilities to plan, reason, solve problems, think abstractly, comprehend the complex, and learn quickly and from experience (inference).
3. Artificial Narrow Intelligence (ANI)
ANI is also referred to as "Weak Al." This Al specializes in just one area. This
type already exists, and we use it in our everyday lives.
All of these capabilities make AI a wildly interesting topic; however, this thesis will
focus on ANI technologies that are applicable to current businesses.
Machine learning is the most common technology, or set of algorithms, associated with Al as it has a very broad use. We clearly see the parallelism with Al as Andrew
Ng, Chief Scientist at Baidu Research and professor at Stanford in the Computer
Science Department, describes machine learning as "the science of getting computers to learn, without being explicitly programmed." There are two major machine learning branches: supervised and unsupervised.
1. Supervised learning
Uses labeled data and focuses on classification and prediction. Some examples of algorithms include artificial neural networks, decision trees, genetic algorithms (evolutionary algorithms), K-nearest neighbor (KNN), multivariate adaptive regression splines (MARS), random forests, support vector machines (SVM), etc.
2. Unsupervised learning
density estimations. Some examples of algorithms include the Eclat algorithm, K-means algorithm, expectation-maximization algorithm, etc.
Each of these different branches has a plethora of different algorithms that vary in performance depending on the data and end goal.
In addition, deep learning has been an increasingly popular variant of machine learning. Deep learning uses neural nets typically with more than two processing layers. The layers provide a "deeper" level of features from the data, which provides better classification and prediction performance.
2.2
Three factors that are making Al very relevant
now
John McCarthy coined the term "AI" in 1956 when the first academic conference
on this subject was held [7]. Al went through an exploratory process with much of
today's theory based on concepts from decades ago. So, why is it is so significant now? The crossroads of three factors have made Al stir unprecedented interest and activity in the past years and become very relevant in the business world. These factors are available data, increased computing power, and powerful algorithms.
Data generation has reached historically maximum levels, and most of the data generated is unstructured. As IBM states, "Every day, we create 2.5 quintillion bytes
of data - so much that 90% of the data in the world today has been created in the
last two years alone" [8]. Also, with the Internet of Things (IoT) on the rise, data
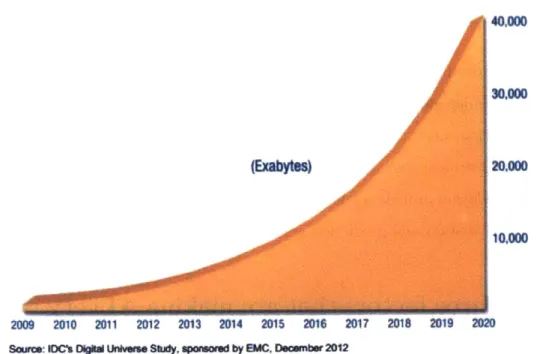
is coming from an increasing variety of sources such as GPS, online posts, climate sensors, energy meters, transportation routes, the human body, etc. The amount of data and sources is expected to increase considerably. According to Strategy&, "the installed-base of internet-connected devices exceeded 7 billion in early 2014 and is expected to grow to 50 billion by 2020. More than 10 times the amount of personal computers" [9]. Even IDC mentions that by 2020, we will be producing 50 times more data than in 2011 as pictured in Figure 2-1 [10]. Therefore, we need systems that can
generate useful insight from all this data. 40.000 30,000 (Exabytes) 20,000 10,000 2009 2010 2011 2012 A)1 2014 20 1 20, 2h1 2018 2019 202
Source: IDC's Digt Unveirse Study, sponsored by EMC. December 2012
Figure 2-1: Exponential increase in data generation; 50-fold growth from 2010 to 2020. Greatly influenced by IoT.
Additionally. the computing power available for very low prices has played an important role in the processing of all the generated data. As seen in Figure 2-2 [11], the increase in computing technology follows an exponential growth curve, based on M\oore's law, and futurist Raymond Kurzweil correlates this growth to a part of his "Law of Accelerating Returns" [12].
According to Deloitte, "comnputing cost-performance has decreased by more than three orders of magnitude in the past 25 years" [13], making it a decline of 33% year-on-year. Improvements in hardware, such as CPUs and GPUs, have allowed the efficient processing of this much data. According to Gartner [14], GPUs have had a 10,000 times improvement since 2008, increasing the number of possible connections from 1 x 10⁷ million to 1 x 10¹¹ million. An example is NVIDIA's new "Tesla GPU," which
processes 10-100x the application throughput of traditional CPUs [15]. Moreover, advanced neuromorphic architectures based on field-programmable gate arrays surpass GPUs three times in energy efficiency and according to Gartner, have a 70% increase in throughput with comparable energy used [16].
pve fire corleW aY grossrg returns fromi an evoA- snary We Can epress fhe ro qp-oierf w of of tat p
4r , [
ar e pare I 'sX )k tar .a1en the 1.11
' fA r ICX) dolars cr w we ari I ? MIPS pe rI Off, doita
Figure 2-2: Increasing computing power as estimated by Ray Kurzweil. The y-axis
describes the calculations per second (cps) per $1,000. As shown, $1,000 will be able to buy enough computing power as "one human brain" in the next few years.
Much of the structure of algorithms powering Al today existed years ago, but sufficient data and computer processing power were not easily available. Now, these algorithms have come to be used and proven very effective at tasks such as classification of structured and unstructured data, pattern detection, optimization, and predictive modeling, among other uses. Some examples of the types of algorithms used in Al are machine learning, deep learning, image recognition, natural language processing, etc. These algorithms have various uses such as data mining, text mining and search, expert
systems, speech recognition and interaction, medical diagnosis, financial decisions, and fraud detection, among others. The key differentiators of these algorithms is that they are no longer programmed to "solve a problem," but to "learn how to solve a problem."
However, these algorithms have also improved, and we can see this strategy in the powerful open source algorithms that exist (such as in R or Python programming) and how many large companies have open sourced their algorithms, such as Google
(TensorFlow), Facebook (Torch). Apple (Swift), Microsoft (DMTK - Distributed Machine Learning Toolkit), Netflix (Spinnaker), etc.
With these enabling factors, automated procedures are being developed to gather and process data to derive valuable insights for actionable results. Given these factors, Gartner expects that "by 2017, the amount of citizen data scientists will grow five
times faster than the number of highly skilled data scientists" [17].
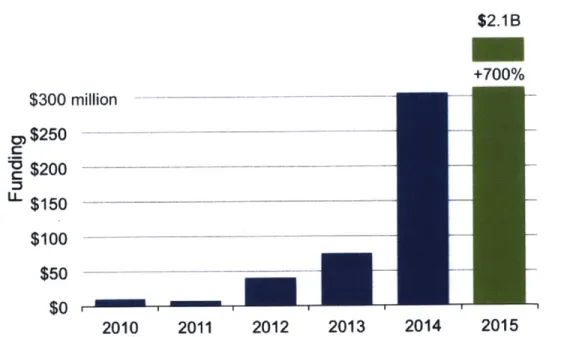
The business community has taken notice. According to data retrieved from Gartner and Venture Scanner [18], over the course of 2015, more than 270 new startups focused on Al were founded and over $2 billion dollars were invested in the field. which is more than a 700% increase from the previous year, where it had even tripled as seen in Figure 2-3.
$2.1 B +700% $300 million 0)$250 .C
0
$200
L $150 $100 $50 $0 2010 2011 2012 2013 2014 2015Sources: Bloomberg, Gartner, Jul 2015. Venture Scanner, Dec'15
Figure 2-3: Total venture capital money for pure Al startups. The USA and London lead in start-ups, with many in Canada, India, and China. About one half of the
funding has gone into deep learning, one fourth into computer vision, and one eight
into natural language processing (NLP). The most active funds have been Intel Capital, Techstars, 500 Startups, and Y Combinator.
2.3
Dell Background
Looking further back, Dell's history [19] provides useful context for what are now applicable Al opportunities. Michael Dell founded Dell Computer Corporation, then
PC's Limited, in 1984 with just $1,000 in his dorm room at the University of Texas at
Austin. His vision was to change "how technology should be designed, manufactured, and sold." He set out to sell directly to customers with a focus on service in order to truly understand their needs. Just four years later, Dell went public and raised $30 million and continued growing 80% per year during the first 8 years, almost gaining half of the marketplace. During the 1990s, Dell expanded globally to Europe, Asia, and the Americas, while also becoming the number one ranked PC business in the
USA and number one worldwide for PCs in medium and large businesses. In the 2000s,
the ecommerce site dell.com became one of the highest volume ecommerce sites with over $40 million in revenue per day. Shipments grew 60%, about four times as much as typical for industry players. Later on, Dell started to focus on offering end-to-end solutions, which he achieved by acquiring over 20 companies for $13 billion from 2006 to 2013.
In 2013, Michael Dell bought back Dell. This event was at the time the biggest public company to return to private. Dell focused on four key areas: Operations and Client Services, Enterprise Solutions, Software, and Research. As always inspired to offer a great product to customers and with the ever-changing and fast-paced tech environment, Dell announced in 2015 plans to acquire EMC in the biggest acquisition in tech history for $67 billion [20]. Dell now has over 100,000 employees, and is one of the top three largest suppliers of PCs and laptops.
The focus of this work will be within the Operations and Client Services (OCS) business in Dell. OCS accounted for over half of the company's $60+ billion in revenue in 2013, and it consists of various main categories: notebooks, desktop PCs, thin clients, and client-related peripherals. OCS is the largest business unit within Dell, and with the tough market, Dell has been recently under constant pressure to innovate. Therefore, because of the nature of the market, any technologies or innovations that
will create a product with better performance and higher quality that can be priced above market will always be an attractive and also crucial opportunity to go after. This work focuses on the potential Al applications for desktops, notebooks, and thin
Chapter 3
Smart Machines: Al Opportunities
for Dell
3.1
What is a Smart Machine?
As explained in the introduction, this work focuses on applied Al for businesses. Gartner states, "'Artificial intelligence' and 'cognitive computing' are not synonymous with 'smart machines' and may set unrealistic expectations for development and deployment. 'Smart machines' reflect a more diverse, pragmatic business purpose"
[1]. The "Smart Machines" term means that systems will acquire the ability to
train themselves, learn from their mistakes, observe the environment, converse with people and other systems, enhance human cognitive capabilities, and replace workers in routine tasks. All these tasks are done through the different, applicable AI technologies this work has been referring to.
3.2
Al taxonomy
In order to better understand the opportunities that lie ahead, this work proposes a taxonomy to classify the different Al technologies and algorithms. The basis for this classification of technologies lies in their uses and applications. The proposed taxonomy for Al in this work is the following:
1. Machine Learning
It can probably be considered the broadest and most applicable of the tech-nologies due to its flexible interdependent nature. It is a subfield of computer science that derived from pattern recognition and computational learning theory. As previously explained, with this technology software can develop insights
and features from data without it being explicitly programmed to do so. As mentioned, the two main branches are supervised and unsupervised learning (see 2.1).
2. Deep Learning
It is a set of algorithms that coincide with machine learning. More specifically, it is a technology based on neural nets. The concept of neural nets was inspired by the biological functioning of the brain, which takes multiple inputs and different areas extract specialized parts of information. Deep learning models abstract data from more complex sources and utilize multiple "specialized layers," which permit a deeper level of feature abstraction., such as prediction accuracy and classification.
3. Image Recognition
It is also known as computer vision. It is the field that has specialized methods to gather, process, analyze, and understand images through particular algorithms. It utilizes a combination of physics, geometry, statistics, and learning theories in order to achieve recognizing images.
4. Natural Language Processing and Natural Language Interaction (NLP
& NLI)
It is the ability of a computer to understand text and human speech. This can be done through a combination of machine learning algorithms in addition to specific rules to follow. This allows a computer to understand the structure, extract meaning, process it, and produce natural language.
It is the highest of the three levels of analytics. It combines advanced statistics and mathematics with data synthesis and computational science. Prescriptive
analytics will make different predictions based on the data and then recommend
different choices of action to implement depending on the expected outcomes and consequences. Second, predictive analytics involve advanced forecasting methods such as regression, which predict what will happen according to the data we have. Third, descriptive analytics is a term used for performing the basic analytics to understand past events and can generate information such as average, mean, median, standard deviation, etc.
3.3
Al framework
In order to detect potential opportunities for Dell, a framework was developed to understand and classify Al as well as to understand market potential. The methodology to develop such framework was based on interviews and research. The proposed Al framework is layered in the following way:
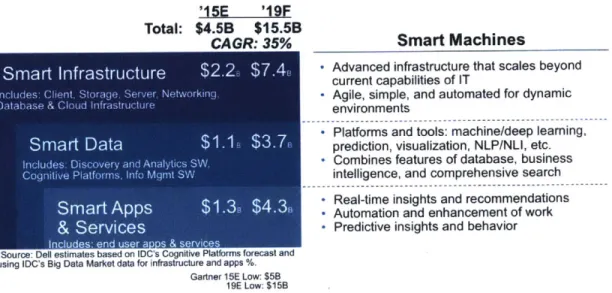
1. Smart Infrastructure
Includes the client (personal computers and laptops), storage, servers, networking, database and cloud management. This provides advanced infrastructure that scales beyond current capabilities of IT, where it is agile, simple, and automated for dynamic environments.
2. Smart Data
Includes discovery and analytics software, cognitive platforms, and information management software. This layer is based on the platforms and tools such as machine learning, deep learning, prediction, visualization, etc. and combines features of databases, business intelligence, and comprehensive research.
3. Smart Apps and Services
and recommendations, automation and enhancement of work. and predictive behavior.
'15E '19F Total: $4.5B $15.5B
CAGR: 35% Smart Machines
Smart Infrastructure
$2.2. $7.4s
Advanced current capabilities of ITinfrastructure
that scales beyondIncludes: Client, Storage, Server, Networking. Agile, simple, and automated for dynamic
Database & Cloud Infrastructure environments
- Platforms and tools: machine/deep learning,
Smart Data
$41, $3.7.
prediction, visualization, NLP/NLI, etc.Includes-, Discovery and AnalyficSW; Combines features of database, business
Cognive Platforms, Info Mgmt SW intelligence, and comprehensive search
- Real-time insights and recommendations
Smart
Apps
1.3s
$4.307" Automation and enhancement of work - Predictive insights and behavior*Source Ded r'strcates tacet on I r couninw? P ratw ins forecast and using IDC s Big Data Market data for infrastructure and apps %.
Gartner 15E Low: $5B
19E Low: $15B
Figure 3-1: Al Framework and Market Potential. Today's estimated $4.5B market is
growing at 35% CAGR based on IDC's Cognitive software platform forecast.
Within the proposed framework, Dell clearly plays in the first arid second layers
of Infrastructure and Data, which importantly includes a large part of the market.
However, it is important to capitalize on the "Smart" opportunities within these fields
as shown in Figure 3-1.
3.4
Opportunity detection
Having defined a taxonomy and framework for AL, two strategies, internal arid external,
were set to research opportunities for Smart Machines. The internal strategy was to
gather all current Smart Machines or related Al initiatives as well as to conduct a
brainstorming session with technical experts. The external strategy was to conduct
3.4.1
Opportunities within Dell
A brainstorming session was conducted and later evaluation criteria were selected and
thoroughly researched in order to prioritize the implementation of the concepts. The concepts were focused on the Operations and Client Services business at Dell.
The brainstorming yielded 30+ potential concepts, which were classified in the following categories: security, serviceability, manageability, and productivity. The criteria used to evaluate these concepts consisted in: technology readiness including
ease of implementation, financial impact, Intellectual Property
(IP)
potential, andbusiness alignment within Operations and Client Services and Dell. For more details on the ranking, reference Appendix A. Further analysis revealed that 16 were completely new concepts, seven were in discussion processes, and the rest were already being developed within Dell in some form.
3.4.2
Why monitor hardware to prevent failures?
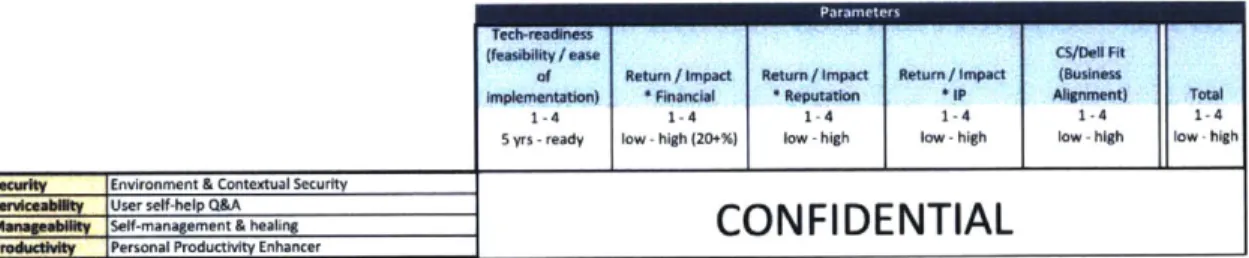
After evaluating the different concepts, only brand new ideas were selected, as shown in Figure 3-2, and out of those, the top ranked concept from each category was selected for further investigation. These were:
1. Security - Environmental and contextual security
2. Serviceability - User self-help smart Q&A
3. Manageability - Self-management and self-healing (hardware failure preven-tion)
4. Productivity - Personal productivity enhancer
Monitoring hardware for failure prevention stood out among the rest for several reasons consisting of: technology readiness (including data availability), financial opportunity, and Dell fit. On the technology side, Dell had started to actively collect sensor data from authorized systems, which included desktops and laptops, within the past year. This data consisted of the parameters within hardware sensors, which
Tech-readiness
(feaibity / ease CS/Dell Fit
of Return / Impact Return / Impact Return / Impact Business
implementation) Financial * Reputation * IP Alignment) Total
1-4 1-4 1-4 1 4 1 4 1-4
5 yrs -ready low high (2G+%) low high low- high low- high low high
Security I En vironment & Contextual Security 5erviceabllity |User self help Q&A
Manageablity Self-management & healing
CONFIDENTIAL
Productivity Personal Productivity EnhancerFigure 3-2: The categories and top-concept applications were evaluated and selected using the shown parameters.
are collected by the Support Assist for Clients software. Algorithms, such as machine learning to find failure patterns, were also readily available. Financially, this concept promised a very attractive opportunity, and seemed to be viable to implement in the short term. Lastly, there was alignment with two of Dell's quality drivers as most manageable and most reliable to give the user a supreme customer experience.
3.4.3
Opportunities outside of Dell
The global market for Smart Machines was also considered when evaluating opportu-nities and, for this, a thorough market and competitive analysis was performed. Using the established Al taxonomy, research was done to evaluate rising and also working concepts from leading companies and startups.
To evaluate the potential for opportunities, companies, as shown in Figure 3-3. were evaluated against four criteria:
1. Product availability
Low consisted of only trials and demos. Medium consisted of already working with less than 10 clients. High consisted of 1000+ users and/or 10+ use cases. 2. Company or product maturity
Low equals that the company has been established between zero and three years. Medium refers to a timeframe between four and seven years. High is between eight and 14 years, and very high is 15+ years.
3. Size of company or product
Low is between $5-$50M in revenue or between $10-$20M in funding. Medium is between $50-$500M in revenue or between $20-$100M in funding. High is
between $500M-$5B in revenue or between $100-$500M in funding. Very high consists of $5B+ in revenue or $500M+ in funding. Growth rate of revenues was also considered.
4. IP
Very low is established as less than 5 patents. Low is between 6-10 patents. Medium is between 11-50 patents. High is between 51-200 patents. Very high consists 200+ patents.
Product
---MS Aoru - Mtchoe Learnr
Platforms I n P1 orreor Re ievart "Data" Machine nana Learning liaBP
~
Deep Learning ,,,RP Prescriptive - - - -Analytics - - ---- ---Yb-k Learrfing im age -- - - - --Recognition - -- - -stointtnd NLP & NLI - - - -A -dsra--Product Maturity Size
--
----
----IP Comments
Most fecXble but p1.oert at ca s
'Oy to oe 0 -t ar tny RooMix otteton of Ad APIs
ABg Data aratyss platrm Spc-alzed ti tarce and ect y * I Stont AMEX Hon&, ey
ny -s1 alerts eeie oe too
Prtr 01o dugutr M ciepate
cilied agotN tcastet -mr rgeiraogntior oen sw
iirch. age NUP & open- sour- SW -- zero Ui -intt-e neactor
oim 4K deltope s 20C sort yar S
den - -- He-thrcar --- --- -
-- ------- --- ---- -
-Irpa itry Pth R. Pythi ard Spat.
mage andt V deo -- ------- --tecognecmmre
Vdo anay e oarch d' otet sectrty - ---- -- -- --V deodaalor secntytous Wet-estub sned powers Sir t0ch
Wotos teh Samnrg UIiCEF other,
--- d - ---
----F.-u -n b-snes --nerst
-Figure 3-3: Summarized Al Competitive Analysis. There was a great deal of activity in "cognitive" platforms, "data" machine learning, and analytics. Some of the most relevant companies are shown in the figure.
The conclusions on this competitive analysis show that the majority of the
compa--- T
---nies or products are very new and have been in the market for less than three years. Additionally, platforms are lowering the barrier of entry to the market as algorithms and technologies for Smart Machines are available on-demand to the public. Moreover, startups are focusing on a specific vertical to perfect their technology.
The results demonstrated clear opportunities exist for Dell within "Data" machine learning as already-developed products exist and the maturity of the companies means there is room to grow and become an important player in this area.
Chapter 4
Literature Review
In this chapter, seven relevant research papers are reviewed. These research papers deal with prediction models and methods that have been used for failure prediction in hardware systems, hard drives, and other computer systems. The prediction methods described in the papers involve statistical analysis and a variety of machine learning algorithms. A brief analysis of the work and conclusions of each will be presented in order to better understand the progress made in this subject.
4.1
Statistical methods in hardware failure
Elkan and Hamerly [21] utilize naYve Bayesian Classifiers in order to overcome the difficulty of lack of data, since hard drives fail approximately 1% per year. The naive Bayes method is a recognized supervised learning method that produces a classifier able to distinguish between two classes of data. Elkan and Hamerly studied the Self-Monitoring and Reporting Technology (SMART) system in hard drives, which is a failure prediction system to predict near-term failure. Typical SMART data includes variables such as power-on hours (POH), contact start-loops (CSS), seek errors in track servo (SKE), spinup time (SUT), etc. The SMART system can be regarded as a statistical hypothesis test based on each individual manufacturers' developed thresholds. These thresholds are set based on testing and engineering knowledge about the operational parameters. According to Hughes et al. manufacturers estimate the
"failure warning accuracy" (WA), or true-positive rate, of these systems to be between 3-10%, with estimated 0.1% "false alarm rates" (FAR), or false-positive results [22]. The failure events in hard drives do not happen very often, which means a known statistical distribution is hard to achieve. Elkan and Hamerly achieved a 33-59% WA with 0.5-0.7% FAR, which is a higher WA than the typical SMART performance, but with higher FARs.
Hughes, Kreutz-Delgado, and Murray also analyze [22] the SMART system in hard drives and propose a method that uses a distribution-free Wilcox rank-sum statistical test, since the problem deals with a rare-occurring event. This statistical test is recommended when failures are rare and false-positives are very costly. The proposed rank-suni method is used in combination with multivariate and ORing tests. The multivariate tests exploit the statistical correlations between attributes, and the ORing test simply uses a single attribute. The researchers achieve a 40-60% WA with
0.2-0.5% FAR, for both the multivariate and ORing tests [22].
4.2
Statistical and machine learning methods in
hardware failure
Going forward, Murray, Hughes, and Kreutz-Delgado compare statistical and machine learning methods [23] to try to predict hard-drive failures in computers by utilizing special attributes from the SMART system. They compare non-parametric statistical tests (rank-sum, reverse arrangements, and a proposed algorithm) as well as machine learning methods (SVMs and unsupervised clustering). They propose a new algorithm based on the multiple-instance learning framework since this study is considered a two-class semi-supervised problem. Multi-instance learning deals with objects that generate many instances of data, and an object's data is collected in a "bag," which receives a discrete value of 0 or 1 depending on the prediction problem. Additionally, they use a simple Bayesian classifier and pair it with the multiple-instance framework to create the multiple instance-naive Bayes (mi-NB) algorithm. Feature selection for
the models is done through the statistical reverse arrangements test and selecting such features depending on their relevant z-scores. The prediction models are created with SVMs, unsupervised clustering (Cheeseman and Stutz' Autoclass package [24]), rank-sum tests, and the mi-NB algorithm. They ran experiments using 25 attributes, single attributes, and a combination of attributes. The results show that SVMs provide the best performance with 51-70% WA and 0-6% FAR, followed by the rank-sum tests with 28-35% WA and 0-1.5% FAR, mi-NB with 35-65% WA with 1-8% FAR, and clustering with 10-29% WA with 4.5-14% FAR. Murray et al. highlight that the achieved results of non-parametric statistical tests are to be noted, since they come with great computational efficiency considering that SVMs take 100 times longer in training and testing [23].
Motivated by the growing complexity and dynamism of computer systems, Salfner, Lenk, and Malek [25] report a survey of over 50 methods for failure prevention in hardware. They developed a taxonomy for failure prediction approaches for hardware and software, which can be represented with the following stages:
1. Failure Tracking
It is based on the occurrence of previous failures. Methods included are
proba-bility distributions and co-occurrence.
2. Symptom Monitoring
It is based on periodical analysis of the system. The key concept is that through system monitoring, the side-effects of individual hardware degradation, which are very difficult to catch, can be detected. Methods included are function approximations (stochastic models, regression, and machine learning), classifiers (Bayesian and fuzzy), system models (clustered models and graph models), and
time series analysis (regression, feature analysis, and time series prediction).
3. Detected Error Reporting
It is a non-active method, driven by events logged in the input data when an error occurs. Methods included are rule-based approaches, pattern recognition, statistical tests, and classifiers.
4. Undetected Error Auditing is actively searching for incorrect states of the system that can potentially predict failures within the system.
Each method applies differently depending on the prediction problem and use case the user wants. Salfner et al. [25] do not provide remarks on WA or FAR of the different methods as the main purpose is to provide a framework for methods and their use cases. They conclude that proactive fault management will be the key that enables the next generation of dependability improvements.
4.3
Machine learning methods in hardware failure
Turnbull and Alldrin [26] explore the prediction of hardware failure for servers with the hypothesis of being able to use sensor data for such predictions. To predict failures they use the servers' sensor logs for positive (failed) and negative (did not fail) cases. Each log is composed of individual entries that are recorded every approximately 75 seconds and contain sensor data, such as different board temperatures and voltages. These entries also record any failures. The feature vectors from these entries are extracted during a "sensor window," which is a specific amount of time when entries are collected. Each feature vector is associated with a "potential failure window" that comes after the "sensor window" as time continues. These vectors are used as input in a Radial Basis Function (RBF) network, a type of a neural network, to solve a two-class classification problem. They use 18 hardware sensors to build 72 features that include the mean, standard deviation, range, and slope. They achieve an 87%
WA with a 0.1% FAR. They conclude that sensor data can be used to predict failures
in hardware systems. An important remark they also make is to always consider the cost of prediction accuracy in false positive rates as well as working in a context of infrequent hardware failure [26].
Zhu et al. [27] provide a new approach to predict failure in large scale storage systems through SMART data analysis. They propose a new Backpropagation (BP) neural network and an improved SVM that achieve higher WA with considerably low FARs. They utilize 10, out of the 23, SMART attributes and their change rates as