Publisher’s version / Version de l'éditeur:
Vous avez des questions? Nous pouvons vous aider. Pour communiquer directement avec un auteur, consultez la
première page de la revue dans laquelle son article a été publié afin de trouver ses coordonnées. Si vous n’arrivez pas à les repérer, communiquez avec nous à [email protected].
Questions? Contact the NRC Publications Archive team at
[email protected]. If you wish to email the authors directly, please see the first page of the publication for their contact information.
https://publications-cnrc.canada.ca/fra/droits
L’accès à ce site Web et l’utilisation de son contenu sont assujettis aux conditions présentées dans le site LISEZ CES CONDITIONS ATTENTIVEMENT AVANT D’UTILISER CE SITE WEB.
Student Report; no. SR-2009-07, 2009-01-01
READ THESE TERMS AND CONDITIONS CAREFULLY BEFORE USING THIS WEBSITE. https://nrc-publications.canada.ca/eng/copyright
NRC Publications Archive Record / Notice des Archives des publications du CNRC :
https://nrc-publications.canada.ca/eng/view/object/?id=3132e761-fd1e-4a68-906d-8e2a05454cc2 https://publications-cnrc.canada.ca/fra/voir/objet/?id=3132e761-fd1e-4a68-906d-8e2a05454cc2
Archives des publications du CNRC
For the publisher’s version, please access the DOI link below./ Pour consulter la version de l’éditeur, utilisez le lien DOI ci-dessous.
https://doi.org/10.4224/18227308
Access and use of this website and the material on it are subject to the Terms and Conditions set forth at Design and Operation of the Wake Survey Positioning Software
Institute for Ocean Technology Institut des technologies oc ´eaniques
SR-2009-07
Student Report
Design and Operation of the Wake Survey Positioning
Software.
Coish, B.
Coish, B., 2009. Design and Operation of the Wake Survey Positioning Software. St. John's, NL : NRC Institute for Ocean Technology. Student Report, SR-2009-07.
REPORT NUMBER
SR-2009-07
NRC REPORT NUMBER DATE
April 2009
REPORT SECURITY CLASSIFICATION
Unclassified
DISTRIBUTION
Unlimited
TITLE
DESIGN AND OPERATION OF THE WAKE SURVEY POSITIONING SOFTWARE
AUTHOR(S)
Bryan Coish
CORPORATE AUTHOR(S)/PERFORMING AGENCY(S)
Institute for Ocean Technology, National Research Council Canada
PUBLICATION
N/A
SPONSORING AGENCY(S)
Institute for Ocean Technology, National Research Council Canada
IOT PROJECT NUMBER NRC FILE NUMBER
KEY WORDS
Python, Wake Survey, Aerotech, Soloist
PAGES 32, Apps. A-B FIGS. 20 TABLES - SUMMARY
This report includes a discussion on the design and operation of the Wake Survey Positioning software. The software is written in Python and uses the Aerotech Soloist
Motion Controller. This software uses the ASCII Command Interface instead of the Aerotech C++ API found in the previous version of this software
ADDRESS National Research Council
Institute for Ocean Technology Arctic Avenue, P. O. Box 12093 St. John's, NL A1B 3T5
Tel.: (709) 772-5185, Fax: (709) 772-2462
National Research Council Conseil national de recherches Canada Canada
Institute for Ocean Institut des technologies Technology océaniques
Design and Operation of the
Wake Survey Positioning Software
SR-2009-07
Bryan Coish
i
Summary
This report discusses the design and operation of the wake survey position control software. This software is used to execute the wake survey experiment which is performed at the Institute for Ocean Technology operated by the Nation Research Council Canada. The wake survey is used to profile flows through and around the propeller disk area and is used to aid in propeller and hull design. The wake survey consists of positioning a pitot tube sensor array at various predefined points in the test area. The points to visit are stored in a XML based file called a runfile. Two Soloist motion controllers are used for motion and position control. The current implementation is a revision of a previous version that was developed to replace an old QuickBasic version. The application is composed of a backend, event system, and frontend. The backend provides commanding for the controllers and experiment execution. The event system provides asynchronous messaging between various components in the
application. Using the graphical user interface (GUI) allows the user to control and receive information on the controller. The GUI allows the user to load of a runfile. From that runfile the user can create runs which consist of a subset of points from the runfile. Once the run is created the user can initialize and execute the run. The editor allows the user to create and edit runfiles saving them to file when done. A builder wizard is
provided to automate the generation of the points. The editor allows for the editing and deleting of points plus the editing of additional information located in the runfile.
ii
Table of Contents
1.0 Introduction ... 1
2.0 Position Control Software Design ... 3
2.1 Backend Subsystem ... 4
2.1.1 Controller Backend ... 4
2.1.2 XML and Configuration Backend ... 10
2.1.3 Runfile Backend ... 11
2.2 Event Subsystem ... 16
3.0 Operation of the Position Control Software ... 19
4.0 Using the Runfile Editor ... 25
5.0 Conclusions ... 28
6.0 Recommendations ... 29
7.0 Bibliography ... 30
Appendix A: Soloist Datasheet ... 31
iii
List of Illustrations
Figure 1. Wake Survey positioning stage (pitot head not present) ... 1
Figure 2. Y-axes motor configuration ... 2
Figure 3. X-axes motor configuration ... 2
Figure 4. Sequence for command a single controller ... 5
Figure 5. Sequence for command both controllers using Dual Axes Controller ... 7
Figure 6. The layout of the basic controller backend ... 8
Figure 7. Class interaction in the runfile backend ... 12
Figure 8. Flow diagram of loading a runfile and creating a run ... 13
Figure 9. Flow graph for initializing and executing a run ... 14
Figure 10. Event process for GUI and non-GUI handlers ... 17
Figure 11. Homing Dialog ... 19
Figure 12. Homing dialog ... 19
Figure 13. Main application window ... 19
Figure 14. The various feedback and control panels ... 20
Figure 15. Main window with loaded runfile ... 21
Figure 16. Main window after run creation ... 22
Figure 17. Main window during run execution ... 23
Figure 18. Main window during a communication failure ... 24
Figure 19. Main window for runfile editor ... 25
1
1.0 Introduction
A wake survey experiment involves using pressure sensor to determine flow characteristics around the propeller disk of a ship. These flow characteristics are related to variations in direction and speed at predefined points along radii that are proportional to the propeller diameter. The information collected can be used to aid in propeller design or hull redesign (Re & Pelley, June 2003).
The test is generally performed in the tow tank at the Institute of Ocean
Technology and involves attaching a two axes positioned pitot tube stage to the back of the model which is then driven down the tank at various speeds.
The motors then position the pitot tube head to predefined points and holds for a period of time during which pressure readings are taken. The time to visit all the points may be longer then the time available for each run down to tank at the defined speed. To deal
2
with this the points are broken up into sets called runs. Each axis is controlled by single motor attached to the system by a ball-screw drive. The y-axis is directly attached while the x-axis is belt attached. The motors are each controlled by a Soloist Motion
Controllers provided by Aerotech. External application can interface with the controller using Ethernet or USB. (See Appendix A for additional specs) (Aerotech)
Figure 2. Y-axes motor configuration
3
2.0 Position Control Software Design
The purpose of the positioning control software is to allow the execution and control of the stage while on the model. The software provides all the services
necessary to execute a wake survey. To achieve this task the software consists of three subsystems; the backend, the event system, and the frontend. The backend provides all the classes need to perform the required services while the frontend contains the GUI. The backend contains no GUI components and communicates with the GUI through interfaces. The event system allow of asynchronous communication between
components using event based messaging.
The software is implemented using the Python 2.5 programming language which is a high level cross platform language. The GUI toolkit used is wxPython (WxPython Development Team) which is a Python port of wxWidgets (WxWidgets Development Team). The original version of this software was developed by a previous work term student Michael Hobbs and was intended to replace the old system written in Microsoft QuickBASIC which uses the Unidex U-14 controller from Aerotech. In order to get the system working with the Soloist the C++ Application Programming Interface from Aerotech where wrapped in Python using Boost (Hobbs, 2008). This wrapper was dropped in this implementation due to issue with firmware capabilities. As a result only 30 to 40 present of the original codes exists most of this code in the form of GUI components.
4 2.1 Backend Subsystem
The backend is responsible for command and control of the controllers, test execution, run file storage, configuration services and storage. The system is broken into several subsystems consisting of the controller backend, the runfile backend, configuration backend and various utilities.
2.1.1 Controller Backend
The controller backend is responsible for interfacing with the two Soloist
controllers providing access for sending commands and obtaining status information on the controllers. The system also provides services which allow the two controllers to behave as the multi-axis controller. The controller backend also provides data
management services to convert binary data provided by the controller into formats that the other components can use.
To communicate with the controllers the controller backend uses the ASCII command interface provided by Aerotech (Aerotech). The Figure 4 shows the flow for a controller command.
5
AeroBasic commands are sent to the controller over TCP/IP connections as ASCII character strings where each character is one byte in size. Once the controller receives the command it proceeds to execute the command. For most commands the controller i the response is sent right away without waiting for the command to finish execution. A few commands such as HOME and WAIT, the controller waits for command execution to complete before sending back the response. This is desired behaviour given the nature of these commands and is used by the application to aid in control. The interfaces provided by the controller backend remove the ability for clients to send strings directly to the controller, preventing incorrectly formatted string from being sent to the controllers. Instead, the supported AeroBasic commands are mapped to functions in the Controller class. The complete process of sending the command and parsing the response is removed from the client. A response class is provided to allow the clients to determine if the command was successful and to access any data sent back.
The data sent back from the controller is received as ACSII strings and must be converted to the correct type when received. For the most part this involves converting
6
to a float or integer. However, for the AXISSTATUS and AXISFAULT commands the returned data requires more complex processing.
The AXISSTATUS and AXISFAULT command return a 32-bit sequence where each bit represents the state of the each axis status field or fault field. When this reaches the client side it is turned into a 32-bit integer which is then encoded into an ASCII string. The class _BinaryBase in the datasystem module uses the Python struct module to pack the integer string into a sequence of 4 bytes to represent the 32 bit integer. Then struct is used to unpack each byte. Masks are then used to extract the value of each bit per byte. Ultimately a string containing 32 characters each consisting of the binary values of the associate bit is produced which then can be used to produce the axis status and fault status information. For example the value of 16th character is the value of 16th bit in the returned sequence. The remaining classes in the datasystem are used to access the information in this data.
In order to have constant feedback on the state of the controllers the backend must execute repeated AXISSTATUS and AXISFAULT calls. There are two primary techniques for doing this; polling or broadcasting. In a polling paradigm the backend connects to the controller at regular intervals and sends the AXISSTATUS and
AXISFAULT command, processes the results, generating events in the event system to provide status and faults updates. In a broadcast paradigm the controller backend listens for a broadcast from the controller with the status and fault information and then generates the update events. The broadcast paradigm is a preferred method because it generates less network traffic as the controller will only broadcast if the status or faults changes, whereas the polling always generates network traffic regardless. The current
7
controller backend implements a polling system because the Soloist doesn’t have broadcast capabilities and therefore implementing a broadcast system would be more involved. In order to reduce network traffic in the polling system, a timing scheme is used. The timer thread activates every 100 ms but the AXISSTATUS is called every 500 ms and the AXISFAULT is called every second. The only status information called every 100 ms is the position feedback PFBK which provides the current position of the axis. This is needed to maintain precision in positioning.
The last major task provided by the controller backend is multi-axis control for the two Soloists controllers. The Figure 5 summarizes the command sequence of the Dual Axis Controller system.
On their own each Soloist controls only one axis and this control is independent from the other controller. This means that the software must provide synchronization between the two axes making sure that each axis has completed motion before
8
continuing, this allows for 2D coordinate moves. The requirements for the software isn’t that the motion be coordinated but that the system is able to detect when both axis are at the correct location and only then allow the other actions to happen. This means that functions that involve synchronized motion block until both axes are in position. The system uses positional feedback from the controllers to detect when the motion is complete; this technique was chosen over in position and in motion status information due to higher precision for smaller moves due to the setup of the status polling.
The Dual Axes Controller is also responsible for homing the controllers when the application starts up and when the user requests a homing. The Soloist can home to a hardware switch or can perform a virtual home where the encoder is zeroed at its current location. This feature can be supported through the ASCII Command Interface using the SETPARM command but attempts to use this command failed on the current implementation. Therefore a standard hardware homing is used. When the axes is zero the offset from the actual controller zero is stored. The Figure 6 summarizes the
controller system.
9
There are several key issues with the current implementation of the controller backend that need to be resolved. First is the network layer for the communicating with the controllers. The Soloist controller’s sockets appear to the very primitive, handling only one connection at a time, therefore the network layer within the controller backend uses a locking system to allow only one thread to communicate with a controller at a time. Also the call flow for communicating could be cleaner, better branching when the system has an error. This may result in better performance within the network layer. The other big issue is the handling of the binary data returned by the AXISSTATUS and AXISFAULT commands. Python is a high level language and therefore does have a primitive byte type, although Python 3.0 has byte types, unlike some other languages such as C#, Java and C++ which has byte type. C# and Java has the byte array while C++ has the char type. As a result the struct module along masking is used as
previously explained. This process may result is incorrect conversion causing undesired effects because there is limited control when using struct to process the data.
10 2.1.2 XML and Configuration Backend
The XML backend provides XML readers and parsers for the runfile system to allow the file to be based on XML. The reasons for using XML are that it is a universal format and human readable. The biggest issue with using binary formats is that if the parser and/or writers are lost there is no way to recover the file without knowing how the binary structure works. Whereas with XML the file itself is human readable and
therefore parsers and writers can be created using just the file as reference. The XML backend also provides a parser which can read the controller configuration file which contains the connection IP and port for each controller plus other additional information. The configuration backend provides a second configuration system using Pythons ConfigParser module to store the settings. This system is used by the components to store settings and data. In the future this second configuration engine should be moved an XML engine.
11 2.1.3 Runfile Backend
The Runfile Backend along with the XML Backend provides all the necessary support to read, generate, edit, execute and write the runfile. The runfile contains a complete set of points to visit for a full wake survey and also contained the max velocity and acceleration for the controllers to use. As explained in section 2.1.2 the storage format for the runfile is XML and a custom file extension named runx is used. The reason for using XML as the storage format is that the human readable allows the user can modify the runfile manually which is useful for quick fixes or adjustments. Also because XML is a universal format, parser and writers such as SAX and DOM are readily available and very mature allowing for effecting parsing and generation. When the runfile is loaded into the application an instance of the RunFile class is created. This class contains all the data necessary for other components to execute the wake survey, furthermore additional methods are provided to allow the class to load and save a runfile from and to the file system. Using the RunFile class the application can create, edit, save, and load a runfile.
One issue with the current runfile implementation is that there is no field indicating if a point has been executed. As a result the user is required to remember which points have been visited should the system have to be shut down during a test or the test spans multiple days.
12
Due to the dimensions of the tank and the speed of the test it is generally not possible to visit all points in one run down the tank. Therefore the points listed in the runfile are split into several runs; this splitting is done during the test. To provide this feature the run is generated when the user selects the desired points. These points plus the users requested lag time is contained in an instance of the class Run. Associated with the run will be an Executor instance which will execute the run when commanded by the user. Figure 7 shows an overview of the runfile backend.
The whole system is managed by a Manager class which provides external components an interface for loading a runfile, creating and executing runs. The system is concurrent to allow for non-blocking operations, thus allowing easy integration with the GUI.
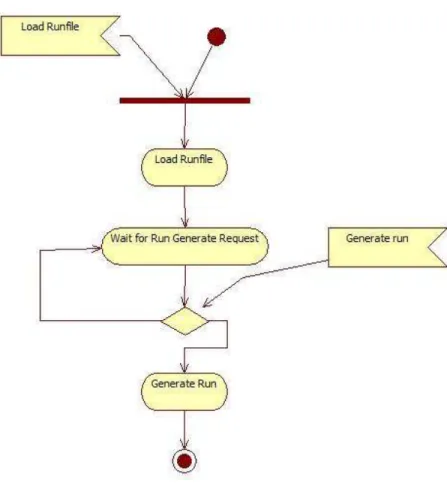
The process for performing a wake survey is to load a run file, create a run, initialize the run, execute the run, and then repeat until all points are visited. Figure 8 shows the process the software takes to load a runfile and create a run.
13
When the load runfile signal is received the file path for the runfile is provided to permit parsing of the runfile file and creation of the RunFile class instance. When complete an event is fired notifying the load is complete. Components can use this event to obtain information about the runfile by providing access to this class instance. The system now stands idle waiting for the user to select points and a lag time to
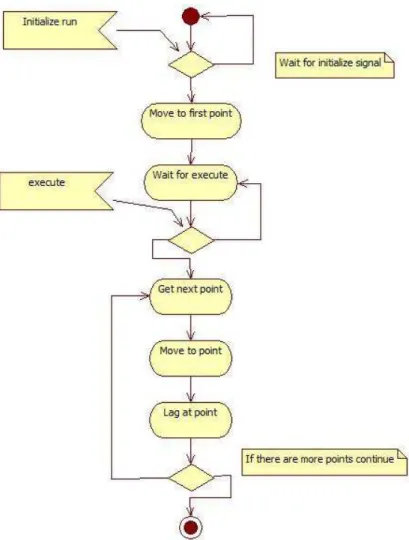
generate a run. When the generate run signal is received the system uses the provided list of points and the provided lag time to create the run. The associated run executor is created as well however it is in an uninitialized state. At this point the run is ready to be initialized and executed. Figure 9 shows the process for executing the run.
14
When the initialize run signal is received the system moves the stage to the first point in the run. An event is fired before and after this occurs to notify components. The initialization occurs on a thread to prevent blocking other components such as the GUI, this thread terminates when the process is done. At this point the run is ready to
execute on the users command. When the execute command is received the executor obtains the current point from the run, moves the stage to that point, then pauses for the specified lag time. If there are more unvisited points, then the process is repeated until
15
all points are visited. Events are fired when the run starts and when it ends. The end of a run is when all the points are visited. Events are fired at the beginning and end of each point execution. The purpose of these events is that the execution runs on a separate thread and the events allow other components such as the GUI to receive status information on run execution. The actual implementation is more complicate in that a run can be paused or halted. When the run is paused if the stage is moving to a point it will finish executing that point before pausing. When halt is signalled the stage will stop instantly.
In the current implementation there are a few issues with this system. First the pause behaviour may be undesired because if the pause is signalled during a point execute, the point will continue executing which includes lagging for sensor read. Second when halted the system enters a state where the run must be regenerated but continued. The current work around for this is to generate a new run at the point where the halt was called.
16 2.2 Event Subsystem
The event subsystem allows for decoupling of the various backend systems from each other and the GUI and also allows asynchronous controller and backend events to be passed around limiting the need for continuous polling of the components that
generates the events.
The event system implements a publish/subscribe model where clients register or subscribe to receive desired events while event generators publish events to the system which then get pushed to the clients. Clients can register to receive an event every time it is raised or only when a certain source raises the event, for example a client can register to receive position events only generated from the x axis controller.
A large issue with a GUI application containing a multithreaded model is
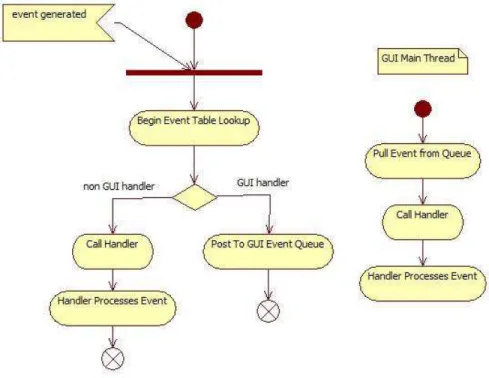
maintaining thread safety with the GUI. The components in most GUI toolkits including wxWidgets are not thread safe and should only be updated on the main GUI thread otherwise strange behaviour may occur. To allow for multithreaded application wxWidgets provides a function call that allows a non-GUI thread to have a method called on the main GUI thread. In the case of wxWidgets it is wx.CallAfter which will place a Python function pointer in the GUI event queue where it will be called on the main thread. This allows the events system to push events to GUI components regardless of which thread generated the event. Figure 10 shows how events processed in the event system.
17
There are two types of handlers in the event system, one for GUI components and one for non-GUI components. When clients register with the event system they provide the function to call when the requested event is called but also which type of handler they are. When the event is raised the event system calls the handler function directly for non-GUI handlers but for GUI handlers it uses CallAfter to pass the function over to the main GUI thread to maintain thread safety with the GUI.
This is a simply solution which allow for safe interaction with the GUI but does not come without pitfalls. Where CallAfter places the handler function on the main GUI thread it essentially moves the event from the posting thread to the GUI thread, this generates an interesting side effect. The event processing for GUI handlers is
18
asynchronous to the thread posting the event where as it is synchronous for a non-GUI handler, because of this there is no simple way of implementing a veto/allow feature of the event system. A veto/allow feature would allow the event handler to preventing (veto) or allowing the event. If the event is vetoed then the action that caused this event is stopped. One use of this feature would be in the runfile execution were the execution of points could be vetoed when the user requests an execution pause. This feature cannot be implemented simply because the posting thread cannot be guarantee that when the post event function returns that all the event handlers have processed the event due to the asynchronous nature of the GUI handlers. It may be possible to provide such a feature using locks and flags to detect when all the possible GUI handlers are done processing the event but this would introduce complexly to the system and possible avenues for hard to detect concurrency bugs.
19
3.0 Operation of the Position Control Software
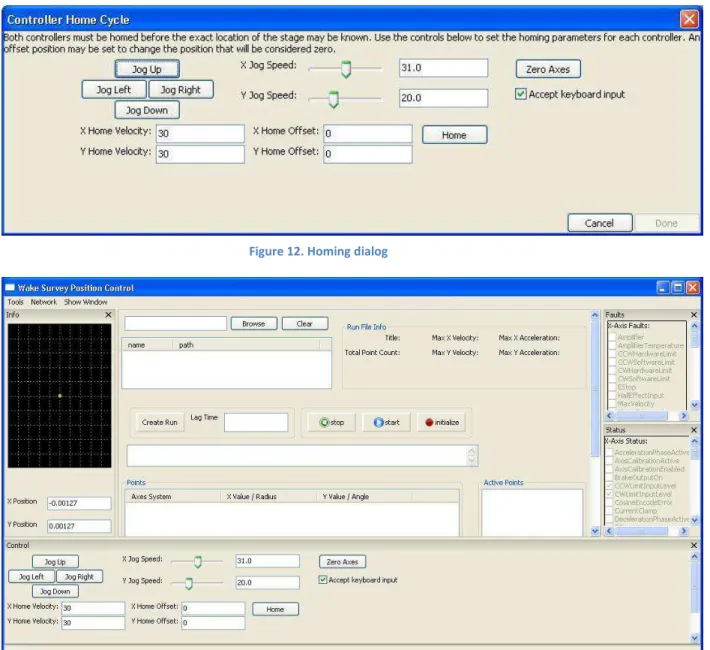
When the application is first started the homing dialog appears requiring the user to home the controllers before any other use of the application can occur. After homing is complete the main window will appear. See Figure 11 and 12.
Figure 11. Homing Dialog
Figure 13. Main application window Figure 12. Homing dialog
20
The main windows is an advance user interface (AUI) GUI (WxPython Development Team) consisting of the main content panel located in the middle of the window and is used to load and execute the runfile. Surrounding the main content panel is the various feedback and control panels. There are the faults panel, status panel, motor control panel and info panel.
The faults panel provides feedback on any faults in the controller may be
experiencing. Checkmarks will appear next to faults that occur. The acknowledge fault button allows the user to acknowledge the faults on the controller. The status panel provides feedback on the state of the various status fields for the controllers. The checkmarks have different means depending on the status bit they are representing.
21
The info panel provides feedback on the position of the carriage this includes a
graphical display of the stage location. The motor control panel provides axes control. The user can jog in any direction, set jogging velocity, set homing velocity, home the controller and zero the axes.
In the main content panel the browse button in the upper left can be used to load a runfile. Once the runfile is loaded the complete list of points for the runfile will be present in the points list and additional data will be present in the upper left. The graphical display in the info panel will contain the points as red Xs. See Figure 14
To create a run the mouse and shift button is used to select multiple points from the Points list. A lag time in seconds is entered into the lag time field and the “Create
22
Run” button is pushed. This will create a run. The points in the run will appear in the Active Points list and the points in the Point list will turn red. See Figure 15.
To initialize the run the initialize button is pushed. This will cause the stage to move to the first point in the run, once there the first point in the Active Points list will turn blue. The run can now be executed. To execute the run the start button is pushed. The stage will attempt to move to the first point but will not do anything if it is already there. The system will then pause for the lag time. Following that, every point in the run will be executed, when a point is finished it will turn green in the Points list and the red X in the graphical info display will turn into a green plus sign. The current executing point will be blue in the Active Points list. When the pause button is pushed the executor will finish the current point but not move to the next one. As soon as the system is un-paused the stage will move to the next point. To halt the stage while in motion the stop button is pushed. See Figure 16.
23
At any time there is communication failure between the application and the
controllers goes into a safe state where all the panels except the main content panel are removed. Before this happens a dialog is presented notifying of the situation. To
reconnect to the controllers the network menu option can be used.
24
25
4.0 Using the Runfile Editor
The runfile editor can be used to create, edit and save runfiles. While the runfile is stored in a human readable form, the editor provides a specialized interface. When the application starts the following windows is shown.
A runfile can be created manually using the form fields in the center and the Point list on the right, however a wizard is provided to automate the process. To use the wizard click tools and select builder wizard. Follow the steps in the wizard filling in the necessary data. Next to each field is an icon and when the correct data type is entered a checkbox will appear. If an X appears then the wrong data type has been entered, to see the error hover the mouse over the X. Once all the steps are completed and finish is
26
clicked the editor will use the data to create all the points for the runfile and fill in the correct fields. The main window will appear like this.
The Points list contains all the generated points based on the inputted data. To delete a point double click on the icon to the left of each row. To add a point use the add point button and to edit point click on the list cells. A validation system will prevent the entry of incorrect data for the point field. When ready the runfile can be saved using the file menu.
There are few issues with the editor that currently limit its use. First the order of the point in the Points list can’t be changed. The order issues are with the wizard, if generating points between 0 and 360 a point is generated at 0 and 360 which are the same location. This can be dealt with by deleting the redundant point. Another issue is
27
that there is no way to use the editor to append points. Therefore you can have different density of points around the radii.
28
5.0 Conclusions
o The ASCII Command Interface provides control and commanding of the controllers but the network layout needs improvement.
o The datasystem can provide efficient binary decoding for status and fault data as a replacement for byte types found in other languages.
o The polling system provides a non-ideal solution to obtaining feedback from the controllers.
o The XML and configuration systems provide persistence storage for application settings and the runfile.
o The runfile backend provides the necessary storage and services for wake survey execution.
o The runfile execution has issues with pausing and halting of the run.
o The event system provides effective decoupling of application components. o The event system provides thread safe callbacks for GUI components.
29
6.0 Recommendations
o Attempts should be made to switch from a polling to broadcast controller feedback system.
o Improvements to the controller network layer in the area for better error handling and connection management should be attempted.
o The control configuration which is currently XML should be moved to the Config Backend.
o The runfile can be maintained in an XML format.
o A visited status field should be added to the runfile point field.
30
7.0 Bibliography
Aerotech. (n.d.). Soloist User Manual.
Aerotech. (n.d.). soloist.pdf. Retrieved April 23, 2009, from Areotech website: http://www.aerotech.com/soloist/soloist.pdf
Hobbs, M. (2008). Wake Survey Positioning Software Manual. Institute for Ocean Technology, Nation Research Council Canada.
Re, A. J., & Pelley, D. M. (June 2003). Wake Survey, Resistance, And Wake Profile Experiments on Design No. 6 of the NRC Hull Form Series. Institute for Marine Dynamics, Nation Research Council.
WxPython Development Team. (n.d.). wxAUI overview. Retrieved April 24, 2009, from wxPython: http://wxpython.org/onlinedocs.php
WxPython Development Team. (n.d.). wxPython. Retrieved April 24, 2009, from wxPython: http://www.wxpython.org
WxWidgets Development Team. (n.d.). wxWidgets. Retrieved April 24, 2009, from wxWidgets: http://www.wxwidgets.org
31
A-I
The following spec sheet is an execept from the Aerotech datasheet for the Soloist releating to the controller model being used (Aerotech).
32
B-I <?xml version="1.0" ?>
<runfile title="demo" units="mm"> <diameter> 100.0 </diameter> <xvel> 30 </xvel> <xacc> 200 </xacc> <yvel> 30 </yvel> <yacc> 200 </yacc> <points numPoints="33">
<point axis="P" xvalue="15.0" yvalue="0.0"/> <point axis="P" xvalue="15.0" yvalue="36.0"/> <point axis="P" xvalue="15.0" yvalue="72.0"/> <point axis="P" xvalue="15.0" yvalue="108.0"/> <point axis="P" xvalue="15.0" yvalue="144.0"/> <point axis="P" xvalue="15.0" yvalue="180.0"/> <point axis="P" xvalue="15.0" yvalue="216.0"/> <point axis="P" xvalue="15.0" yvalue="252.0"/> <point axis="P" xvalue="15.0" yvalue="288.0"/> <point axis="P" xvalue="15.0" yvalue="324.0"/> <point axis="P" xvalue="15.0" yvalue="360.0"/> <point axis="P" xvalue="25.0" yvalue="0.0"/> <point axis="P" xvalue="25.0" yvalue="36.0"/> <point axis="P" xvalue="25.0" yvalue="72.0"/> <point axis="P" xvalue="25.0" yvalue="108.0"/> <point axis="P" xvalue="25.0" yvalue="144.0"/> <point axis="P" xvalue="25.0" yvalue="180.0"/> <point axis="P" xvalue="25.0" yvalue="216.0"/> <point axis="P" xvalue="25.0" yvalue="252.0"/> <point axis="P" xvalue="25.0" yvalue="288.0"/> <point axis="P" xvalue="25.0" yvalue="324.0"/> <point axis="P" xvalue="25.0" yvalue="360.0"/> <point axis="P" xvalue="55.0" yvalue="0.0"/> <point axis="P" xvalue="55.0" yvalue="36.0"/> <point axis="P" xvalue="55.0" yvalue="72.0"/> <point axis="P" xvalue="55.0" yvalue="108.0"/> <point axis="P" xvalue="55.0" yvalue="144.0"/> <point axis="P" xvalue="55.0" yvalue="180.0"/> <point axis="P" xvalue="55.0" yvalue="216.0"/> <point axis="P" xvalue="55.0" yvalue="252.0"/> <point axis="P" xvalue="55.0" yvalue="288.0"/> <point axis="P" xvalue="55.0" yvalue="324.0"/> <point axis="P" xvalue="55.0" yvalue="360.0"/> </points>