Publisher’s version / Version de l'éditeur:
Vous avez des questions? Nous pouvons vous aider. Pour communiquer directement avec un auteur, consultez la
première page de la revue dans laquelle son article a été publié afin de trouver ses coordonnées. Si vous n’arrivez pas à les repérer, communiquez avec nous à [email protected].
Questions? Contact the NRC Publications Archive team at
[email protected]. If you wish to email the authors directly, please see the first page of the publication for their contact information.
https://publications-cnrc.canada.ca/fra/droits
L’accès à ce site Web et l’utilisation de son contenu sont assujettis aux conditions présentées dans le site LISEZ CES CONDITIONS ATTENTIVEMENT AVANT D’UTILISER CE SITE WEB.
The 5th NRC Symposium on Computational Fluid Dynamics and Multi-Scale
Modeling [Proceedings], pp. 1-10, 2008-01-21
READ THESE TERMS AND CONDITIONS CAREFULLY BEFORE USING THIS WEBSITE. https://nrc-publications.canada.ca/eng/copyright
NRC Publications Archive Record / Notice des Archives des publications du CNRC :
https://nrc-publications.canada.ca/eng/view/object/?id=fe0bc0bc-cf92-43a3-bd90-099359d6b2b9 https://publications-cnrc.canada.ca/fra/voir/objet/?id=fe0bc0bc-cf92-43a3-bd90-099359d6b2b9
NRC Publications Archive
Archives des publications du CNRC
This publication could be one of several versions: author’s original, accepted manuscript or the publisher’s version. / La version de cette publication peut être l’une des suivantes : la version prépublication de l’auteur, la version acceptée du manuscrit ou la version de l’éditeur.
Access and use of this website and the material on it are subject to the Terms and Conditions set forth at
CFD simulations for different fire ventilation scenarios in a room
http://irc.nrc-cnrc.gc.ca
C F D s i m u l a t i o n s f o r d i f f e r e n t f i r e v e n t i l a t i o n
s c e n a r i o s i n a r o o m
N R C C - 5 0 2 6 6
S a b e r , H . H . ; K a s h e f , A .
A version of this document is published in / Une version de ce document se trouve dans: 5th NRC Symposium on Computational Fluid Dynamics and Multi-Scale Modeling, Ottawa, Ontario, January 21, 2008, pp. 1-10
The material in this document is covered by the provisions of the Copyright Act, by Canadian laws, policies, regulations and international agreements. Such provisions serve to identify the information source and, in specific instances, to prohibit reproduction of materials without written permission. For more information visit http://laws.justice.gc.ca/en/showtdm/cs/C-42
Les renseignements dans ce document sont protégés par la Loi sur le droit d'auteur, par les lois, les politiques et les règlements du Canada et des accords internationaux. Ces dispositions permettent d'identifier la source de l'information et, dans certains cas, d'interdire la copie de documents sans permission écrite. Pour obtenir de plus amples renseignements : http://lois.justice.gc.ca/fr/showtdm/cs/C-42
CFD Simulations for Different Fire Ventilation Scenarios in a Room
Hamed H. Saber and Ahmed Kashef
National Research Council of Canada, Institute for Research in Construction 1200 Montréal Road, Bldg. M59, Ottawa, Ontario K1A 0R6 Canada
ABSTRACT – Establishing a proper design fire scenario is a challenging task and essential component for conducting fire safety design of buildings. A design fire scenario is a qualitative description of a fire with time identifying key events that characterize the fire (ignition, growth, flashover, fully-developed, and decay stages of fire). In addition, it describes the ventilation conditions that will impact the course of a fire. A number of fire ventilation scenarios were investigated in order to identify the proper ventilation scheme for conducting design fire tests in a compartment of a size 4.2 m long, 3.8 m wide, and 2.4 m high. The fuel package that was used in all simulated scenarios consisted of a sofa and two wood cribs underneath it. The sofa was constructed entirely out of flexible polyurethane foam. The two wood cribs provided additional fuel load to sustain a fully developed fire. The selection of this fuel package is supported by fire statistics that many fatal residential fires begin with an item of upholstered furniture. The ventilation schemes of these scenarios were provided by using a window, a door, or both with different sizes. The CFD results showed that a maximum heat release rate of about 7,000 kW was achievable in some scenarios. Based on the CFD results of this study, medium and large-scale fire tests will be conducted in NRC’s lab facility in order to evaluate various fire scenarios and determine proper design fires for residential houses.
1. Introduction
Proper fire safety design requires the appropriate selection of design fires against which the performance of the building is evaluated. The selection of the design fires directly impacts all aspects of fire safety performance, including the structural fire resistance, compartmentation against fire spread, egress systems, manual or automatic detection systems, suppression systems, and smoke control. The parameters affecting design fires include, the type, amount and arrangement of combustible materials, the ventilation conditions (air supply conditions, door/window open), and size of the compartment of fire origin. A design fire is a quantitative description of the characteristics of a fire, such as heat release rate (HRR), size of fire and its rate of spread, yield of products of combustion, and hot gas temperatures. Design fires are based on fire scenarios that replicate real fires.
Nine Computational Fluid Dynamics (CFD) numerical simulations were conducted in order to investigate the effect of ventilation scenarios on fire dynamics in a room of a size of 4.2 m long, 3.8 m wide and 2.4 m high with the room oriented with its length in the east-west direction. The ventilation schemes were based on using a window, door, or both (see Figure 1 and Table 1). Different sizes of windows and doors were investigated. The fire was initiated by igniting an item of upholstered furniture. A fuel package consisting of a mock-up sofa and two wood cribs was selected. The mock-up sofa was constructed from exposed polyurethane foam, the dominant combustible constituent of upholstered furniture. The mock-up sofa was ignited first and the wood cribs provided the remaining fire load to sustain a fully-developed fire for a
desired period of time. The details of the fuel package and its characteristics are available in [6] and [2]. This mode of fire initiation is supported by fire statistics that many fatal residential fires begin with an item of upholstered furniture.
2. Ventilation Parameters and Fire Load
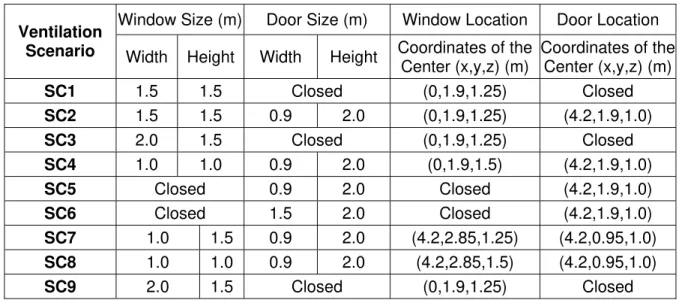
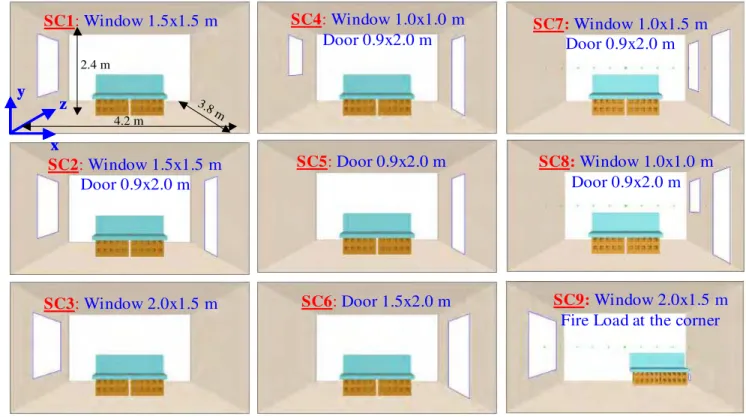
Figure 1 and Table 1 show the fire load and the ventilation settings for each scenario. The polyurethane sofa, with a mass of 8.3 kg, composed of two blocks of flexible polyurethane foam (with a density of 30 kg/m3). As shown in Figure 2, the dimensions of the seat cushion block was 1.83 m long x 0.61 m wide and 0.1 m thick, and of the backrest block was 1.83 m x 0.6 m and 0.15 m. A 0.1 m square burner was located on the top of the seat cushion at its center. The burner heat release rate per unit area was 304 kW/m2 (~3 kW). The burner was ignited for a period of 30 s. Two wood cribs (made of spruce lumber pieces, each piece measuring 0.05 m x 0.10 m x 0.80, Figure 3) with a mass of 86.7 kg were placed underneath the polyurethane sofa with a distance of 0.05 m separating them. It was assumed that wood cribs consist of 70% cellulose, 20% lignin and 10% water by mass. The fire load (polyurethane sofa and two wood cribs) was oriented in the east-west direction in all ventilation scenarios. In ventilation scenarios SC1 through SC8, the fire load was placed at the center of the room. In SC9, however, the fire load was placed at one of the corners of the room and 0.10 m away from both the east and north walls (Figure 1).
Table 1 Ventilation conditions for the nine scenarios
Window Size (m) Door Size (m) Window Location Door Location Ventilation
Scenario Width Height Width Height Coordinates of the
Center (x,y,z) (m) Coordinates of the Center (x,y,z) (m) SC1 1.5 1.5 Closed (0,1.9,1.25) Closed SC2 1.5 1.5 0.9 2.0 (0,1.9,1.25) (4.2,1.9,1.0) SC3 2.0 1.5 Closed (0,1.9,1.25) Closed SC4 1.0 1.0 0.9 2.0 (0,1.9,1.5) (4.2,1.9,1.0) SC5 Closed 0.9 2.0 Closed (4.2,1.9,1.0) SC6 Closed 1.5 2.0 Closed (4.2,1.9,1.0) SC7 1.0 1.5 0.9 2.0 (4.2,2.85,1.25) (4.2,0.95,1.0) SC8 1.0 1.0 0.9 2.0 (4.2,2.85,1.5) (4.2,0.95,1.0) SC9 2.0 1.5 Closed (0,1.9,1.25) Closed
3. CFD Simulation Using FDS Version 5
The Fire Dynamic Simulator (FDS) is a CFD model developed to idealize fire-driven fluid flow. The model numerically solves a form of the Navier-Stokes equations appropriate for low-speed, thermally driven flow, with an emphasis on smoke and heat transport from fires. The partial differential equations for conservation of mass, momentum, and energy are discretized using the finite difference method, and the solution is updated in time on a three-dimensional,
rectilinear grid. Thermal radiation is computed using a finite volume technique on the same grid as the flow solver. Lagrangian particles are used to simulate smoke movement and sprinkler discharge. FDS computes the temperature, density, pressure, velocity, and chemical
composition within each numerical grid cell at each discrete time step. Additionally, FDS computes the temperature, heat flux, mass loss rate, and various other quantities at solid surfaces.
3
Version 5.0 of FDS [3-4] was used to simulate the nine ventilation scenarios listed in Table 1 and Figure 1 in a room of a size of 4.2 x 3.8 x 2.4 m. Only one mesh (stretched in x- and y-directions, and uniform in z-direction) was used for each ventilation scenario. The total number of cells was 720,000. The mesh was refined in the regions where large temporal and/or spatial gradients of key flow quantities are anticipated (e.g. in the vicinity of the fire, door and window). Note that, the local HRR was calculated from the local oxygen consumption rate at the flame surface. Therefore, a fine mesh is necessary where the flame exists in order to capture the profile of the flame, and hence accurately predict the HRR. The CPU time using the NRC-IRC cluster machine for each scenario was 14 – 21 days.
SC3:Window 2.0x1.5 m SC6:Door 1.5x2.0 m SC9:Window 2.0x1.5 m
Fire Load at the corner SC2:Window 1.5x1.5 m Door 0.9x2.0 m SC5:Door 0.9x2.0 m SC8:Window 1.0x1.0 m Door 0.9x2.0 m SC1:Window 1.5x1.5 m SC4:Window 1.0x1.0 m Door 0.9x2.0 m SC7: Window 1.0x1.5 m Door 0.9x2.0 m x z y 3.8 m 4.2 m 2.4 m
SC3:Window 2.0x1.5 m SC6:Door 1.5x2.0 m SC9:Window 2.0x1.5 m
Fire Load at the corner SC2:Window 1.5x1.5 m Door 0.9x2.0 m SC5:Door 0.9x2.0 m SC8:Window 1.0x1.0 m Door 0.9x2.0 m SC1:Window 1.5x1.5 m SC4:Window 1.0x1.0 m Door 0.9x2.0 m SC7: Window 1.0x1.5 m Door 0.9x2.0 m
SC3:Window 2.0x1.5 m SC6:Door 1.5x2.0 m SC9:Window 2.0x1.5 m
Fire Load at the corner SC3:Window 2.0x1.5 m
SC3:Window 2.0x1.5 m SC6SC6::Door 1.5x2.0 mDoor 1.5x2.0 m SC9:Window 2.0x1.5 m Fire Load at the corner SC9:Window 2.0x1.5 m
Fire Load at the corner SC2:Window 1.5x1.5 m Door 0.9x2.0 m SC5:Door 0.9x2.0 m SC8:Window 1.0x1.0 m Door 0.9x2.0 m SC2:Window 1.5x1.5 m Door 0.9x2.0 m SC2:Window 1.5x1.5 m Door 0.9x2.0 m SC5:Door 0.9x2.0 m SC5:Door 0.9x2.0 m SC8:Window 1.0x1.0 m Door 0.9x2.0 m SC8:Window 1.0x1.0 m Door 0.9x2.0 m SC1:Window 1.5x1.5 m SC4:Window 1.0x1.0 m Door 0.9x2.0 m SC7: Window 1.0x1.5 m Door 0.9x2.0 m SC1:Window 1.5x1.5 m SC1:Window 1.5x1.5 m SC4:Window 1.0x1.0 m Door 0.9x2.0 m SC4:Window 1.0x1.0 m Door 0.9x2.0 m SC7: Window 1.0x1.5 m Door 0.9x2.0 m SC7:Window 1.0x1.5 m Door 0.9x2.0 m x z y x z y 3.8 m 4.2 m 2.4 m
Figure 1 Ventilation parameters for the nine scenarios
The walls, floor and ceiling of the room were assumed inert and insulated (adiabatic) for all scenarios. In this case, the values of the heat release rates and the temperatures in the room would be the highest (the upper limit). These values depend on the ventilation scenarios. In all scenarios, the windows and doors led to the exterior (i.e. open to the outside). Ventilation vents were introduced to mimic the actual doors and windows as shown in Figure 1 and Table 1. The total local pressure (dynamic + static + gravitational pressure) in the room with and without fire is equal to the atmospheric pressure. To satisfy this condition, the boundary conditions at the windows and doors were treated as open vents. Upon initiating the fire, the flow field inside the room will be modified such that the total local pressure in the room will equal the atmospheric pressure. Subsequently, the mass flow rates at the doors and windows were calculated for each ventilation scenario. The nine fire simulations were conducted for a certain period of time. The CFD simulation in each scenario was terminated after the burning of the fire load
completely stopped. As will be shown later, the combustion of the fuel was completely stopped at different periods of time for these scenarios.
Unlike the previous versions of FDS [5], the new combustion model of FDS version 5 considers that the solid fuels can undergo simultaneous reactions. Each material component may
undergo several competing reactions, and each of these reactions may produce some other solid component (residue, char in this case), gaseous fuel, and/or water vapor. It accounts for mixing of fuel and oxygen without burning. Both oxygen concentration and temperature of gases in the vicinity of the flame sheet plays an important role on whether burning can or cannot take place upon mixing of fuel and oxygen. Furthermore, FDS version 5 accounts for the CO production and its eventual oxidation at the flame envelope or within a hot upper layer. More details on FDS 5 version are available in [3,4,8]. The CFD results of the nine scenarios are discussed next. 76 15 10 60 183 10 10 Burner HRRPA = 304 kW/m2 Æ HRR ≈ 3.0 kW for the first 30 seconds
Pol yur ethane So fa (C 6.3H 7.1NO 2.1) All dimensions in cm Cp = 1.0 kJ/kgK k = 0.1 W/mK ρ = 30.0 kg/m3 Tign= 200 oC ΔHv= 1,500 kJ/kg ΔHc= 28,000 kJ/kg Emissivity = 0.9 76 15 10 60 183 10 10 Burner HRRPA = 304 kW/m2 Æ HRR ≈ 3.0 kW for the first 30 seconds
Pol yur ethane So fa (C 6.3H 7.1NO 2.1) All dimensions in cm Cp = 1.0 kJ/kgK k = 0.1 W/mK ρ = 30.0 kg/m3 Tign= 200 oC ΔHv= 1,500 kJ/kg ΔHc= 28,000 kJ/kg Emissivity = 0.9
Figure 2 Sofa dimensions and thermal properties 80 10 80 10 10 10 10 10 5 5 10 40
Wood Crib
Wood Composition by mass: 70% Cellulose 20% Lignin 10% Water 80 10 80 10 10 10 10 10 5 5 10 40 80 10 80 10 10 10 10 10 5 5 10 40Wood Crib
Wood Composition by mass: 70% Cellulose 20% Lignin 10% WaterFigure 3 Geometric arrangement of the wood crib
4. Results and Discussions
In this section, the results of the different scenarios are presented and discussed. Before conducting the CFD simulations for these scenarios, several numerical tests and debugging were carried out. One of these tests (Test Case I) was conducted to burn two wood cribs only, placed at the center of the room. Another numerical test (Test Case II) was conducted to burn the full fire load that consists of a polyurethane sofa and two wood cribs underneath it in a fully-opened room. In these tests, different mesh sizes were used in order to optimize mesh size. It was found that increasing the size of a stretched mesh (in x- and y- directions) beyond 100 x 75 x 96 had no significant effect on the results. Moreover, the calculated effective heat of combustion of the wood was in good agreement (within +13% and +7.6% for Test Case I and II, respectively) with that calculated using Babrauskas’ correlation [6]. This good agreement confirmed the appropriateness of both the modified mixture friction
combustion model and pyrolysis model in FDS version 5.0 (see [8] for more details). Based on the numerical results of Test Cases I and II, a stretched mesh in x- and y- directions of a size of 100 x 75 x 96 and burner of thermal power of ~ 3 kW for a period of 30 s were used to conduct the CFD simulations for different ventilation scenarios listed in Table 1 and Figure 1. The results of these simulations are briefly presented and discussed next.
5
Comparison of the HRR of different scenarios
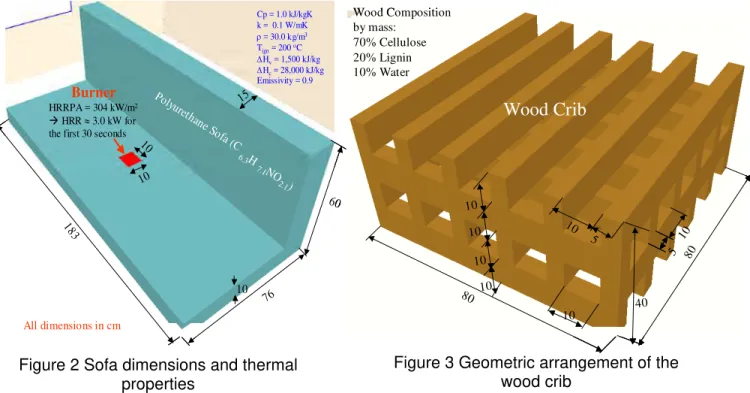
Figure 4 compares the temporal change of the HRRs for all scenarios. Having only one exterior opening or two exterior openings facing each other with different sizes resulted in a good mixing between the inflow (entering the compartment through the opening/s) and the combustion products inside the compartment. This kind of mixing generated vortices and eddies that caused non-uniform oxygen concentration in the vicinity of the flame sheet. As such, a flickering flame was produced [8]. A high HRR was predicted when the flame surface happened to exist in a domain of higher oxygen concentration and vice versa. Consequently, the HRR fluctuated up and down with time during the period of burning the polyurethane sofa and wood cribs simultaneously, and in the early stage of burning wood only (see Figure 4). This was the case for all ventilation scenarios except for SC2. In SC2, having two exterior openings with approximately equal size on the walls and facing each other resulted in the flame being approximately vertical and consequently the HRR did not fluctuate up and down with time (Figure 4).
In the late stages of burning wood only, the flame size was small, and the generated vortices and eddies due to the mixing between the inflow and combustion products were not strong enough to produce a flickering flame [8]. As a result, the HRR did not fluctuate up and down with time in this period. This was the case for all ventilation scenarios investigated in this study (Figure 4). In all scenarios, after the HRR decreased and reached its minimum value, it increased again due to the net heat feedback reaching a second peak. The values of both the HRR and the time at the second peak depend on the ventilation scenario.
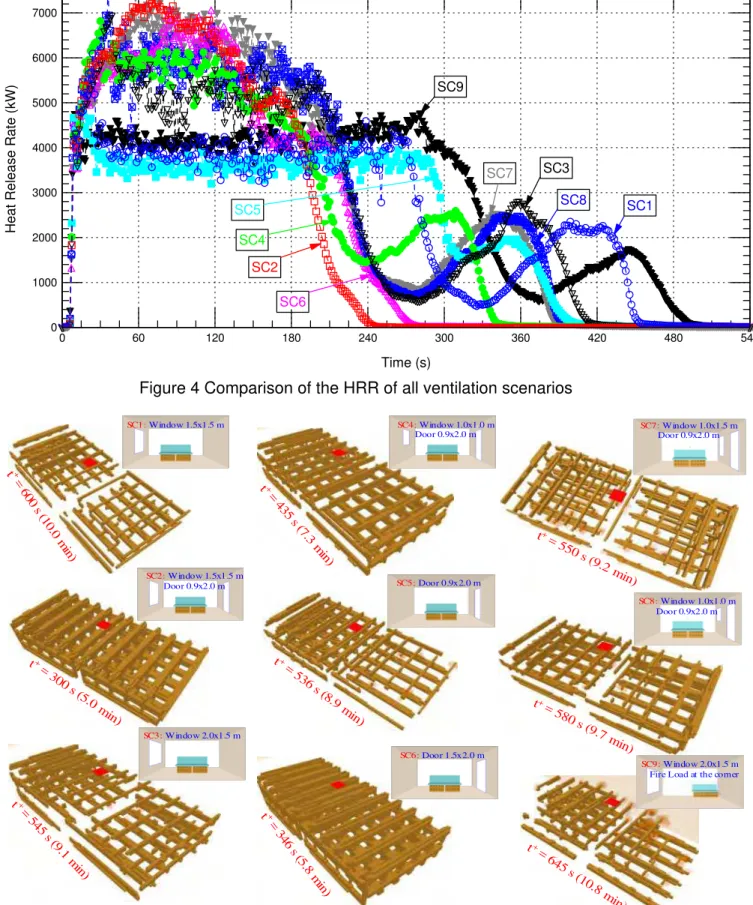
Comparisons of the CFD results of all scenarios are summarized in Table 2 and Table 3. The maximum HRRs for all scenarios were compared in Table 2. Table 2 compares the time at which the polyurethane sofa was completely burned and the mass loss from the wood cribs at this time. Finally, the total mass losses, total energy releases and the effective heat of combustions in all scenarios were compared in Table 3. Comparison of the status of the fire load for all scenarios when the fire was completely extinguished (HRR ~1 kW) are shown in Figure 5. As shown in these tables, and Figure 4 and Figure 5, the following observations are based on the CFD results of nine scenarios:
• Ventilation scenario SC8 had the highest maximum HRR (7,450 kW) and occurred after 36 s from initiating the fire. This scenario used two exterior openings (window and door) located on the same wall (3.8 m side).
• Ventilation scenario SC9 (fire load was located at one of the corners of the room) had the lowest maximum HRR (4,760 kW) and occurred after 282 s from initiating the fire. • The polyurethane sofa took the longest period to be completely burned in SC9 (283
s).
• The polyurethane sofa took the shortest period to be completely burned in SC2 (158 s).
• Ventilation scenario SC1 had the largest total mass loss (79.1 kg) (70.9 kg wood and 8.3 kg polyurethane sofa). Only 15.9 kg (18% by mass) of the wood was left when the fire was completely extinguished.
• Ventilation scenario SC2 had the smallest total mass loss (68.0 kg) (59.7 kg wood and 8.3 kg polyurethane sofa). At the end of the simulation where the fire was
0 1000 2000 3000 4000 5000 6000 7000 0 60 120 180 240 300 360 420 480 540 SC8 SC7 SC9 SC3 SC5 SC1 SC4 SC6 SC2 Time (s) H eat Release R a te ( k W )
Figure 4 Comparison of the HRR of all ventilation scenarios
t+ = 5 45 s ( 9.1 m in) SC3:Window 2.0x1.5 m t+ = 4 35 s (7.3 m in) SC4:Window 1.0x1.0 m Door 0.9x2.0 m t+ = 3 46 s (5 .8 m in) SC6:Door 1.5x2.0 m t+ = 536 s (8.9 m in) SC5:Door 0.9x2.0 m t+ = 55 0 s ( 9.2 min ) SC7:Window 1.0x1.5 m Door 0.9x2.0 m t+ = 6 00 s (1 0.0 m in) SC1:Window 1.5x1.5 m t+ = 300 s (5.0 mi n) SC2:Window 1.5x1.5 m Door 0.9x2.0 m SC8:Window 1.0x1.0 m Door 0.9x2.0 m t+ = 58 0 s (9.7 min) SC9:Window 2.0x1.5 m Fire Load at the corner
t+ = 6 45 s (1 0.8 m in) t+ = 5 45 s ( 9.1 m in) t+ = 5 45 s ( 9.1 m in) SC3:Window 2.0x1.5 m SC3:Window 2.0x1.5 m t+ = 4 35 s (7.3 m in) t+ = 4 35 s (7.3 m in) SC4:Window 1.0x1.0 m Door 0.9x2.0 m SC4:Window 1.0x1.0 m Door 0.9x2.0 m t+ = 3 46 s (5 .8 m in) t+ = 3 46 s (5 .8 m in) SC6:Door 1.5x2.0 m SC6:Door 1.5x2.0 m t+ = 536 s (8.9 m in) t+ = 536 s (8.9 m in) SC5:Door 0.9x2.0 m SC5:Door 0.9x2.0 m t+ = 55 0 s ( 9.2 min ) SC7:Window 1.0x1.5 m Door 0.9x2.0 m t+ = 6 00 s (1 0.0 m in) t+ = 6 00 s (1 0.0 m in) SC1:Window 1.5x1.5 m SC1:Window 1.5x1.5 m t+ = 300 s (5.0 mi n) t+ = 300 s (5.0 mi n) SC2:Window 1.5x1.5 m Door 0.9x2.0 m SC2:Window 1.5x1.5 m Door 0.9x2.0 m SC8:Window 1.0x1.0 m Door 0.9x2.0 m SC8:Window 1.0x1.0 m Door 0.9x2.0 m t+ = 58 0 s (9.7 min) SC9:Window 2.0x1.5 m Fire Load at the corner SC9:Window 2.0x1.5 m Fire Load at the corner
t+ = 6
45 s (1 0.8 m
in)
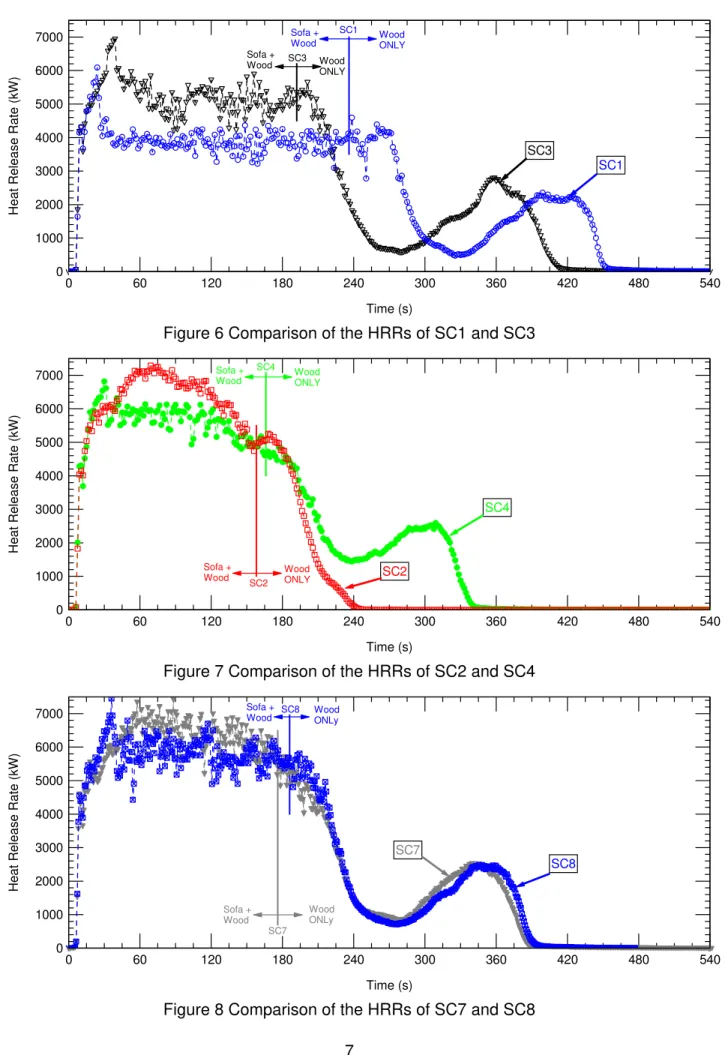
7 0 1000 2000 3000 4000 5000 6000 7000 0 60 120 180 240 300 360 420 480 540 SC1 SC3 Sofa + Wood Wood ONLY Wood ONLY Sofa + Wood SC3 SC1 Time (s)
Heat Release Rate (k
W)
Figure 6 Comparison of the HRRs of SC1 and SC3
0 1000 2000 3000 4000 5000 6000 7000 0 60 120 180 240 300 360 420 480 540 SC2 SC4 Wood ONLY Sofa + Wood Sofa +
Wood WoodONLY
SC4
SC2
Time (s)
Heat Release Rate (k
W)
Figure 7 Comparison of the HRRs of SC2 and SC4
0 1000 2000 3000 4000 5000 6000 7000 0 60 120 180 240 300 360 420 480 540 SC7 Sofa + Wood Wood ONLy Sofa +
Wood WoodONLy SC8 SC8 SC7 Time (s) Heat Rel ease Rat e ( k W)
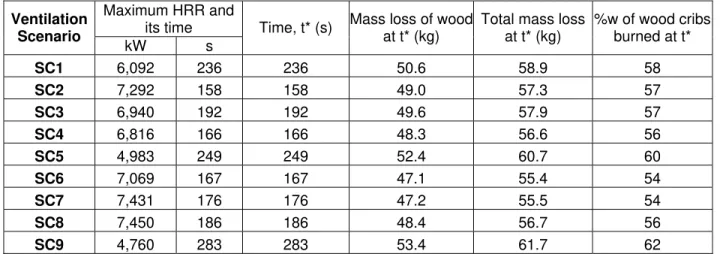
Table 2 Comparison of maximum HRR, and the status of the wood cribs at time = t* at which was sofa completely burned
Maximum HRR and its time Ventilation
Scenario
kW s
Time, t* (s) Mass loss of wood at t* (kg)
Total mass loss at t* (kg) %w of wood cribs burned at t* SC1 6,092 236 236 50.6 58.9 58 SC2 7,292 158 158 49.0 57.3 57 SC3 6,940 192 192 49.6 57.9 57 SC4 6,816 166 166 48.3 56.6 56 SC5 4,983 249 249 52.4 60.7 60 SC6 7,069 167 167 47.1 55.4 54 SC7 7,431 176 176 47.2 55.5 54 SC8 7,450 186 186 48.4 56.7 56 SC9 4,760 283 283 53.4 61.7 62
Table 3 Comparison of total mass losses, total energy releases and effective heat of combustions Ventilation Scenario Total burned mass of wood cribs (kg) Total burned mass (sofa + wood cribs) (kg) Total remaining mass of wood cribs (kg) %w of total remaining mass of the wood cribs Total energy released (MJ) Effective heat of combustion (MJ/kg) SC1 70.9 79.1 15.9 18 1,317 16.6 SC2 59.7 68.0 27.0 31 1,169 17.2 SC3 69.9 78.2 16.8 19 1,398 17.9 SC4 68.8 77.1 17.9 21 1,304 16.9 SC5 68.4 76.7 18.3 21 1,219 15.9 SC6 61.2 69.5 25.6 29 1,198 17.2 SC7 69.6 77.9 17.1 20 1,515 19.4 SC8 69.3 77.6 17.4 20 1470 18.9 SC9 69.5 77.8 17.2 20 1,511 19.4
Effect of window size on the fire characteristics
In this section, the effect of the window size on the fire characteristics is investigated. Figure 6 compares the HRR for SC1 and SC3. Scenario SC1 had a square window of a size of 1.5 m. While scenario SC3 had a rectangular window of a size of 2.0 m wide and 1.5 m high. In these scenarios, the fire load was located at the center of the room, and the coordinate (in meters) of the center of the windows was (0.0,1.9,1.25). As shown in Figure 6, there was a significant effect on the fire characteristics during the period of burning in these scenarios. The maximum HRR in SC3 (6,940 kW, occurred at time = 39 s) was higher than that in SC1 (6,092 kW,
occurred at time = 24 s). It took a shorter time for the sofa to be completely burned in SC3 (192 s) than in SC1 (236 s). At these times, the HRRs in SC1 and SC3 were 4,118 kW and 5,356 kW, respectively. The HRR reached its minimum value in SC3 (581 kW at 279 s) 46 s faster than in scenario SC1 (479 kW at 325 s). Additionally, the second peak of HRR was reached in
9
SC3 (2,799 kW at 358 s) 41 s faster than in SC1 (2,353 kW at 399 s). The fire was
extinguished (HRR ~ 1 kW) after 600 s and 545 s in SC1 and SC3, respectively. The total remaining masses from the wood cribs were 18% and 19% (by mass) in SC1 and SC3, respectively. Because of the larger window size in SC3, the effective heat of combustion was ~8% higher in SC3 (17.9 MJ/kg) than in SC1 (16.6 MJ/kg). In other words, the mass of CO production in SC3 was higher than that in SC1.
Figure 7 compares the HRR for SC2 and SC4. Scenarios SC2 and SC4 had a square window of a size of 1.5 m and 1.0 m, respectively. The coordinates of the center of the windows were located at (0.0,1.9,1.25) and (0.0, 1.9, 1.5) for SC2 and SC4, respectively. Both scenarios had a door of external rectangular of a size of 0.9 m wide and 2.0 m high and its center was located at (4.2, 1.9, 1.0). The fire load was located at the center of the room in both scenarios. Figure 7 shows that the temporal change of the HRRs in these scenarios were different. For example, the HRR at its second peak in SC2 (5,258 kW) was much higher and achieved 141 s faster (at 168 s) than that in SC4 (2,591 kW at 309 s). The minimum HRR before reaching its second peak in SC2 (4,744 kW occurred at time = 156 s) was also much higher than that in SC4 (1,442 kW, occurred at time = 238 s). In these two scenarios, the sofa took about the same time to be completely burned (158 s and 166 s in SC2 and SC4, respectively). The maximum HRRs in SC2 and SC4 were 7,292 and 6,816 kW, respectively. The remaining mass from the wood cribs in SC2 with a larger window size was 31% compared to 21% (by mass) in SC4 with a smaller window size. Furthermore, the fire was extinguished (HRR ~ 1 kW) after 300 s in SC2
compared to 435 s in SC4.
Figure 8 compares the HRR when both window and door were located in the same wall (3.8 m side) in scenarios SC7 and SC8. SC7 employed a rectangular window of a size of 1.0 m wide and 1.5 m high, while SC8 employed a square window of a size of 1.0 m. The coordinates of the windows were located at (4.2,2.85,1.25) and (4.2,2.85,1.5) in SC7 and SC8, respectively. A door of a size of 0.9 m wide and 2.0 m high was used in both scenarios. As shown in Figure 8, there was insignificant difference in the fire characteristics during the whole period of burning in these scenarios. For example, the maximum HRRs were about the same in both scenarios (7,431 kW and 7,450 kW in SC7 and SC8, respectively). The sofa was completely burned at 176 s and 186 s in SC7 and SC8, respectively. Additionally, the remaining mass from the wood cribs was the same in both scenarios (20% by mass).
In summary, in the case of having a window and door in the same wall, the size of the window had insignificant effect on the fire characteristics (see SC7 and SC8). However, the size of the window had a significant effect on the fire characteristics (in terms of maximum HRR, period of burning, remaining mass of the fire load, effective heat of combustion, … etc) in the cases of employing (a) a window and door facing each other (see SC2 and SC4), and (b) only window (see SC1 and SC3).
5. Summary and Conclusions
Nine ventilation scenarios were investigated in order to identify the proper ventilation scheme for conducting design fire tests in a room of a size of 4.2 m length x 3.8 m width x 2.4 m height. The fire load that was used in all scenarios consisted of a polyurethane sofa and two wood cribs underneath it. The total mass of the polyurethane sofa and two wood cribs were 8.3 kg and 86.7 kg, respectively. In scenarios SC1 through SC8, the fire load was located at the center of the room. In scenario SC9, however, the fire load was located in one corner of the room. The ventilation schemes in all scenarios were based on using exterior square/ rectangular openings to represent window, door, or both with different sizes.
The FDS version 5 was used to simulate these scenarios. Before conducting the CFD
simulations for all scenarios, numerical tests and debugging were carried out in order to (a) find the optimum mesh size, and (b) test the validity of the new combustion model in FDS version 5. It was found that increasing the size of a stretched mesh (in x- and y- directions) beyond
100x75x96 has insignificant effect on the results. Therefore, a stretched mesh of a size of 100x75x96 was used in all ventilation scenarios. Also, it was found that the predicted effective heat of combustion of wood was in good agreement with that obtained from Babrauskas’ correlation [6]. This good agreement confirmed the soundness of both the modified mixture friction combustion model and pyrolysis model in FDS version 5.
The CFD results showed that a maximum heat release rate of about ~7,000 kW was achievable in some of the scenarios. In the case of having a window and door on the same side of the wall, the size of the window had insignificant effect on the fire characteristics as in SC7 and SC8. However, in the cases with a window and door facing each other as in SC2 and SC4, and only window as in SC1 and SC3, the size of the window had a significant effect on the fire
characteristics.
ACKNOWLEDGEMENTS – The authors acknowledge Dr. Gary Lougheed and Dr. Joseph Su for their valuable feedback, comments and suggestions about this paper.
6. References
1. Bwalya, A., Carpenter, D., Kanabus-Kaminska, M., Lougheed, G., Su, J., Taber, B.,
Bénichou, N., Kashef, A., McCartney, C., Bounagui, A., and Thomas, R. “Development of A Fuel Package for Use in the Fire Performance of Houses Project” Research Report: IRC-RR-207, March 2006.
2. Taber, B., Bwalya, A., McCartney, C., Bénichou, N., Bounagui, A., Carpenter, D., Crampton, G., Kanabus-Kaminska, M., Kashef, A., Leroux, P., Lougheed, G., Su, J., and Thomas, R. “Fire Scenario Tests in Fire Performance of Houses Test Facility – Data Compilation” Research Report: NRC-IRC-RR-208, March 2006.
3. McGrattan, K., Baum, H., Rehm, R., Hostikka, S., and Floyd, J., “Fire Dynamics Simulator (Version 5) Technical Reference Guide”, NIST Special Publication 1018-5, October 2007. 4. McGrattan, K., Klein, B., Hostikka, S., and Floyd, J., “Fire Dynamics Simulator (Version 5)
User’s Guide” NIST Special Publication 1019-5, October 2007.
5. McGrattan, K. B., Baum, H. R., Rehm, R. G., Forney, G. P., Floyd, J. E., Hostikka, S., Fire Dynamics Simulator (Version 4), Technical Reference Guide (Technical Report NISTIR 6783), National Institute of Standards and Technology, Gaithersburg, Maryland, Sept. 2003. 6. Babrauskas, V., “Effective Heat of combustion for flaming combustion of Conifers”, Van. J.
For. Res. 36, pp. 659-663, 2006.
7. Walton, W. D., and Thomas, P. H., “Estimating Temperatures in Compartment Fires”, section 3, Chapter 6, The SFPE Handbook of Fire Protection Engineering, 3rd Edition, 2002. 8. Saber, H. H.,