HAL Id: tel-02434146
https://hal.archives-ouvertes.fr/tel-02434146
Submitted on 14 Jan 2020HAL is a multi-disciplinary open access archive for the deposit and dissemination of sci-entific research documents, whether they are pub-lished or not. The documents may come from teaching and research institutions in France or abroad, or from public or private research centers.
L’archive ouverte pluridisciplinaire HAL, est destinée au dépôt et à la diffusion de documents scientifiques de niveau recherche, publiés ou non, émanant des établissements d’enseignement et de recherche français ou étrangers, des laboratoires publics ou privés.
Clustering Nature of Base Station and Traffic Demand
in Cellular Networks and the Corresponding Caching
and Multicast Strategies
Yifan Zhou
To cite this version:
Yifan Zhou. Clustering Nature of Base Station and Traffic Demand in Cellular Networks and the Corresponding Caching and Multicast Strategies. Signal and Image processing. Centrale Supélec, 2018. English. �tel-02434146�
ANNÉE 2018
THÈSE EN COTUTELLE
pour obtenir le grade de Docteur délivré par
UNIVERSITE DU ZHEJIANG
Spécialité : Ingénierie de l'information et des Communications
Ecole doctorale : 0810
***
CENTRALESUPÉLEC
sous le sceau de l’Université Bretagne Loire
Spécialité : Télécommunications
Ecole doctorale 601 MathSTIC
présentée par
Yifan ZHOU
Préparée à
Collège des sciences de l'information et Ingénierie électronique
UMR 6164 - IETR - Institut d’Electronique et de Télécommunications de
Rennes
Titre de la thèse
Clustering Nature of Base
Station and Traffic Demand in
Cellular Networks and the
Corresponding Caching and
Multicast Strategies
Thèse soutenue à Rennes
le 3
/7/2018
devant le jury composé de :
Youping ZHAO
Fonction + établissement / rapporteur
Aline
Fonction + établissement / rapporteur
Jacques PALICOT
Fonction + établissement / examinateur
Xianfu CHEN
Fonction + établissement / examinateur
Yves LOUET
Fonction + établissement / directeur de thèse
Honggang ZHANG
Institutional Acknowledgements
This work has received a French government support granted to the CominLabs excellence laboratory and managed by the National Research Agency in the ”Investing for the Future” program under reference No. ANR-10-LABX-07-01. The authors would also like to thank the Region Bretagne, France, for its support of this work.
Acknowledgements
First of all, I would like to express my sincere gratitude to my thesis advisors Yves Louët, Hong-gang Zhang and Jacques Palicot for giving me the chance to pursuit the joint doctoral degree between CentraleSupélec and Zhejiang university. I’m greatly honoured to have lived and stud-ied in Campus Rennes for one year. During my stay, the colleagues and friends impressed me so much with their warm helps and patient guidances, not to mention the productive environment and French humors. I would also like to thank Christophe Moy, Carlos Bader, Karine Bernard, Amor Nakfha and Pascal Cotret for their helps and regards.
Moreover, I had the pleasure to work with a very friendly team. I would like to thank Navikku-mar Modi, Quentin Bodinier, Remi Bonnefoi, Mouna Ben Mabrouk, Haïfa Farès, Marwa Chaffi, Vincent Gouldieff, Lilian Besson, Muhammad Abdul Wahab and Rami Othman for their kind-ness and company. During my stay in Rennes, I have also made acquaintance with many Chinese friends. I would to thank Qipeng Song, Jialong Duan, Yue Li and Hao Jiang for their understanding and suggestions.
Finally, I would like to thank my family for their enduring love and support.
Abstract
Traditional cellular networks have evolved from the first generation of analog communications to the current fourth generation of digital communications where iteratively enhanced physical layer technologies have greatly increased the network capacity. According to Shannon’s theory, the technical gains brought by physical layer has gradually become saturated, which cannot match the rapid increase of user traffic demand in current mobile internet era, thus calls for another path of evolution, i.e., digging into the traffic demand of mobile users. In recent years, the academic communities have begun to use the real data to analyze the infrastructure deployment of wireless networks and the traffic demand of mobile users, in order to make benefits from the underlying statistical patterns. At the same time, along with the recent rise of machine learning technics, data-driven service is considered as the next economic growth point. Thus the industry is putting more and more attention on data accumulation and knowledge mining related services and telecommunication operators are coming to realize the increasing importance of the recorded data from their own networks. Therefore, the real-data-driven technology advancement is considered as a promising direction for the next evolution of cellular networks.
In this thesis, we firstly gave a comprehensive review of the state-of-the-art real data measure-ments in Chapter 2 which not only sheds light on the importance of real data analysis, but also paves way for its reasonable usage to improve the service performance of cellular networks. From the survey, we concluded that there exhibits a periodic pattern for the temporal traf-fic assumption of large coverage area in cellular networks, while for single cell, a heavy-tailed distribution is widespread across the temporal and spatial characterization. Furthermore, this imbalance phenomenon emerges more significantly in the call duration, request arrivals and content preference of mobile users.
Then, based on a large amount of real data collected from on-operating cellular networks, we conducted a large-scale identification on spatial modeling of base stations (BSs) in Chapter
3. According to the fitting results, we verified the inaccuracy of Poisson distribution for BS locations, and uncovered the clustering nature of BS deployment in cellular networks. However,
Abstract vi although typical clustering models have improved the modeling accuracy but are still not qual-ified to accurately reproduce the practical BSs deployment, which leads to the spatial density characterization of BS.
In Chapter4, we tried to characterize the density of BS deployment and traffic demand, in both spatial domain and temporal dimensions. In accordance with the heavy-tailed phenomenons in Chapter 2, we found that the α-Stable distribution is the most accurate model for the spatial densities of BSs and traffic consumption, between which a linear dependence is revealed through real data examination. Moreover, the accuracies of power-law and lognormal distributions for the packet length and inter-arrival time of user requests are verified, respectively, which convincingly leads to the α-Stable distribution of temporally aggregated traffic volume on BS level.
To make benefit from the findings in previous chapters, we proposed a cooperative caching strategy based on the spatial clustering of BSs and a dynamic unicast/multicast strategy based on the temporal aggregation of content requests in Chapter5. According to the theoretical and simulation results, we found that the proposed ‘Caching as a Cluster’ strategy can significantly reduce the average delay of users especially in the inhomogeneous BS deployment scenario, and the dynamic unicast/multicast strategy can not only reduce the average latency of content requests but also diminish the average power consumption of BSs especially under the bursty request arrival patterns.
To implement the massive real data analyses and dynamic serving mechanisms aforementioned, we proposed an intelligent SDN-based centralized architecture within cellular networks in Chap-ter5. With the introduction of an intelligence center, the brand new architecture is able to trace the demand variations in real time, thus simultaneously satisfy the operational requirements of the entire network and QoEs of all users by deploying flexible and efficient algorithms upon it. Conclusively, in this thesis, we uncovered the clustering nature of cellular networks in different dimensions, and proposed corresponding service strategies to tackle the clustering challenge and utilize them for efficiency improvement.
Contents
Acknowledgements iii Abbreviations xi 1 Introduction 1 1.1 Background . . . 1 1.2 Research Topics. . . 2 1.3 Contributions . . . 42 Real Data Measurements in Cellular Networks: Unveiling the Statue 7 2.1 Introduction. . . 7
2.1.1 Cellular Networks Architecture . . . 8
2.1.2 The Importance of Real Data in Cellular Networks Research . . . 9
2.2 Real Traffic Measurements in Cellular Networks. . . 13
2.2.1 Temporal Characterization of Cellular Traffic . . . 13
2.2.2 Spatial Characterization of Cellular Traffic . . . 18
2.2.3 Content Preference of Cellular Traffic . . . 21
2.3 Joint Characterization of Different Dimensions . . . 23
2.3.1 Spatial-Temporal Characterization . . . 24
2.3.2 Spatial and Content Combination . . . 24
2.3.3 Temporal and Content Combination . . . 25
2.4 Conclusion . . . 26
3 Spatial Modeling of Base Stations: Challenging the Convention 29 3.1 Introduction. . . 30
3.1.1 Background . . . 30
3.1.2 Related Works . . . 31
3.1.3 Our Approaches and Contributions. . . 32
3.2 Real Data Description . . . 34
3.2.1 BS Locations in Large-scale Areas . . . 35
3.2.2 Small-region Samples of BS Locations . . . 36
3.3 Spatial Point Process Models . . . 38
3.3.1 Completely Random Processes . . . 38
3.3.2 Regular Point Processes . . . 39
3.3.3 Clustered Point Processes . . . 41
3.4 Fitting Methods and Evaluation Statistics . . . 42 vii
Contents viii
3.4.1 Fitting Methods for Point Processes . . . 42
3.4.2 Goodness-of-Fit Evaluation Statistics . . . 43
3.5 Fitting Results: Case Studies and Large-scale Identification . . . 45
3.5.1 Case Studies for Different Scenarios . . . 45
3.5.2 Large-scale Spatial Modeling Identification . . . 51
3.6 Conclusion and Discussion . . . 57
4 Clustering Nature in Cellular Networks: Connecting the Dots 59 4.1 Introduction. . . 60
4.1.1 Background . . . 60
4.1.2 Related Works . . . 62
4.1.3 Approach and Contributions . . . 63
4.2 Mathematical Preliminary . . . 64
4.2.1 Heavy-tailed Distribution . . . 64
4.2.2 The α-Stable Distribution . . . 65
4.3 BS Density in Cellular Networks . . . 66
4.3.1 Data Description . . . 66
4.3.2 Fitting and Evaluation. . . 67
4.3.3 Conclusion . . . 70
4.4 Spatial Density of User Traffic Demands . . . 70
4.4.1 Data Description . . . 71
4.4.2 Spatial Distribution of Traffic Demand . . . 71
4.4.3 Linear Dependence Between BSs and Traffic. . . 72
4.5 Temporal Characterization of Mobile Instant Message . . . 73
4.5.1 Data Description . . . 74
4.5.2 Fitting and Evaluation. . . 74
4.6 Conclusion and Discussion . . . 78
4.6.1 Connecting the Dots . . . 79
5 Cooperative Caching and Dynamic Multicast: Making Cluster Benefit 81 5.1 Introduction. . . 82
5.1.1 Background . . . 82
5.1.2 Related Works . . . 82
5.1.3 Approach and Contributions . . . 85
5.2 Clustering-based Cooperative Caching in Cellular Networks . . . 86
5.2.1 Motivation and Objectives. . . 86
5.2.2 Model Description and Problem Formulation . . . 88
5.2.3 Probabilistic Cooperative Caching Strategy . . . 90
5.2.4 Performance Evaluation . . . 91
5.2.5 Conclusion . . . 96
5.3 Clustering-oriented Multicast in Cellular Networks . . . 96
5.3.1 Motivation and Objectives. . . 96
5.3.2 Unicast/Multicast Strategy Analysis under Poisson Arrivals . . . 98
5.3.3 Unicast/Multicast Strategy Analysis under Bursty Arrivals . . . 107
5.3.4 Summary . . . 118
5.4 Intelligent SDN Architecture for Smart Caching and Dynamic Multicast . . . 118
Contents ix
6 Conclusion and Future Works 123
6.1 Conclusion . . . 123
6.2 Future Works . . . 125
A List of Publications 127
A.1 Journal Papers . . . 127
A.2 International Conference Papers . . . 128
A.3 Seminars or Presentations . . . 128
List of Figures 129
List of Tables 135
Abbreviations
3GPP 3rd Generation Partnership Project QoE Quality of Experience
PPP Poisson Point Process
BS Base Station
UE User Equipment
RMSE Root Mean Square Error SDN Software Defined Networking RAN Radio Access Network
CN Core Networks
GSM Global System for Mobile communications UMTS Universal Mobile Telecommunications System LTE Long-Term Evolution
BSS Base Station Subsystem BTS Base Transceiving Stations SINR Signal to Interference Noise Ratio BSC Base Station Controllers
NSS Network and Switching Subsystem MSC Mobile Switching Centers
UE User Equipment
HLR Home Location Register VLR Visitor Location Register
UTRAN Universal Terrestrial Radio Access Network RNC Radio Network Controllers
GPRS General Packet Radio Service SGSN Serving GPRS Support Node GGSN Gateway GPRS support node EPC Enhanced Packet Core
SGW Serving Gateways PGW Packet Gateways CDR Call Detail Records
Abbreviations xii RRC Radio Resource Control
CDMA Code Division Multiple Access PDF Probability Density Function HSPA High-Speed Packet Access CDN Content Delivery Networks HTTP HyperText Transfer Protocol
OTT Over the Top
SMS Short Messages Service MCP Matern Cluster Process TCP Thomas Cluster Process PHCP Poisson Hardcore Process SIR Signal to Interference Ratio MIM Mobile Instant Message GP generalized Pareto
MLE Maximum Likelihood Estimation CDF Cumulative Distribution Function
Chapter 1
Introduction
Contents 1.1 Background. . . . 1 1.2 Research Topics . . . . 2 1.3 Contributions . . . . 41.1
Background
With the world-spread popularity of smart devices, including phones, tablets and numerous virtual reality devices, the mobile user traffic demand is increasing exponentially, unlike the traditional voice service generations ago. According to the latest Cisco visual networking index white paper, there will be another 8-fold increase of mobile traffic (i.e., from 3.7 to 30.6 exabytes per month from 2015 to 2020) [23]. Driven by this tremendous data consumption and higher quality-of-experience (QoE) requirement, research groups including academics and industrials, devote themselves to upgrade the cellular networks by looking into the user demand dynamics and proposing brand new technologies.
On one hand, with the amazing development of big data technologies these years, operators are coming to realize the increasing importance of recorded data from their own networks. Thus, more and more real data are put into investigation by the operators themselves or contributed to related researchers aiming to reveal the inherit patterns of mobile user activities and mobile traffic. On the other hand, along with the 3rd generation partnership project (3GPP) releases, many researchers are working on new architecture or algorithm to increase the network capacity and improving the QoE of mobile subscribers. However, the effectiveness or efficiency of these new kinds of technologies in cellular networks need to be verified based on extensive real data measurements.
Chapter 1. Introduction 2 To make full use of these methodologies in two different directions, the best way is to combine these two methods together smoothly. That’s to say, based on the real data examination part, large-scale identification can give rise to accurate and reasonable characterizing models which can be adopted in the technology verification part. Actually, the research topics of real data in cellular networks include traffic, base stations (BSs) and mobile users, along with their spatial and temporal distributions. Therefore, these realistic mathematical models can be adopted as preliminary assumptions for academical and industrial research, such as the recently popular stochastic geometry domain which is based on the homogeneous poisson point process (PPP) distribution of BSs or mobile users.
Furthermore, besides the verification benefits of realistic network models, what makes real data so important is that the dynamics of users’ traffic patterns or the so-called evolution of cellular networks can only be reflected by real network measurements. For example, the exponential distribution is usually adopted as the arrival pattern of user traffic in 3GPP’s protocol design. However, due to the explosively growing user number and traffic amount these years, the bursty nature of cellular networks is becoming more and more universal which makes the exponential assumption not reliable any more.
1.2
Research Topics
This thesis focuses on the unveiling of clustering nature in cellular networks, and evaluate their potential impacts on the service performance.
Firstly in Chapter2, we gave a comprehensive review on the statistical characteristics of traffic demand in cellular networks on different dimensions (space, time and content). In detail, we reviewed the state-of-the-art temporal analysis of cellular traffic consumption, on both macro view (aggregated traffic on cells or upper level) and micro view (individual traffic of user or application level). According to related works, the traffic demand in cellular networks exhibits universal clustering nature on different time scales and on different aggregation levels. In paral-lel, we also introduced the spatial examination of traffic demand, and it also expresses significant level of aggregation effect. At last, besides the temporal and spatial dimensions, we also revealed the heavy-tailed property of traffic demand on content dimension. That’s to say, mobile users tend to request the same content and the popularity distribution of possible requested contents is distinctly unbalanced. Furthermore, it’s important to know that the statistical features of cellular traffic basically result from the usage pattern of mobile users, on all three different dimensions. Therefore, we can conclude that the mobile users in cellular networks are also clusteringly distributed, their temporal usages of traffic are also aggregated and their content preferences are more or less similarly concentrated.
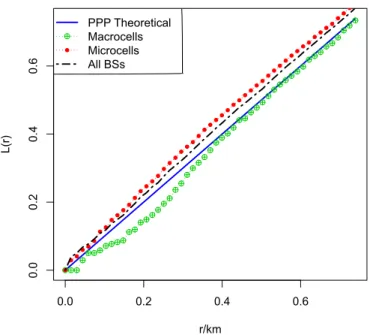
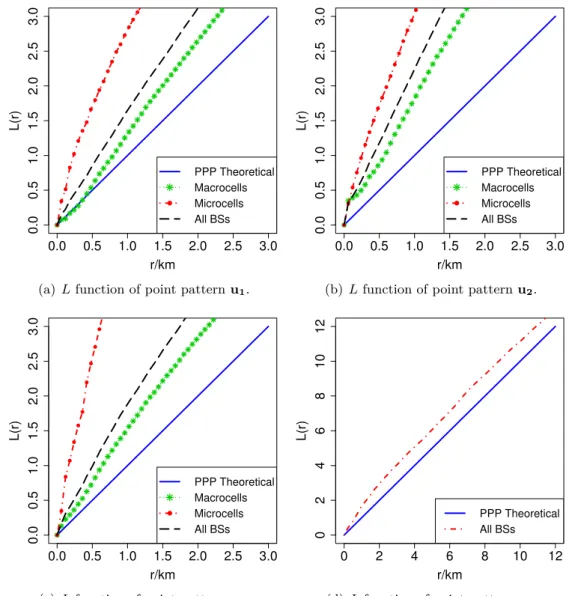
Chapter 1. Introduction 3 After that, based on a large amount of real data from on-operating cellular networks, we in-vestigated the spatial distribution of BSs. In detail, the BS locations are examined firstly to check the traditional assumptions, such as the hexagonal placement and homogeneous PPP. According to the fitting results, the widely adopted spatial models are inappropriate for the real deployment. Therefore, we conducted a large-scale comprehensive identification of BS spatial distribution in cellular networks, considering a variety of popular two-dimensional point pro-cesses including repulsive and attractive ones, and tried to figure out the most accurate spatial model for both macro and micro BSs. Unfortunately, based on those extensive real data, all of these well understood point processes are not qualified enough to characterize the realistic BSs distribution according to the random verifications and multiple performance metrics. Details can be found in Chapter3.
Since the two-dimensional point processes are not qualified to characterize the realistic BSs’ spa-tial distribution, we turned to the one-dimensional spaspa-tial density distribution of BSs in cellular networks. Based on the same set of real data, we conducted a general fitting process to find the most accurate statistical distribution of BSs’ spatial density. After random area sampling in the under-investigated cellular networks, we choose several popular probability density func-tions (PDFs), including power-law, Weibull, log-normal and α-Stable distribution along with the traditional Poisson distribution as candidates for the fitting procedure. According to the root mean square error (RMSE) performance metric, we found that the α-Stable distribution can best reflects the clustering nature of BS deployment in cellular networks. Besides, along with the spatial distribution of BS, we tried to connect the dots between the data traffic and the mobile user distribution. After examining the spatial distribution of these three dynamics, we found out that the spatial density of users, traffic and BSs are linearly growing with each other, revealing a trinity-like entangled phenomenon. Details can be found in Chapter4. After revealing the clustering nature of cellular networks in different dimensions, we wanted to make good use of these unconventional properties. For example, by combining the content preference of mobile users and the spatial clustering of BSs, we investigated the distributed probabilistic caching strategy in the clustered heterogeneous cellular networks, based on the cooperation between BSs in the same spatial group. Assuming that nearby BS pairs share a limited interchangeable bandwidth, the ‘Caching as a Cluster’ type of BS collaboration helps to reduce the overall content delivery latency of mobile users in BS caching scenarios, as been illustrated in the first part of Chapter5.
Besides, considering the temporal burstiness of traffic demand and spatial clustering of BSs, there is a chance for the introduction of BS sleeping strategies into cellular networks to improve the overall energy efficiency. Actually, the basic principle is that the default traffic demand of BS which encounters a low-load situation can be served by the nearby ones with tolerable QoE and inexpensive cost because the BSs are spatial clusteringly distributed. Intuitively, in this
Chapter 1. Introduction 4 cluster scenario, the overall performance will be better than that of the homogeneous case. In fact, this topic has been widely studied in the green communication fields in these year, and related works can be found in Chapter 2. As we focus on the caching and multicast, so the BS sleeping is not covered in this thesis and will be considered as future works.
On the other hand, by combining the content preference of mobile users and the temporal bursty nature of traffic demand, we can adopt the multicast technic in cellular networks considering its broadcasting nature, in order to diminish the number of wireless transmissions and ensure the QoE requirement of users at the mean time. In this case, the spatially clustering nature of mobile user is another necessity to make the multicast procedure practical and beneficial. Thus, three dimensional aggregation properties are all considered in this scenario, which can make a noticeable difference on the capacity improvement comparing to the traditional broadcasting technics in wireless networks. All these technics based on different combination of clustering dimension are introduce in the second part of Chapter5.
Above all, given these clustering nature of mobile users, traffic demand and BSs on different di-mensions (i.e. temporal, spatial and content), which are certificated by massive real data, a new paradigm of service procedure can be explored. That’s to say, firstly analyzing the statistical characteristics of both mobile user and fixed infrastructure by collecting dynamic registration or static deployment records, then monitoring the overall traffic demand by collecting the online content requests distributively, finally go through a centralized processor with holistic infor-mation to provide a globally optimized service solution. In fact, this kind of service paradigm needs high-performance data processing technics like data mining, traffic prediction methods, along with high-capacity central controller for fast and reliable instruction delivery and this task provides a appropriate scenario for big data technology and software defined networking (SDN) paradigm. This new centralized architecture along with two use cases (i.e., caching and multicast) are introduced in the third part of Chapter5.
1.3
Contributions
The contributions of this thesis can be concluded to several parts as follows.
Firstly, we gave a comprehensive review of the state-of-the-art real data measurement in cellu-lar networks. Specifically, the related works cover those data analysis in mobile users, traffic aggregation and network infrastructure, on different dimensions including temporal, spatial and contents, also in different perspectives like resource allocation, QoE and energy efficiency. Most of these measurement results reveal kind of clustering nature in cellular networks.
Secondly, we conducted a large-scale identification on the spatial distribution of BSs in cellu-lar networks, separately on typical urban, rural sample regions and on numbers of randomly
Chapter 1. Introduction 5 selected regions. By choosing most popular point processes as fitting candidates, we tried to find out the most appropriate spatial model for BS locations. However, all these well un-derstood two-dimensional point process models are rejected by the large amount of real data according to either classical statistical or coverage probability performance metrics. After all, instead of pursuing a two-dimensional point process model for spatial distribution, we turned to the one-dimensional BS density distribution characterization and find out that α-Stable is the most accurate statistical distribution for BS and traffic demand density reflecting the explicit clustering nature of infrastructure deployment in cellular networks.
Thirdly, to make full use of the clustering nature of user requested contents and the spatial distribution of BSs, we introduced a collaborative caching strategy in clustered cellular networks where small BSs within the same cluster can exchange contents with each other constrained by a given bandwidth. According to the simulation results, we found that the cooperation scheme can reduce the average content delivery latency of mobile users significantly. Besides, we investigated the impact of BS density on the caching performance, and provided a overall latency evaluation of the clusteringly distributed cellular networks.
Fourthly, considering the clustering nature on time and content dimension of mobile users traffic demand, we proposed to adopt the multicast technics into cellular networks. Before diving into the utilization of temporal burst nature of content requests, we firstly derived the theoretical result on the average latency of user requests in the Poisson arrival scenario, and based on which the unicast/multicast hybrid transmission strategy is proposed. According to results from both theoretical derivation and simulation verification, we found the introduction of multicast can not only solve the problem that the average latency of user request increases indefinitely with the arrival rate under congestion, but also is able to reduce the average power consumption of BS in the hybrid transmission process due to the natural advantage of one-to-all scheme. Fifthly, we put forward an intelligent-SDN (Software Defined Networking) based centralized architecture within cellular networks. Through the collection of large amount of real-time recording, and the intelligent and efficient algorithms, the proposed architecture provides com-puting and storage resources for the cooperative cache strategy of the access network and the unicast/multicast hybrid transmission strategy at the BS described in previous chapters, in order to achieve highly efficient and real-time service attributes.
Conclusively, this thesis investigated the clustering nature of cellular networks in different di-mensions and utilized them to improve the service efficiency of several well known communi-cation technologies. In addition to the theoretical and simulating analysis, we put forward a promising intelligent controlling architecture packed with machine learning algorithms and SDN technics to make full use of the clustering nature in cellular networks.
Chapter 1. Introduction 6 The presentation of this thesis is organized as follows, Chapter 2firstly gives a comprehensive introduction to the related works in cellular networks traffic measurements; Chapter 3presents a specific investigation on the spatial distribution of BSs based on two-dimensional point process modeling. Furthermore, the α-Stable distribution is introduced to model the spatial density of BS, traffic demand, and temporal aggregation effect in Chapter4. After that, the probabilistic caching strategy based on nearby BSs collaboration is analyzed in Chapter5, along with which the multicast technics utilizing temporal clustering of content requests are also proposed. Above all, after revealing the statistical results and analyzing the technical potentials, an overall intel-ligent controlling architecture is proposed in the last part of Chapter5. After all, the conclusion and future works are given in Chapter 6.
Chapter 2
Real Data Measurements in Cellular
Networks: Unveiling the Statue
Contents
2.1 Introduction . . . . 7
2.1.1 Cellular Networks Architecture . . . 8
2.1.2 The Importance of Real Data in Cellular Networks Research . . . 9
2.2 Real Traffic Measurements in Cellular Networks . . . . 13
2.2.1 Temporal Characterization of Cellular Traffic . . . 13
2.2.2 Spatial Characterization of Cellular Traffic . . . 18
2.2.3 Content Preference of Cellular Traffic . . . 21
2.3 Joint Characterization of Different Dimensions . . . . 23
2.3.1 Spatial-Temporal Characterization . . . 24
2.3.2 Spatial and Content Combination . . . 24
2.3.3 Temporal and Content Combination . . . 25
2.4 Conclusion . . . . 26
This chapter will give a comprehensive review on the real data measurements in cellular net-works, including analysis of mobile users, traffic demand, and BSs. According to the corre-sponding characteristics of each considered subject, the introduction is presented on different dimensions, such as temporal dynamics, spatial distributions or content classification.
2.1
Introduction
After the description of the network architecture, this section will display a broad picture of the real data measurements in cellular networks, focusing on explaining why this field rises as
Chapter 2. Real Data Measurements in Cellular Networks 8 a popular research topic, how important is the real data for the cellular networks research and what would be its benefits for the performance analysis.
2.1.1 Cellular Networks Architecture
Since their invention, cellular networks have been designed as a modular architecture that allows inter-operability among different generations across diverse technologies and distinct requirements. During the past decades, from a functional point of view, the overall structure of cellular networks has been unchanged and physical entities remain grouped into two domains: radio access network (RAN) and core network (CN) domains. The RAN domain provides users with radio resources to access the CN domain (uplink or downlink), while the latter is responsible for the management of services, including the establishment, termination and QoS based parameter reconfiguration. Fig. 2.1 outlines these domains across 2G, 3G, and 4G networks according to the corresponding major standards, i.e., the global system for mobile communications (GSM), the universal mobile telecommunications system (UMTS) and the long-term evolution (LTE), respectively [64].
2G GSM Networks
The RAN domain in 2G networks is named as BS subsystem (BSS). It consists of base transceiv-ing stations (BTS) and BS controllers (BSC). As BTS is responsible for radio transmissions and receptions along with some physical layer processings, a BSC is in charge of a group of BTSs. Moreover, BSC is responsible for the management of radio resources, paging and handover pro-cedures under its coverage area. On the other hand, the CN domain referred to as network and switching subsystem (NSS), only performs circuit-switched function, and it is usually formed by mobile switching centers (MSC) and gateway mobile switching centers which is responsible for voice call control, user equipment (UE) registrations and mobility management. Besides, several major databases useful for managing customers are also included in the CN domain, i.e., the home location register (HLR) which stores the detailed description of registered subscribers, the visitor location register (VLR) which helps for the roaming precedure, the authentication center dealing with the authentication and encryption procedures, and the equipment identity register storing the unique identification of each subscriber.
3G UMTS Networks
The universal terrestrial radio access network (UTRAN) represents the RAN part in UMTS networks and it is composed of NodeBs and radio network controllers (RNC) that match up with BTSs and BSCs in GSM networks. On the other hand, the CN, is divided into two parts:
Chapter 2. Real Data Measurements in Cellular Networks 9 the circuit-switched and packet-switched domains, representing practically a combination of the GSM NSS, and the general packet radio service (GPRS) backbone. We remark that GPRS is a technology between 2G and 3G cellular networks, that provides mobile data services with data rates of a few kbps. The PS domain consists of the serving GPRS Support Node (SGSN) and the gateway GPRS support node (GGSN), responsible for handling packet connections of UEs, security functionalities and mobility management functions as well as data routing.
4G LTE Networks
In contrast to UMTS systems, LTE networks are designed to provide only PS services. The RAN, or so-called Enhanced-UTRAN in 4G era, is only formed by interconnected BSs called eNodeBs, without centralized controlling entities, which is opposed to its preceding technolo-gies. Similarly, the eNodeB takes responsibility for radio-related functions and it is directly connected to the core network, which is referred to as enhanced packet core (EPC). The EPC, that is responsible for the overall control of UEs, includes serving gateways (SGW), packet gateways (PGW) who manages data packets routing and forwarding, as well as network ad-dress allocations, and mobility management entities (MME) performing connection manage-ment. Additionally, by cooperating with the following other entities: home subscriber server, enhanced serving mobile location center, and gateway mobile location center, the MME com-pletes mobility-related and authentication-related tasks. Finally, the EPC also includes a policy control and charging rules function entity orchestrating policy and how control decision makings. For the billing and inter-operator accounting procedures, a set of logical charging functions are implemented in the network. Specifically, these elements collect network resource usages of each customer and implement following functions: the charging trigger function (CTF), which generates charging events based on the observation of network resource usages; the charging data function, which receives charging events from the CTF to construct call detail records (CDR), providing for each user reports concerning his communications; and the charging gate-way function, responsible for validating, reformatting and storing CDRs before sending them to the billing domain [71].
After introducing the overall architecture of cellular networks briefly, following subsections will discuss the real data measurements and their underlying applications in literature.
2.1.2 The Importance of Real Data in Cellular Networks Research
As an important record to reflect the operation of cellular networks, measured real data play an indispensable role in the analysis of network deployment and service efficiency. In recent years, the academic communities have begun to use the real data to analyze the deployment
Chapter 2. Real Data Measurements in Cellular Networks 10
Figure 2.1: The architecture of typical cellular networks with different generations of tech-nologies.
characteristics of cellular networks and service characteristics. At the same time, along with the recent rise of machine learning boom, data-driven service is considered as the next economic growth point, thus the industry is putting more and more attention on data accumulation and knowledge mining related services. More importantly, as the source of real data, operators expect this advantage serves for the business transformation, that is, from a communication provider to a content provider, in order to satisfy the more extensive online demands of mobile users directly. Due to various necessities and the rise of many big data technologies, real data analysis has become a hot topic in cellular networks research. Above all, what kind of potential can real data provide for the performance improvement of cellular networks? In which way can it help researchers to better penetrate into the essential attributes of the system? Here we examine the importance of real data in cellular networks research from three aspects.
Real Data as a Source
As a result of the rapid development during the last decade, cellular networks are becoming more and more complicated, as introduced in the last subsection. Therefore, in order to provide an insight view of the internal structure, real data measurement emerges as an accurate and inexhaustible way as database and processing technologies keep upgrading.
Besides, owing to the overwhelming popularity of smart phones in these years, cellular networks are able to provide an all-weather recording of nearly every subscriber around the world including the locations and communication activities [13] which are usually used for billing purposes only. From this point of view, the real data from global cellular networks may not only provide insights into the system itself, but can also make benefits for many other fields, such as human
Chapter 2. Real Data Measurements in Cellular Networks 11 dynamics [85] [90], city planning [72], traffic prediction [13] and so on. Regarding the related progressive researches, cellular networks actually have been the main contributor of real data worldwide and are promising to reach a general data-fetching platform for inter-field scientific collaboration.
Return to cellular networks analysis itself, actually, the telecommunication operators have been volunteers long time ago to use real data from their own networks to improve the service quality. For example, based on the signal strength across the coverage area and the outage probabilities of different cells, the operators decide where to deploy new BSs and how much is the appropriate transmit power. However, these kinds of usage that lacks overall planning and fundamental principle are not good enough to make full use of real data from cellular networks. As an example, authors in [76] made use of worldwide real data consists of fine-grained RRC (Radio Resource Control) dynamics and provided a detailed analysis of the RRC inter-state timeout setting which significantly contributes to the average latency of user data transmission.
Conclusively, real data in cellular networks can not only be a reliable and active source for problem detection technically, but also provide an accurate and comprehensive source for pattern discovery theoretically.
Real Data as a Standard
Driven by the ever-growing traffic volume and high QoS requirement in cellular networks, a lot of new architectures and technologies have been proposed in recent years claiming that each of them provides more or less performance improvement. However, many propositions of algorithms or methods are merely based on numerical simulations but do not involve any real scenario examination.
Firstly, the performance evaluation solely based on the simulation results is not a wise choice for real network deployment, because it probably underestimates the complexity of actual com-munication environment. Furthermore, the scale of applicability for a specific newly proposed technique is difficult to predefined, i.e., maybe it’s applicable in a single cell but causes un-foreseen severe performance on the system level. Therefore, it’s vital to enroll the real data identification process for all proposed technics in order to make sure the potential adoption will not cause chaos.
Secondly, usually most of the parameters in a simulation are set according to some traditional statistical assumptions which are summarized from real measurements long time ago, such as the path loss models in wireless links and the Poisson distribution of user requests arrival. However, these kind of assumptions need to be verified or adjusted by new measurements from ongoing networks because of the rapid change of communication environments and human dynamics [86].
Chapter 2. Real Data Measurements in Cellular Networks 12 From this point of view, real data should play the role of standard in cellular networks analysis. Besides, unlike decades ago when large scale of measurements were very difficult to be conducted, nowadays data measuring and storing technologies are advanced enough to record every detail of the activities within the cellular networks . Therefore, real data is able to function as a standard to evaluate the various proposed techniques.
Real Data as a Solution
In fact, cellular networks are highly related to other human-related systems, like the transport system, the social networks and the city planning. Commonly, these kind of systems all stem from the daily dynamics of human beings thus showing more or less similarity with each other. From this point of view, real data measurements from cellular networks can be beneficial to solve strategic problems in those aforementioned fields.
In detail, the snapshot records of cellular networks provide a density map of mobile users within the coverage area, which is able to characterize the spatial distribution of corresponding transportation [12]. Therefore, combining the continuous snapshots description, the real data can depict the movement of mobile users, so are the related transport traffic which is really helpful for the transportation planning.
Also for social networks, cellular networks measurements is able to provide a holistic view of how the mobile users communicate with each other, thus tracing the link flows which supports the specific information gossip. Even more, based on timely real data, the monitoring system is able to detect the vital node which plays the key role in the link flows, and necessary steps can be implemented to cut or weaken the information gossip.
Considering the universality of cellular networks and the possible detailed records, real data measurement is able to provide an effective solution for many other human-related systems. In [79], the author built a clear correlation between the SINR level in cellular networks and the user engagement rate of video websites, giving specific suggestions for over-the-top (OTT) providers to improve the user experience in the network point of view. Return to the cellular networks themselves, real data is also kind of solution for the more and more important traffic prediction problem.
Actually, traffic prediction is crucial in cellular networks because its accuracy impacts the al-location of scarce communication resource [87], especially the frequency resource. Practically, historical traffic records in cellular networks can serve as the training set of the predict pro-cedure, along with the increasingly powerful machine learning techniques, higher prediction accuracy can be achieved. Therefore, real data is promising to provide effective solutions for problems across from cellular network itself to various related human-oriented systems.
Chapter 2. Real Data Measurements in Cellular Networks 13 Conclusively, today’s cellular networks are already very complicated in their implementations, not to mention the forthcoming 5G networks which are destined to involve multiple access tech-nologies and satisfy multiple classes of service criterions. To simplify the designation of cellular networks and make them more efficient, data-driven approaches might be promising as real data can be adopted as a source, a standard and a solution for the evolution of cellular networks in our claim. After introducing the cellular network architecture and potential applications of real data, we will give a comprehensive review on the real traffic measurements in cellular networks. In this scope, three dimensions of traffic dynamics will be presented, i.e., time, space and content.
2.2
Real Traffic Measurements in Cellular Networks
After explaining the crucial importance of real data measurements in cellular networks, we will introduce the state-of-the-art research in this literature. Cellular networks traffic, along with the development of network infrastructures, are going through an evolution in dimensions of volume, type and demand patterns. As far as in 1997, author of [97] indicated the paradigm shift from traditional circuit-switched calls of Erlang-distributed patterns to advanced packet-switched multimedia services that appeals for new teletraffic model and service paradigm. Traffic in cellular networks, including message [106], voice [96] and data [83], has shifted from the voice-domination consuming pattern to the data-domination consuming pattern, resulting from the evolved user demand over years. Generally, the traffic as a wide-ranged variable, requires many features to characterize, from statistical description to geographical representation. In this section, to be clear and complete, we mainly cover three basic features, i.e., the temporal, spatial and content description of traffic in cellular networks. Actually, these three dimensions of characterization provide the most influential impact on the coordination between network function and user demand. As follows, we will introduce them one by one in specific details.
2.2.1 Temporal Characterization of Cellular Traffic
Traditionally, the traffic volume is considered to be homogeneous across different time scales for a cell, BTS or BSC, in order to simplify the planning procedure of cellular networks. However, the absolutely uniform assumption is definitely not true, thus light-load status are common for BSs since they are usually fuelled with the necessary radio resource to meet the highest traffic demand. On a smaller time scale, it is usually assumed that the call activities and data requests follow a Poisson process temporally, which means the arrival interval between subsequent calls is exponentially distributed. Actually, this kind of assumption can be true as A. K. Erlang claimed the Poisson distribution of telephone traffic one hundred years ago. However, as the
Chapter 2. Real Data Measurements in Cellular Networks 14 technology evolved from wired to wireless links, and cellular networks embraced multimedia as new approach for communications, the inherent patterns of traffic demand may also have changed. To identify the validation of traditional Poisson distribution or discover new suitable models, real data is the good and only way to work.
In temporal dimension, there are two different approaches to characterize the traffic dynamics in cellular networks, i.e., the macro and micro views. In detail, the macro view means to deal with the summation of traffic volume within a cell, a BS or larger coverage area, and of which the temporal variations on different time scales are analyzed. On the other hand, the micro view includes the traffic records on the levels of users, applications, requests or even packets as data source, and based on which specific performance metrics are investigated on a smaller time scale compared to the macro view. Besides, on the application of different approaches, analytic results from the macro view aim to provide guidance on the overall resource allocation, infrastructure deployment and other macroscopic visions of the cellular networks. While, differently, the specific examination of micro view tends to influence the internal parameter tuning or protocol design for refining the present flaws and improving the microscopic performance. In the following presentation, we will divide the related works into two different categories, according to the aforementioned views, and compare them with those correspondingly traditional assumptions.
Macro View
To analyze the traffic dynamics of cellular networks in a macro view, the aggregation traffic of different cells are the crucial variables, which can be added up under a coverage region of BSC or MSC. Here, we will introduce the related works according to the research timeline and corresponding logics.
Date back to 1999, Almeida et al. investigated the temporal variation of voice traffic from a GSM network in Lisbon [3], where they found a similar temporal pattern (highly related to the daily schedule of local residence) for different cells. Furthermore, they proposed to use the common double-gaussian and trapezoidal distribution to model the temporal variation of voice traffic, and showed that different models apply to different areas. To the best of our knowledge, this work was the first time to characterize the voice traffic of cellular networks in a temporal way, though the data or message traffic are not included.
Regarding the message, in [106], the authors performed a comprehensive measurement of the short messages service (SMS) in a national cellular networks in India, when the short messages were still popular in 2006. According to their results, 7.2% of the total messages sent by mobile users are requests to SMS services, and at least 10.1% of the total received messages are sent by content providers instead of mobile users, which is contradictory to our conventional assumption. Accordingly, based on the real measurements from telecommunication operator in
Chapter 2. Real Data Measurements in Cellular Networks 15 China, authors in [112] showed that the message traffic adopt a periodic pattern on the BSC level.
Different from the result in [3], authors in [96] found that the voice load of individual sectors varies significantly even within a few seconds in the worst case and there exists high variability of traffic volume even across sectors of the same cell. Therefore, the results tend to diverge in different coverage regions. Generally, the larger the investigated area, the more regular the aggregated traffic dynamic, due to the average effect. For example, [112] also depicted that the voice traffic within a BSC tends to be significantly periodic, therefore inducing a considerable predictability.
After 2007, as the worldwide spread of smart phones, more and more data traffic are generated, along with the decrease of traditional voice and message traffic. Therefore, the temporal analysis of traffic dynamics in cellular networks turns from voice duration to data consumption, which tends to exhibit a similar but more variable pattern.
Based on the data set spans one week in 2007 from a nation-wide network with thousands of BSs, authors in [68] showed that the aggregate network load exhibits a nice periodic behavior with relatively high loads during the day and the lowest load during midnight. On the contrary, individual BS loads do not show that much periodicity. Also, the load curve varies significantly among individual BSs with their peaks occurring at different times of the day. Similarly, this study on data traffic shows a regular pattern like the traditional voice traffic, along with the claim that the aggregation traffic in larger area tends to appear more periodic than individual smaller coverage area.
Utilizing a one-week-long data records in 2010 from a specific state in USA, in [83] authors found a diurnal characteristics of traffic volume over the duration of a complete week while weekdays tend to attract more user activity than weekend. Furthermore, the time-series of aggregate Internet traffic volume can be modeled by a multi-order discrete time Markov chain which would contribute to a good analytical property for performance evaluation.
Concluded from these above related studies, the aggregate traffic of large coverage areas in cellular networks tend to be significantly periodic which leads to high predictability, while the total traffic in smaller coverage areas (i.e. a BS) shows different levels of variation which could be attributed to human mobility and geographical diversity. To reach a thorough understanding into the traffic dynamics, more in-depth measurement should be conducted.
Such as in [93], Wang et al. presented a comprehensive analysis of the data traffic temporal dynamics across thousands of BSs from Shanghai, China. Using machine learning techniques, BSs can be clustered into five different categories based on their traffic dynamics on different time scales, where these categories are highly related to the geographical locations of cellular towers. Besides, they conducted a spectrum analysis on the frequency domain and claimed that
Chapter 2. Real Data Measurements in Cellular Networks 16 every traffic from the investigated BSs can be constructed using just four principal components corresponding to human activities.
Also in [92], the authors quantitatively characterized the spatio-temporal distribution of mobile traffic based on large-scale data set obtained from 380,000 BSs in Shanghai spanning over one month. They found that the mobile traffic loads uniformly follow a trimodal distribution, which is the combination of compound-exponential, power-law and exponential distributions, in terms of both spatial and temporal dimension with accuracy over 99%.
Furthermore, authors in [103] implemented a time series approach to analyze a large amount of traffic data from thousands of cellular towers, and they revealed that the mobile traffic temporal pattern can be divided into two components, regular and random parts. Based on the real data analysis, they discovered a high predictability of the regularity component of the traffic, and demonstrate that the prediction of randomness component of mobile traffic data is impossible. Conclusively, the traffic dynamics of cellular networks on the macro view exhibit a diurnal pat-tern which can be adopted as a reference for the resource allocation on a large scale. Meanwhile, there still exists evident variation for respective traffic across different cells, which suggests that operators should conduct different resource allocation policies for different BSs, not like the one-for-all strategy. In the next subsection, we will introduce the traffic dynamics in a micro view.
Micro View
Different from the macro view for traffic dynamics analysis, the micro view provides a more delicate perspective to characterize the temporal properties, usually making use of user-level, application-level or even packet-level measurement records. Meanwhile, the corresponding tradi-tional assumption in this literature is that the arrival pattern of traffic follows a Poisson process in the view of a BS or a specific content. As follows, we will uncover the realistic phenomenon discovered by many researchers in this field based on the measurements across the world. Firstly, for the voice traffic, authors in [41] examined the call duration distribution in GSM networks. The result shows that the log-normal distribution is more precise than the exponential or Erlang distribution. As we know, the log-normal distribution preserves heavy-tailed property at some extent, which reflects the inhomogeneous nature of call durations in GSM networks. Furthermore, authors in [96] certified this conclusion through another set of real data. In that study, they presented a large-scale characterization of primary users and found that the duration of calls are not exponential in nature and possess significant deviations that make them difficult to model. These two similar results based on different data set reveal the phenomenon which is clearly contrary to the traditional homogeneous assumption.
Chapter 2. Real Data Measurements in Cellular Networks 17 Secondly, we try to examine the similar property for data traffic. In [95], Williamson et al. used fine-grained measurements from an operational CDMA2000 (Code Division Multiple Access) cellular network to characterize the wireless Internet data traffic and revealed different patterns compared to traditional assumptions. In detail, the results show that the packet arrival process is non-stationary, and exhibits bursty nature rather than a homogeneous Poisson process. Related to this study, the authors in [108] compared the wireless traffic with traditional wired traffic, and found that the data sessions in wireless traffic contain less data in more but shorter flows, which typically consists of smaller packets with burstier arrival patterns. Similarly, these two studies revealed the same inhomogeneous property for data traffic as the voice traffic, both of which are high coupled with the human dynamics.
Go deep into the relationship between cellular networks traffic and human dynamics on temporal view, authors in [100] investigated the pattern of call activity during crowded soccer events in Brazil based on real measurements, and indicated that the dynamic transition of call activities between different cells can shed light on the inherent pattern of human mobility.
Also in [80], the author presented a first performance characterization of an operational cellular network during crowded events, where the temporal deviation of voice call and data traffic is compared to routine days. Besides the performance characterization during crowded events, the authors also proposed two effective methods to mitigate the severe performance degradation which are verified by simulation of real traces.
On the other hand, to link the personal traffic usage with mobile profiles, authors in [67] proposed a framework that automatically categorize mobile users into four different profiles according to their daily traffic usage, and based on which the authors calculated the traffic distribution of different kinds of users and create a traffic generator that captures the realistic usage pattern. Conclusively, investigating the cellular traffic in the micro view provides insights about how the fine-grained traffic is requested and delivered in the networks. Contrary to the traditional exponential distribution for call durations and Poisson process for data traffic arrival, many recent investigations show inhomogeneous nature for cellular traffic on different dimensions. Overall, the temporal analysis of cellular traffic based on real measurements in both macro and micro views challenges traditional assumptions on many important patterns, such as the equivalent assumptions for all BSs and the homogeneous assumptions for call duration and data arrival. According to these related works, the traffic consumption in cellular networks exhibits a periodic pattern for large coverage area which indicates significant predictability, while the traffic temporal pattern for single cells tends to be various across the cellular networks which urges different policy for distinctive BS. Meanwhile, the voice and data traffic in cellular networks exhibit inhomogeneous nature on different metrics, such as the heavy-tailed property for the
Chapter 2. Real Data Measurements in Cellular Networks 18 call duration and bursty inherence for data request, which would display significant importance in the network performance evaluation.
2.2.2 Spatial Characterization of Cellular Traffic
Besides the temporal variations, the spatial distribution of traffic consumption in cellular net-works is far away from the uniform assumption, which is usually adopted in the network sim-ulation of academic research. Actually, due to the mobility feature and aggregate residence of human beings, the mobile users are clusteringly distributed within the whole cellular net-works. Thus, the traffic demand of mobile users inevitably varies across the overall coverage area. Specifically, the spatial distribution of traffic density is highly co-located with the human residential hot spots.
In practice, in order to manipulate the limited wireless resource efficiently, the operators need to pre-allocate the frequency bands and corresponding transmit powers to different BSs or cells. Obviously, the resource allocation strategy is necessary to be coincident with the real traffic demand, temporally and spatially. For example, the heavily loaded BSs desire more spectrum and transmit power, while the low-load BSs need less, and the specific quantitative allocation is related to the predicted traffic demand based on historical records. Furthermore, the inter-cell interference in cellular networks is also a challengeable issue, since it’s highly related to the frequency reuse paradigm and transmit power allocation. Ideally, the frequency reuse factor should be various according to the realistic traffic load, because the interference level is dynamically changed. Therefore, the frequency reuse factor should be smaller in hotspot areas than that in low-load areas, and smaller at peak traffic period than that in low-load period in the same coverage area.
From these points of view, it’s essential to distinguish the realistic spatial distribution of traffic demand from traditional assumptions based on real data measurements. Furthermore, using those empirical results for spatial distribution of traffic demand, it’s possible to provide more efficient resource allocation strategies and interference mitigation methods to improve the overall capacity of cellular networks.
Actually, since a long time, researchers have found that the spatial distribution of traffic con-sumption in cellular networks was not uniform. For example, authors in [38] investigated the inhomogeneous property of voice traffic in GSM cellular networks, and proposed to use log-normal distribution to model the PDF (Probability Density Function) of traffic volume which can not be rejected in different levels of granularity. Besides, they also demonstrated that there is a distinctive capacity gap between homogeneous and inhomogeneous case, which highly motivated the accurate characterization of traffic distribution in order to provide reasonable guidance for cellular networks planning. This study investigated the numerical distribution
Chapter 2. Real Data Measurements in Cellular Networks 19 of traffic volume density regardless of corresponding correlation between human activities and traffic distribution.
In [3], besides the temporal dynamics, the authors discussed the spatial distribution of voice traffic in GSM networks, where they discovered the explicit inhomogeneous nature of traffic distribution and adopted several common functions to model this kind of nonuniform. From their results, farther is the cell from the city center, smaller is the traffic density in that area, which depicts a clear decaying phenomenon. Specifically, considering the relationship between the distance from the city center and the corresponding traffic density, the exponential model presents the worst performance while pairwise linear model outperforms the other candidates. Furthermore, authors in [91] proposed a demand-node generating model for infrastructure de-ployment in cellular networks, which considers the spatial aggregation effect of voice traffic across the coverage area which is highly correlated with human daily activities.
As cellular networks upgraded and the traffic usage of mobile users transit from the traditional voice calls to the popular data service, which stimulates the academic group to focus on the data traffic consumption across the whole network. For example, studies in [68] showed that 10% of the BSs experience roughly about 50-60% of the aggregate traffic load, which indicates the explicit imbalance of data traffic distribution across cellular networks. Besides, it also showed that less than 10% of subscribers generate 90% of the load which reflects the clustering effect of traffic distribution on another dimension. This phenomenon from real measurements clearly demonstrated the heavy-tailed characteristics of data traffic on the BS-level and user-level, which is inherently rooted in human dynamics (similar with Matthew effect in economics and sociology).
More specifically, Laner et al. in [48] investigated the real data from a high-speed packet access (HSPA) networks in Vienna (Austria), and found that the mean throughput of coverage cells within the peak hour varies over roughly three orders of magnitude. Whereas the 10% of cells with lowest load have a mean throughput of below 1 kbit/s, the 10% most loaded cells have a mean throughput above 500 kbps. Consequently, the commom assumption of a constant traffic density over a large number of cells is inadequate.
Besides the aggregate traffic, Shafiq et al. in [82] analyzed the geospatial dynamics of applica-tion usages in a large 3G cellular networks, based on traces from both RAN and CN indicating location information and data delivery details. Based on the application usage calculation on different levels, the authors aimed to classify a number of BSs into different categories. Counter-intuitively, they found that cell clustering results were significantly different for traffic volume in terms of byte, packet, flow count and the popularity of different applications significantly varies even within a given neighborhood.
Chapter 2. Real Data Measurements in Cellular Networks 20 From the intangible heavy-tailed description to detailed statistical modeling, Lee et. al in [50] found that the cell traffic can be approximated by the Weibull or Gamma distribution; the traffic density can be approximated by the log-normal and Weibull distribution which are all contradicted with the traditional uniform assumption. Besides, they also found that there is a correlation between the traffic volume of different cells within specific distance. More importantly, this study provides the possibility of generating the realistic traffic demand across the whole plane of cellular networks, embedded with the traffic correlation between BSs and without losing the inhomogeneity characteristics.
To consider the mobile user distribution and spatial traffic demand jointly, many researchers started to use fine-grained user distribution information to shed light on the inherent relationship between user and traffic. Ding et al. in [28] discovered that the spatial distribution of subscribers and traffic demand can be accurately described by log-normal mixture models. Besides, their extensive analysis gave a precise characterization of BS capacities and clustered all BSs into six categories based on subscriber density and average traffic demand. These kind of results may help the operators to allocate their limited resources more efficiently based on the traffic demand categories of different BSs.
On the other hand, to combine the traffic consumption with the mobile user distribution and the infrastructure deployment, authors in [62] proposed a tunable statistical model capturing the interconnection between BS spatial deployment and spatial traffic distribution, with only two parameters. This work provides a convenient way to connect a heterogeneous infrastructure deployment and the corresponding spatially heterogeneous distributed traffic demand.
Conclusively, similarly with the inhomogeneous distribution of traffic demand on temporal di-mension, the aggregate traffic consumption presents heterogeneity across the spatial plane within the cellular networks. Specifically, the time-summation traffic volumes of different BSs exhibit heavy-tailed characteristics according to numerous real measurements verification. This phe-nomenon indicates the severe imbalance of traffic demand across the whole networks, thus urges the load balance technics or different resource allocation strategies to improve the overall capacity performance.
Furthermore, compared with the aggregate traffic volume on BS level, the traffic density de-scription provides a more intuitive view into the heterogeneous nature of traffic consumption. Based on different data sets from different countries, the state-of-the-art statistical model for the data traffic density in cellular networks follows a log-normal or a Weibull distribution, both of which shows some extent of heavy-tailed property thus verifies the spatial heterogeneity nature of traffic demand more definitely.
Actually, analyzing the spatial distribution of traffic volume on the one-dimension numerical statistic is not enough since it loses explicit location information where the traffic demand
Chapter 2. Real Data Measurements in Cellular Networks 21 actually happens. For example, despite the log-normal distribution may be accurate for traffic density values, but it’s not adequate for locating the data requests or the aggregate traffic on user or BS-level. One possible way to solve this problem is to spatially modeling the user distribution or BS deployment on a two-dimension view, and then feed those information into the traffic density description. In this point of view, the spatial heterogeneities of mobile users, BSs and traffic demand are coupled with each other and should be investigated all together which leads to our works on spatial modeling of BSs in Chapter3.
2.2.3 Content Preference of Cellular Traffic
Traditionally, before the 3G cellular networks, the available bandwidth was not sufficient for mobile users to fetch contents directly from the Internet. At that time, the main goal of wireless communications was mainly the voice call or short message services between subscribers. Meanwhile, the wired network was speeding up to provide various content options through the Internet, such as news, pictures and videos. Looking backward, during the past decades, the provided contents and the connected Internet help each other to spread and enrich, and their combination makes our real life and virtual activities seamlessly merged together. The social pattern of us, as human beings in the Internet era, reflects itself from the touchable real life onto the virtual binary world. Therefore, the wired Internet or mobile wireless network can be utilized as mirrors to reflect the inherent human dynamics, thanks to their well organized recording ands almost ubiquitous coverage.
Firstly, for the wired caching, Lee et al. in [11] first showed that the web requests follow a Zipf-like distribution [65]. Based on various traces collected independently, the authors introduced a simple model for web requests, which are independently valued from a Zipf-like distribution. The results showed that this simple model can explain the asymptotic behavior of these three properties that are observed in real web cache traces.
Apart from the traditional web content, the authors in [36] conducted an extensive analysis of the YouTube workload, and found that there are (not surprisingly) many similarities to traditional web and media streaming workloads. For example, since access patterns are strongly correlated to human behaviors, as traffic volumes vary significantly by time-of-day, day-of-week, as well as longer term activities (e.g., academic calendars). Similarly, video files are much larger than other types of file, and some videos are more popular than others.
Similarly, Cha et al. in [14] presented an extensive data-driven analysis on the popularity distribution, popularity evolution, and content duplication of user-generated video contents on the Internet. They studied the nature of the user behavior and identified the key elements that shape the popularity distribution, and it was found that the Pareto phenomenon of content requesting is likely caused by both human similarity and the information filtering technics.