HAL Id: hal-01627398
https://hal-amu.archives-ouvertes.fr/hal-01627398
Submitted on 12 Dec 2018
HAL is a multi-disciplinary open access
archive for the deposit and dissemination of
sci-entific research documents, whether they are
pub-lished or not. The documents may come from
teaching and research institutions in France or
abroad, or from public or private research centers.
L’archive ouverte pluridisciplinaire HAL, est
destinée au dépôt et à la diffusion de documents
scientifiques de niveau recherche, publiés ou non,
émanant des établissements d’enseignement et de
recherche français ou étrangers, des laboratoires
publics ou privés.
Multi-label Classification of Moving Object Trajectories
based on Frequent Behavior Type Detection
Feda Almuhisen, Nicolas Durand, Mohamed Quafafou
To cite this version:
Feda Almuhisen, Nicolas Durand, Mohamed Quafafou. Multi-label Classification of Moving Object
Trajectories based on Frequent Behavior Type Detection. 24èmes Rencontres de la Société
Franco-phone de Classification (SFC 2017), Société FrancoFranco-phone de Classification, Jun 2017, Lyon, France.
�hal-01627398�
Multi-label Classification of Moving Object Trajectories
based on Frequent Behavior Type Detection
Feda Almuhisen, Nicolas Durand, Mohamed Quafafou Aix-Marseille Université, CNRS, LSIS, Marseille, France
{nicolas.durand, mohamed.quafafou}@univ-amu.fr
Résumé. Cet article propose une méthode qui analyse des données représentant des trajectoires d’objets mobiles. La méthode se base sur les motifs fréquents et introduit différentes types de motifs, par exemple, les motifs latents, émer-gents, etc. Un ensemble d’algorithmes sont alors introduits pour pré-traiter les données, extraire les motifs fréquents et détecter les types des motifs. Ces motifs géolocalisés sont ensuite utilisés pour tagger une zone spatiale déterminée. La classification d’une trajectoire consiste alors en sa projection sur la zone spatiale ce qui conduit nécessairement à une classification multi-labels dépendant de la granularité spatio-temporelle. Pour finir, nous discutons de l’application de notre méthode sur des données réelles représentant des trajectoires de taxis.
1
Introduction
A trajectory is a sequence of a moving object geographical locations on a defined time period (e.g., sequence of (latitude, longitude, time)). The objective of trajectory classifica-tion is to recognize and characterize trajectories (or its sub-trajectories) different status, such as motions (e.g., still, moving, etc.), transportation modes (e.g., bus, biking, etc.), and human activities (Zheng, 2015). Tagging a raw trajectory with a semantic label is an important step for many applications like journey recommendation. Recently,traffic flow analysis methods have been discussed in literatures for the purpose of improving prediction applications and the traffic state or to provide a better recommendation systems (Yin et al., 2014; Lu et al., 2015). The models discussed are combined with tools to discover and analyze the patterns involved in the traffic state. In this way, it has become possible to recommend different journeys to user. Furthermore, extracting hidden patterns and reflecting them into visual system can be used to predict and control traffic. For this purpose, we present in this paper a trajectory classification method based on pattern extraction and pattern type detection according to frequent behavior over time. This method is used to rank trajectories and recommend the ranked list to user.
2
Multi-label classification proposed method
In this section we present an overview of the proposed method. Preprocessing step (cf. Fi-gure 1, Step 2) consists of segmenting trajectories according to time granularity, and mapping
21 (0) 22 (D) (L) 23 (E) (L) 24 (E) 17 (Lo) 18 (D) 19 (D) 20 (D) 13 (L) 14 (0) 15 (D) (Lo) 16 (0) 9 (0) 10 (D) 11 (0) 12 (0) 5 (E) 6 (D) (Lo) 7 (0) 8 (0) 1 (0) 2 (0) 3 (0) 4 (0) Trajectory DB 1. Data collection r …. r *c 1 2 …. c 2. Preprocessing Trajectories segmentation by time granularity
Grid Area Generation (Raster)
21 (0) 22 (D) (L) 23 (E) (L) 24 (E) 17 (Lo) 18 (D) 19 (D) 20 (D) 13 (L) 14 (0) 15 (D) (Lo) 16 (0) 9 (0) 10 (D) 11 (0) 12 (0) 5 (E) 6 (D) (Lo) 7 (0) 8 (0) 1 (0) 2 (0) 3 (0) 4 (0) Pattern extraction and behavior detection
Multi-label area (tagged map) for each time window (Δ t)
Spatial area Behavior Cost (value) Lost (Lo) 0.5 Decreasing (D) 2 Latent (L) 2.5 Emerging (E) 4 Jumping (J) 5 No behavior (0) 0 Trj 1 Trj 2 Trajectory represented by its behavior. Trj1 ( Lo D D D E) Trj2 ( 0 D 0 0 0 D E) or (0 Lo 0 0 D E)
Calculate the cost for each trajectory based on behavior cost
Trj1 cost = (0.5+2+2+2+4) = 10.5 Trj2 cost = (Trj2 cost1+Trj2 cost2)/2 =7.25 Trj2 cost1 = (0+2+0+0+0+2+4) = 8 Trj2 cost2 = (0+0.5+0+0+0+2+4) = 6.5
4. Trajectory projection 5. Cost computation
Behavior cost table
3. Behavior Extraction
New trajectories through Δ t
Input (Longitude, Latitude) Geo-referance system Output Grid number
FIG. 1 – Overview of the proposed behavior based multi-label classification
trajectories using local georeference on a raster area. In the time segmentation step, each tra-jectory on the dataset T rjs will be segmented according to time granularity value which it can be minutes, hours, days, etc. We note T = {t1, t2, ...., tk−1, tk} as the set of time granularity
values where tj < tj+1 for 1 ≤ j ≤ k − 1. From this context, each trajectory is
segmen-ted according to the defined T . Preprocessing step also includes generating a raster area G by applying a local georeference system that maps each trajectory points.
In Step 3, we extract the frequent concept lattices (Zaki et Hsiao, 2005) and detect beha-viors associated to the trajectories over ∆t. The computation of the frequent concept lattice allows us to obtain both the grid closed patterns and their corresponding sets of trajectories. From which we detect the type of the closed pattern (i.e., the intent) of each frequent for-mal concept by studying its evolution. We have defined five different behavior types from this context as follow : the emerging type means that the presence of the pattern increased in the trajectories. The decreasing type means that the presence of the pattern decreased in the tra-jectories. The latent type means that the presence of the pattern is quite similar. The jumping type means the pattern which was absent, appeared. The lost type means that the pattern di-sappeared. The type of the closed pattern reflects the behavior of users who have generated the corresponding trajectories during the studied time window.
The extracted behaviors are geolocalized in a real map in order to tag a given spatial area (cf. Figure 1, Step 4). The set of labels are defined as follow : Labels = {E, D, L, J, Lo, 0} where E= Emerging,D = Decreasing, L= latent, J = Jumping, Lo = Lost, and 0 = no detected behavior.Let us note that Steps 1-3 are performed off-line, and Steps 4 and 5 are performed on-line.
spa-F. Almuhisen et al.
tial zone (cf. Figure 1, Step 4). This is achieved by converting each trajectory point to the corresponding spatial zone behavior. In Step 5, we calculate the cost value of each trajectory based on the behavior cost table. The calculated values are used to rank the trajectories. It is important to mention that the trajectory can pass through a single label grid (one behavior) or a multi-label grid (more than one behavior). For example, in Figure 1, grid no.15 has two labels (Decreasing and Lost). Our method solves this problem by calculating the mean cost value for all the possibilities (for instance, Trj2 in Figure 1 Step 5).
.
3
Experiments
In order to perform our experiments, we apply our method on real data set (T-drive) col-lected by Microsoft Research Asia. This data has been used in Yuan et al. (2011). We chose 222 Taxi trajectories from the original data set during the period of one week from Feb2 to Feb8 in 2008. The protocol can be summarized as follows, we process the data as shown in (cf. Figure 1, Step 2,3), time granularity = 12 hours (half day), spatial granularity = 60 meters, minimal support = 10. Detected behaviors were geolocalized on a real map for each time win-dow ∆t during a period of one week as shown in Figure 2. Then, we have ranked a set of new trajectories to go from one point to another. This set can be computed by any existing systems.
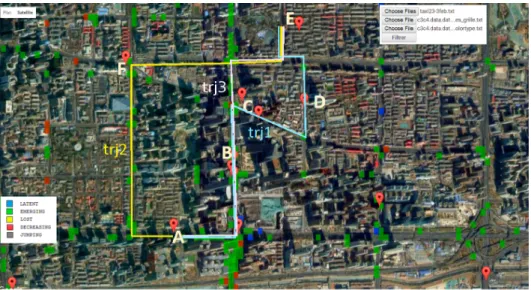
FIG. 2 – Example of projected trajectory.
Figure 2 shows a behavior tagged map for Beijing railway station and second ring zone, from a set of trajectories to go from A to E. This set is composed of three trajectories : A->B->C->D->E, A->F ->E, and A->B->C->E. These trajectories have been classified and ranked according to their cost values. The cost values for these trajectories are : Trj1 =78, Trj2=64,
and Trj3=102. The trajectories are sorted from min to max values as follow : Trj2, Trj1, and Trj3. Based on this result the journey A->F ->E is the best choice.
4
Conclusion
In this paper, we have proposed a new multi-label classification of moving object trajec-tories. The method is based on analyzing behavior evolution and introduces different pattern types such as emerging, decreasing, etc. These types are used to generate a city map tagged by behaviors. The method uses this multi-label area to classify a new trajectory passing through this zone and to compute the journey cost value. This allows us to give information about new trajectories and to rank them to give recommendations to user. Experimental results using real-word trajectories data have shown the usefulness of the proposed method.
Références
Lu, M., Z. Wang, et X. Yuan (2015). Trajrank : Exploring travel behaviour on a route by tra-jectory ranking. In 8th IEEE Pacific Visualization Symposium (PacificVis 2015), Hangzhou, China, pp. 311–318.
Yin, P., M. Ye, W.-C. Lee, et Z. Li (2014). Mining gps data for trajectory recommendation. In 18th Pacific-Asia Conference on Knowledge Discovery and Data Mining (PAKDD 2014), Tainan, Taiwan, pp. 50–61.
Yuan, N. J., Y. Zheng, X. Xie, et G. Sun (2011). Driving with knowledge from the physical world. In 17th ACM SIGKDD International Conference on Knowledge Discovery and Data Mining, San Diego, CA, pp. 316–324.
Zaki, M. J. et C.-J. Hsiao (2005). Efficient algorithms for mining closed itemsets and their lattice structure. IEEE Transactions on Knowledge and Data Engineering 17(4), 462–478. Zheng, Y. (2015). Trajectory Data Mining : An Overview. ACM Trans. Intell. Syst.
Tech-nol. 6(3), 29–41.
Summary
This paper proposes a method that analyzes data representing trajectories of moving ob-jects. The method is based on extracting frequent patterns and introduces different types of patterns, for example, latent, emergent, etc. A set of algorithms are introduced to pre-process the data, to extract the frequent patterns and detect the behaviors. These types are used to generate a city map tagged by behaviors. The classification of a given trajectory consists in its projection on this spatial zone. This leads to a multi-label classification which depends on the spatio-temporal granularity. Finally, we discuss the application of our method on real-world data representing taxi trajectories.