HAL Id: tel-01868463
https://tel.archives-ouvertes.fr/tel-01868463
Submitted on 5 Sep 2018HAL is a multi-disciplinary open access archive for the deposit and dissemination of sci-entific research documents, whether they are pub-lished or not. The documents may come from teaching and research institutions in France or abroad, or from public or private research centers.
L’archive ouverte pluridisciplinaire HAL, est destinée au dépôt et à la diffusion de documents scientifiques de niveau recherche, publiés ou non, émanant des établissements d’enseignement et de recherche français ou étrangers, des laboratoires publics ou privés.
scheduling with demand response programs
Berk Celik
To cite this version:
Berk Celik. Coordination mechanisms for smart homes electric energy management through dis-tributed resource scheduling with demand response programs. Electric power. Université Bourgogne Franche-Comté, 2017. English. �NNT : 2017UBFCA013�. �tel-01868463�
Coordination mechanisms for smart
homes electric energy management
through distributed resource
scheduling with demand response
programs
TH `
ESE pr ´esent ´ee par
B
ERK
C
ELIK
pour obtenir le
Grade de Docteur de
l’Universit ´e Bourgogne Franche-Comt ´e
Sp ´ecialit ´e :G ´enie ´electrique
Coordination mechanisms for smart homes electric
energy management through distributed resource
scheduling with demand response programs
Unit ´e de Recherche :FEMTO-ST
Soutenue publiquement le 29 septembre 2017 devant le Jury compos ´e de :
MANUELASECHILARIU Rapporteure UTC, AVENUES
BRUNOFRANCOIS Rapporteur ECL, L2EP´
STEPHANE´ CAUX Examinateur INPT – ENSEEIHT, LAPLACE DELPHINE RIU Examinatrice INPG – ENSE3, G2ELAB
SIDDHARTHSURYANARAYANAN Examinateur Colorado State University
ABDELLATIFMIRAOUI Directeur de th `ese UTBM
Grid modernization through philosophies as the Smart Grid has the potential to help meet the expected world increasing demand and integrate new distributed generation resources at the same time. Using advanced communication and computing capabilities, the Smart Grid offers a new avenue of controlling end-user assets, including small units such as home appliances. However, with such strategies, decisions taken independently can cause undesired effects such as rebound peaks, contingencies, and instabilities in the network. Therefore, the interaction between the energy management actions of multiple smart homes is a challenging issue in the Smart Grid.
Under this purpose, in this work, the potential of coordination mechanisms established among residential customers at the neighborhood level is evaluated through three stud-ies. Firstly, coordinative home energy management is presented, with the aim to increase local renewable energy usage in the neighborhood area by establishing energy trading among smart homes, which are compensated by incentives. The control algorithm is realized in both centralized and decentralized manners by deploying a multi-agent sys-tem, where neighborhood entities are modeled as agents. Simulations results show that both methods are effective on increasing local renewable energy usage and decreasing the daily electricity bills of customers. However, while the decentralized approach gives results in shorter time, the centralized approach shows a better performance regarding costs.
Secondly, two decentralized energy management algorithms are proposed for day-ahead energy management in the neighborhood area. A dynamic pricing model is used, where price is associated to the aggregated consumption and grid time-of-use scheme. The ob-jective of the study is to establish a more advanced coordination mechanism (compared to previous work) with residual renewable energy is shared among smart homes. In this study, the performance of the algorithms is investigated with daily and annual analyses, with and without considering forecasting errors. According to simulations results, both coordinative control models show better performance compared to baseline and selfish (no coordination) control cases, even when considering forecasting errors.
Lastly, the impact of photovoltaic systems on a residential aggregator performance (in a centralized approach) is investigated in a neighborhood area. In the proposed model, the aggregator interacts with the spot market and the utility, and proposes a novel pricing scheme to influence customers to control their loads. Simulation results show that when the penetration level of residential photovoltaics (PV) is increased, the aggregator profit decreases due to self-consumption ability with PV in the neighborhood.
Overall, developed coordination mechanisms provide benefits to both the neighborhood (peak load reduction) and the home levels (daily costs). The vital outcome of this dis-sertation, no matter the type of the smart home (with/without generation and storage), all smart homes achieved to reduce their daily electricity bills, thus the participation of the end-users secured with the influence of the economical benefits. Moreover, the presented methods contribute to the reduction of carbon-dioxide emission in two ways: increasing
renewable energy utilization, and decreasing dependency on peaking generators.
Keywords: Smart grid, demand response, demand-side management, multiple house-holds coordination, rebound peak, residential energy management
La modernisation des r ´eseaux ´electriques via ce que l’appelle aujourd’hui les r ´eseaux intelligents (ou smart grids) promet des avanc ´ees pour permettre de faire face `a une augmentation de la demande mondiale ainsi que pour faciliter l’int ´egration des ressources d ´ecentralis ´ees. Gr ˆace `a des moyens de communication et de calcul avanc ´es, les smart grids offrent de nouvelles possibilit ´es pour la gestion des ressources des consommateurs finaux, y compris pour de petits ´el ´ements comme de l’ ´electrom ´enager. Cependant, ce type de gestion bas ´ee sur des d ´ecisions prises ind ´ependamment peuvent causer des perturbations tels qu’un rebond de consommation, ou des instabilit ´es sur le r ´eseau. La prise en compte des interactions entre les d ´ecisions de gestion ´energ ´etique de diff ´erentes maisons intelligentes est donc une probl ´ematique naissante dans les smart grids. Cette th `ese vise `a ´evaluer l’impact potentiel de m ´ecanismes de coordination en-tre consommateurs r ´esidentiels au niveau de quartiers, et ce `a travers trois ´etudes compl ´ementaires. Tout d’abord, une premi `ere strat ´egie pour la gestion coordonn ´ee de maisons est propos ´ee avec l’objectif d’augmenter l’utilisation locale d’ ´energie renouve-lable `a travers la mise en place d’ ´echanges d’ ´energie ´electrique entre voisins. Les participants rec¸oivent en ´echange une compensation financi `ere. L’algorithme de ges-tion est ´etudi ´e dans une configurages-tion centralis ´ee et une configurages-tion d ´ecentralis ´ee en faisant appel au concept de syst `eme multi-agents, chaque maison ´etant repr ´esent ´ee par un agent. Les r ´esultats de simulation montrent que les deux approches sont ef-ficaces pour augmenter la consommation locale d’ ´energie renouvelable et r ´eduire les co ˆuts ´energ ´etiques journaliers des consommateurs. Bien que l’approche d ´ecentralis ´ee retourne des r ´esultats plus rapidement, l’approche centralis ´ee a une meilleure perfor-mance concernant les co ˆuts.
Dans une seconde ´etude, deux algorithmes de gestion ´energ ´etiques `a J-1 sont propos ´es pour un quartier r ´esidentiel. Un mod `ele de tarification dynamique est utilis ´e, o `u le prix d ´epend de la consommation agr ´eg ´ee du quartier ainsi que d’une forme de tarification heures creuses-heures pleines. L’objectif est ici de concevoir un m ´ecanisme de coordi-nation plus avanc ´e (par rapport au pr ´ec ´edent), en permettant des ´echanges d’ ´energie renouvelable r ´esiduelle au sein du quartier. La performance des algorithmes est ´etudi ´ee sur une p ´eriode d’une journ ´ee puis d’une ann ´ee, en prenant ou non en compte les er-reurs de pr ´evision. D’apr `es les r ´esultats de simulation, les deux algorithmes propos ´es montrent de meilleurs performances que les m ´ethodes de r ´ef ´erence (sans contr ˆole, et algorithme ´ego¨ıste), m ˆeme en consid ´erant les erreurs de pr ´evision.
Enfin, dans une troisi `eme ´etude, l’impact de l’introduction de production photovolta¨ıque r ´esidentielle sur la performance d’un agr ´egateur est ´evalu ´ee, dans une configuration cen-tralis ´ee. L’agr ´egateur interagit avec le march ´e spot et le gestionnaire de r ´eseau, de fac¸on `a proposer un nouveau mod `ele de tarification permettant d’influencer les consomma-teurs `a agir sur leur consommation. Les r ´esultats de simulation montrent quand le taux de p ´en ´etration de photovolta¨ıque r ´esidentiel augmente, le profit de l’agr ´egateur diminue, du fait de l’autoconsommation dans le quartier.
Dans l’ensemble, les m ´ecanismes de coordination ont des avantages `a la fois au niveau des quartiers (r ´eduction du pic de demande) que des maisons individuelles (r ´eduction des co ˆuts ´energ ´etiques). Un des r ´esultats importants de ce travail est que quel que soit le type de maison et sa configuration (avec ou sans production et stockage), tous les consommateurs peuvent r ´eduire leur facture ´energ ´etique, ce qui permet d’assurer un niveau minimum de participation des consommateurs. De plus, les m ´ethodes pr ´esent ´ees contribuent `a la r ´eduction des ´emissions de dioxyde de carbone en permettant une meilleure utilisation locale des ´energies renouvelables ainsi qu’en diminuant le recours
`a des g ´en ´erateurs de pointe.
Mots-cl ´es : R ´eseau intelligent, effacement diffus, gestion de la demande, maison intelli-gente, quartier intelligent, gestion de l’ ´energie r ´esidentielle
This work would not have been possible without the support and helps of many re-searchers, colleagues and friends.
I would like to thank, firstly, Prof. Manuela Sechilariu and Prof. Bruno Francois for ac-cepting to review this dissertation, despite their very busy schedules, and for their helpful comments. I would also like to thank Prof. St ´ephane Caux, Prof. Delphine Riu, and Prof. Siddharth Suryanarayanan for accepting to participate in my defense.
I would like express my sincere appreciations to the director of my thesis, Prof. Abdellatif Miroui for selecting me for this Ph.D. position and giving me the opportunity to accomplish this doctoral research. Then, I would like to thank my co-supervisors Dr. David Bouquain and Dr. Robin Roche for their guidance and support throughout the years of my Ph.D. studies. I would especially like to thank and present my deepest gratitude to Dr. Robin Roche, for his encouragement, understanding, his valuable advices, and last but not least for having trusted me during the last three years.
I would also address special thanks to Prof. Siddharth Suryanarayanan for inviting me to Colorado State University, USA, and giving me this great opportunity to work with him and the members of the Advanced Power Engineering Laboratory (APEL). I owe enormous gratitude to him for providing me with his complementary and invaluable expertise. It has been a fantastic experience where I learnt a lot, and that helped me achieve my goals. I must also thank Prof. Howard Jay Siegel and Prof. Anthony A. Maciejewski for their valuable contributions and suggestions to my doctoral research, and the members of APEL: Ms. Swagata Sharma, Mr. Fathalla Eldali, Mr. Rahul G.Kadavil, Mr. Turki Alaqeel and Mr. Sulaiman Almohaimeed for their warm welcome and help.
During the three years of my doctoral studies, many researchers I met and worked with generously shared their expertise and friendship with me. I thank them all: Prof. Timothy Hansen, Prof. Fei Gao, Dr. Damien Paire, Dr. Alexandre Ravey, Dr. Daniela Chrenko, Dr. Yiming Wu, Dr. Nanfang Yang, Mr. Bei Li, Ms. Citlalli Gamez, and all the engineers, technicians.
I appreciate the financial support of UTBM for funding me during my doctoral research, and the Electrical and Computer Engineering Department of Colorado State University for hiring me as a non-student employee to help co-fund my extensional stay.
Finally, I express my deepest gratitude to my best friends: Nuri, Umut, Ihsan, Kerem and Mustafa, who have never withheld their great support and left me alone in this difficult journey. My warmest gratitude should also be expressed to my parents and my precious little sister Ipek for being supportive of me through all these years. I owe an enormous amount to my parents for their constant encouragement to push onwards and to give the best of myself. I may certainly not have continued this far on my studies without their endless motivation.
ADHDP Action dependent heuristic dynamic programming AS Ancillary services
AMI Advanced metering infrastructure ANFIS Adaptive neural fuzzy inference system CES Community energy storage
CIP Customer incentive pricing CM Capacity market
CPP Critical peak price CO2 Carbon-dioxide
DB Demand bidding
DER Distributed energy resources DG Distributed generation DLC Direct load control DM Decision-making
DSM Demand-side management DR Demand response
EDR Emergency demand response EV Electric vehicle
FERC Federal energy regulatory commission FIT Feed-in-tariff
GA Genetic algorithm GUI Graphical User Interface
GT Game theory
HAN Home area network
HEMS Home energy management system HPC High performance computing HVAC Heating-ventilation-air-conditioners IBR Incremental block rate
I/C Interruptiable/curtaillable
ICT Information and communication technology JADE JAVA agent development
IBP Incentive-based programs LSE Load serving entity MAS Multi-agent system MG Microgrid
MINLP Mixed-integer nonliner program MPI Message passing interface NAN Neighborhood area network OA Omnipath Architecture Open-MP Open-multi processing PAR Peak-to-average ratio
PHEV Plug-in hybrid vehicles PSO Particle swarm optimization PV Photovoltaic
RES Renewable energy sources SGRA Smart grid resource allocation SM Success Metric
SMAPE Symmetrical mean absolute percentage error RTP Real-time price
SCADA Supervisory control and data acquisition SG Smart Grid
TCP/IP Transmission control protocol/Internet protocol T & D Transmission and distribution
THA Two-horizon algorithm TOU Time-of-use
I Introduction 1
1 Demand-Side Management in the Smart Grid 3
1.1 Concept of smart grid . . . 4
1.2 Electric energy management . . . 5
1.2.1 Demand side management . . . 5
1.2.2 Demand response . . . 7
1.3 Flexibility of demand-side resources . . . 8
1.3.1 Residential sector . . . 9
1.3.2 Commercial sector . . . 11
1.3.3 Industrial sector . . . 12
1.3.4 Transportation sector . . . 12
1.4 Problem statement . . . 13
1.5 Organization of the dissertation . . . 14
2 State-of-the-Art Review 17 2.1 Load modeling techniques . . . 17
2.1.1 Top-down approaches . . . 17
2.1.2 Bottom-up approaches . . . 18
2.2 Home energy management in the residential sector . . . 18
2.2.1 Incentive-based single home energy management . . . 19
2.2.2 Price-based single home energy management . . . 19
2.3 Neighborhood energy management . . . 21
2.3.1 Concept of neighborhood area . . . 21
2.3.1.1 Neighborhood area structure . . . 22
2.3.1.2 Role of entities . . . 22
2.3.2 Coordination structure and objectives . . . 23
2.3.2.1 Centralized coordination . . . 23
2.3.2.2 Decentralized coordination . . . 25
2.3.3.1 Multi-agent systems . . . 29
2.3.3.2 Game-theoretic approaches . . . 31
2.3.3.3 Optimization techniques . . . 33
2.4 Overview of the state-of-the-art . . . 34
II Coordination Mechanisms 39 3 Incentive-Based Renewable Energy Trading Among Smart Homes 41 3.1 System model . . . 42
3.1.1 Home energy system . . . 42
3.1.1.1 Consumption model . . . 43
3.1.1.2 PV generation model . . . 44
3.1.1.3 Energy storage model . . . 45
3.1.2 Neighborhood area . . . 45
3.1.3 Electricity pricing: neighborhood incentive model . . . 46
3.2 Problem formulation . . . 47 3.2.1 Baseline scenario . . . 47 3.2.2 Selfish scenario . . . 48 3.2.3 Decentralized coordination . . . 50 3.2.4 Centralized coordination . . . 57 3.3 Simulation setup . . . 58 3.3.1 Simulation parameters . . . 59 3.3.2 Co-simulation platform . . . 60 3.4 Performance evaluation . . . 61
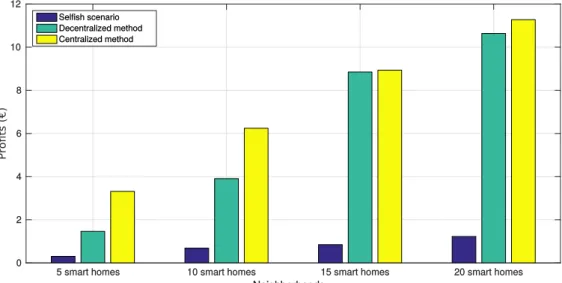
3.4.1 Cost and computation time analysis . . . 61
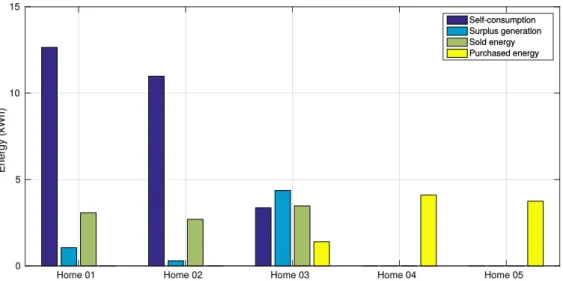
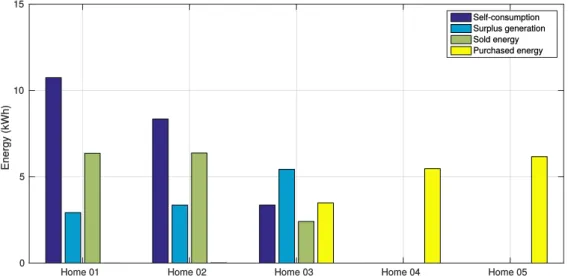
3.4.2 Power and energy analysis . . . 62
3.4.3 Scalability analysis . . . 67
3.5 Conclusion . . . 67
4 Dynamic Pricing-Based Decentralized Home Energy Sharing Coordination 69 4.1 System model . . . 70
4.1.1 Home energy system . . . 70
4.1.2 Forecasting error model . . . 74
4.1.3 Electricity pricing: dynamic model . . . 75
4.3 Coordination mechanisms . . . 80
4.3.1 Group-based coordination . . . 80
4.3.2 Turn-based algorithm . . . 81
4.3.3 Convergence . . . 83
4.4 Performance evaluation . . . 83
4.4.1 Daily simulation results . . . 85
4.4.2 Annual simulation results . . . 86
4.4.3 Scalability analysis . . . 89
4.5 Conclusion . . . 89
5 Aggregator-Based Asset Control with Residential PV Generation 91 5.1 System model . . . 92
5.1.1 Smart home . . . 92
5.1.2 Electricity network . . . 92
5.2 Problem formulation . . . 93
5.2.1 SGRA without considering residential PV generation . . . 96
5.2.2 SGRA with considering residential PV generation . . . 96
5.3 Parallel processing methods . . . 100
5.3.1 Parallel processing with OpenMP . . . 101
5.3.2 Parallel processing with MPI . . . 102
5.3.3 Parallel processing with OpenMP/MPI . . . 103
5.3.4 Performance of parallel processing techniques . . . 104
5.4 Performance evaluation . . . 106
5.4.1 Daily results of SGRA with/without PV . . . 107
5.4.2 Weekly results of SGRA with/without PV . . . 113
5.4.3 Scalability analysis . . . 113 5.5 Conclusion . . . 115 III Conclusions 119 6 Conclusion 121 6.1 Contributions . . . 121 6.2 Summary of Works . . . 122 6.3 Future Works . . . 123 List of Figures 139
List of Tables 143
IV Appendices 145
D
EMAND
-S
IDE
M
ANAGEMENT IN THE
S
MART
G
RID
T
he philosophy of the Smart Grid (SG) has emerged with the rapid modernization of theconventional electricity grid, by integration of many features from the fields of informa-tion and communicainforma-tion technology (ICT). The SG offers innovative power engineering solutions for sustainable energy management through integrated sensor, monitor, com-munication and automation technologies. An official definition of the SG by the European Technology Platform of Smart Grids is as follows: “a smart grid is an electricity network that can intelligently integrate actions of all users connected to it—generators, consumers and those that assume both roles— in order to efficiently deliver sustainable, economic and secure electricity supplies” [151].To integrate SG features into the current electric grid, it has become necessary to gather information from all parts of the grid, process large amount data to determine efficient and reliable control strategies, and perform these actions in real time. Furthermore, the SG vision includes active end-user participation, which means that customers must have the ability to play a role in electricity markets and control operations through the ICT infrastructure.
Additionally, the SG vision contains new challenges to address issues such as global warming, increasing demand and energy prices, depletion of carbon-based fuel re-sources, and human health and safety concerns. It is thus a necessary concept to enable modified economic, social and environmental policies that could provide short-term and long-term benefits [148, 148]. To deal with these novel challenges, the SG enables to adapt new types of sources in the current electricity network, and offers opportunities for realizing a sustainable and reliable energy future [152].
SG systems are considered as the future of power systems, in that their features can contribute to resolve the above issues. However, the SG is a generic subject for power engineers, that contains a wide-range of topics. Thus, the implementation of the SG and its various applications into the current electricity network became popular and attracted significant attention by the power engineering community over the last few years. In this chapter, the concept of SG is briefly introduced for the residential, commercial, industrial and transportation sectors. Parts of this chapter are adapted from a published article [145].
1.1/
C
ONCEPT OF SMART GRIDDevelopments in ICT, control, communication, and associated applications have provided new tools for modernizing the traditional electricity grid. The evolution of the SG heralds a more interactive, distributed, and flexible role for the end-user in the day-to-day operations of the infrastructure. Consumers are provided access to near real-time information and can benefit from technologies such as two-way communication, distributed generation (DG) and controllable loads, thus changing from passive to active participants in the SG [92].
Electricity grid operators respond to the changing demand of consumers by adjusting generation and ensuring that transmission and distribution (T&D) assets are carrying no more than their rated value, efficiently and reliably. Historically, generation capacity was built to accommodate consumption peaks, i.e., the highest demand. But such peaks tend to increase over the years, for example due to population increase and the introduction of new consumption habits and devices (such as the personal computer in the 1990s and the projected electric vehicles growth in the coming decades). Although the increased electricity demand can be met by central bulk generation plants, the T&D system must be upgraded—at high cost—to accommodate these higher capacities. However, this kind of approach would be costly and too slow. On the other hand, distributed energy re-sources (DER)—located in proximity to end-user loads—provide a promising alternative to grid reinforcements, building new centralized bulk generation capacity, or building new or upgraded transmission lines.
DER are relatively small energy sources, with rated capacity ranging from a few kWs in residential buildings to several MWs on the distribution grid. DER can also be either con-ventional (e.g., micro-turbines and diesel generators) or renewable energy sources (RES) (e.g., solar photovoltaic (PV), wind turbines and biomass converters). Due to growing concerns of climate change, RES are increasingly preferred to conventional sources. One of the issues related to RES integration is their intermittent generation characteristic [49]. The stochasticity of RES output, combined with the uncertain behavior of the con-sumer, implies greater difficulties in ensuring a real-time balance between generation and demand for system operators. The uncertainty in availability of generation and demand can be mitigated using energy storage, but this solution is currently either prohibitively costly or inefficient at bulk levels, or fraught with environmental constraints (such as for pumped hydro storage systems). A recent change is that connecting additional RES is becoming less expensive than traditional grid reinforcements. However, this requires advanced control methods adequately integrate these sources in current electricity infras-tructures.
Another approach is to increase the flexibility of demand-side resources, i.e., the electric loads. Such approaches require extensive, reliable information on the whole system. This data can be accessible through ICT, typically using sensors and supervisory control and data acquisition (SCADA) on the T&D system. This in turn enables monitoring and control of resources such as DER and storage, which may then result in reverse energy flows, from consumers to the utility. Through such local resources, end-users are thus able to actively participate in electric network operations. This is a major shift from traditional bulk power generation, as many more small-scale producers are expected to connect to the grid. Moreover, consumers can also be small-scale producers (prosumers) by investing in DER, and benefit from market opportunities by deploying SG technologies [41]. This in
turn facilitates improving energy efficiency for a better utilization of resources, at all levels of the networks, with bidirectional exchange of information and power. The concept of SG is illustrated in Fig. 1.1.
Figure 1.1: Conceptual model of the SG.
1.2/
E
LECTRIC ENERGY MANAGEMENTWith the implementation of the advanced metering infrastructure (AMI) [42], customers become active participants by generating or storing energy, and/or changing their con-sumption patterns. Therefore, customer interaction plays a key role in network operations for the successful implementation of electric management strategies.
1.2.1/ DEMAND SIDE MANAGEMENT
Demand side management (DSM) approaches focus on improving the efficiency of uti-lization of energy resources in the customer domain. However, DSM can be applied to all types of energy resources, not just electricity. DSM is commonly defined as “the planning, implementation, and monitoring of those utility activities designed to influence customer use of electricity in ways that will produce desired changes in the utility’s load shape, i.e., changes in the time pattern and magnitude of a utility’s load. Utility programs falling under the umbrella of demand-side management include: load management, new uses, strate-gic conservation, electrification, customer generation, and adjustments in market share” [129, 45].
The following DSM approaches are listed in the literature according to their objectives [123]:
• Peak shaving, or reduction of the system peak load, aims to decrease peak power
consumption during on-peak hours. Peak shaving can help reduce the necessary peaking capacity and hence lower operating costs and dependence on fossil fuels.
• Valley filling aims to increase demand during low consumption hours, in order to
profit from lower prices, while decreasing the overall cost and improving the system efficiency.
• Load shiftingreduces demand during on-peak hours by deferring loads to off-peak
hours. It is commonly achieved by scheduling load operation times to flatten the consumption curve, and improve efficient generator use.
• Strategic conversation aims to reduce in the general load profile, for example via
increased energy efficiency measures.
• Strategic load growth aims to “intelligently” increase the total load over the time
horizon, beyond valley filling. This growth can result from transfers between types of energy, for example, related to the integration of heat pumps or electric vehicles.
• Flexible load shaping is a form of advanced consumption shaping, that sets
load-limits at specific hours on the requirements of the grid, such as system reliability and planning constraints.
Peak shaving, strategic conservation and load shifting aim to reduce the load and are the most frequently listed techniques in the literature, as they enable deferring or canceling heavy investments in equipment with higher capacity (such as power lines and transform-ers). An illustration of the impact of the different approaches is shown in Fig. 1.2.
Figure 1.2: DSM approaches, adapted from [123]: (a) load shifting, (b) peak shaving, (c) strategic conservation, (d) strategic load growth, (e) valley filling, (f) flexible load.
1.2.2/ DEMAND RESPONSE
The demand response (DR) concept was introduced several decades ago, but has only gained widespread popularity over last few years due to progress in ICT and AMI appli-cations. The terms DR and DSM have relatively close meanings, but are used to address different philosophies. The goal of DR is to change end-users’ consumption (i.e., the load curve), typically in the range of 1-4 h, as a result of interactions with a service provider, while the objective of DSM is to improve the efficiency of consumption from the customer side. A common definition of DR is: “changes in electricity usage by end-use customers from their normal consumption patterns in response to changes in the price of electricity, or incentive payments designed to induce lower electricity use at time of high wholesale market prices or when system reliability is jeopardized” [13, 11].
In the literature, DR programs are mainly divided into two main groups [122]: incentive-based programs (IBP) and price-incentive-based programs (PBP). IBP and PBP programs are further subdivided by the Federal Energy Regulatory Commission (FERC) [44] as shown in Fig. 1.3.
Figure 1.3: Types of DR programs.
IBP can be classified into six categories depending on their control modes: direct load control (DLC) [97, 126], interruptible/curtailable (I/C) [110], demand bidding (DB) [29], emergency DR (EDR) [103, 18], capacity market (CM) [26], and ancillary services market (AS) [111, 124]. In IBP, the participants receive a financial incentive if they change their consumption according to terms defined in a contract.
• InDLC, the service provider has a remote access to the loads of the customers and can directly control them.
of consumption reduction.
• DB, customers bid for load reduction at a given price, and if the bid is cleared, customers decrease their consumption, otherwise they are penalized by the service provider.
• In EDR, financial incentives are only offered for load reductions when the system reliability is in danger.
• In CM, load reductions are committed before the occurrence of the critical condi-tions.
• InAS, customers bid load reductions on the ancillary services market. If their bid is accepted, they perform the curtailment and receive the market price as a compen-sation.
In PBP, the utility indirectly affects the electricity consumption of the customers using time-varying pricing schemes, usually in order to reduce the peak consumption of demand. In other words, the time-varying pricing mechanisms (shown in Fig. 1.4) are designed to modify the behavior of the customer, thus the customer is able to change the amount and time of electricity energy usage depending on its preferences. Various pricing algorithms are used to encourage customers to actively participate [80, 121]:
• Time-of-use(TOU) is a pricing mechanism in which different rates are used
depend-ing on the time of the day. Several blocks of hours are defined as off-peak, average load and on-peak periods. The rate is designed to be higher during the on-peak periods, and lower during the off-peak periods [138].
• Real-time pricing (RTP) has dynamic rates that change for every hour of the day.
The forecasts of these rates are given a day or an hour in advance by the service provider to the customers. RTP is more fluctuating than TOU and better reflects the real-time balance between generation and demand [119].
• Critical peak pricing(CPP) is a pricing mechanism that is sometimes used in
addi-tion to TOU in order to present higher charges to the customers during times when operating conditions are critical, such as during contingencies, and is therefore only used a few times a year [143].
DR programs are a key concept not only to reduce the electricity cost, but also to decrease carbon-dioxide (CO2) emissions by reducing the need for polluting peaking power plants.
As a consequence, DR is able to provide benefits for both the customers and the service provider. On the one hand, customers can change their consumption habits so that their electricity expenses are reduced, and on the other hand, DR helps the service provider by reducing the stress of operation on grid assets, decreasing outage risk, providing efficient utilization of RES, and securing grid reliability and stability.
1.3/
F
LEXIBILITY OF DEMAND-
SIDE RESOURCESUnderstanding the operation of the different load types and user consumption habits on the customer side—residential, commercial, industrial and transportation—plays a key
(b) (a)
(c)
Event
Figure 1.4: DR pricing shemas: (a) TOU, (b) CPP, (c) RTP.
role to determine flexibility options for DSM programs. Typically, flexibility is needed for applying load control algorithms in which customers respond to price signals, and/or en-able remote control of their devices through DR programs. However, the provided flexi-bility capacity will be different for each sector, due the diversity of equipment types and consumption purposes. Therefore, load curves and the participation opportunities of each electricity sector should be explored and classified for engagement of load-management models.
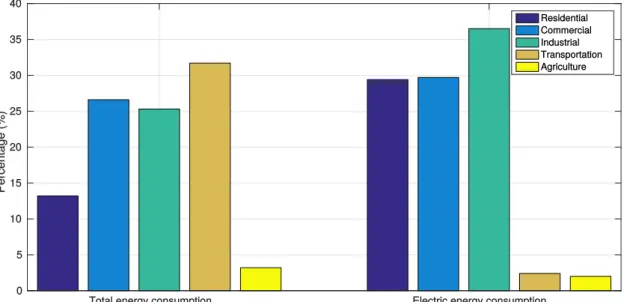
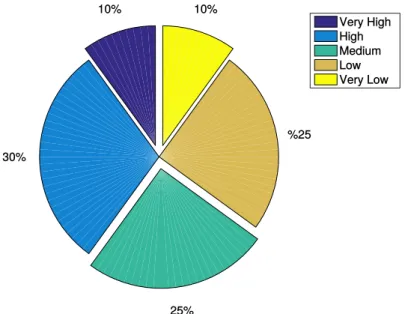
In Fig. 1.5, the electricity consumption percentage of each sector provided by the Eu-ropean Environment Agency for EU-27 countries in 2010 is shown [75]. The consumed electric energy is relatively close in residential, commercial and industrial sectors, which account for approximately 95% of all consumed electric energy. On the other hand, the transportation sector still has a small share with 2.4%. However, the highest energy con-sumption (i.e., not only electricity) is for the transportation sector with 31.7% (in Fig. 1.5) which means that other sources like petroleum and natural gas are the most commonly preferred resources for energy supply in the transportation sector.
1.3.1/ RESIDENTIAL SECTOR
Households are the main consumption sources in this sector, which represents 30% of the total energy consumption. Understanding the flexibility opportunities in this sector is non-trivial due to the distributed architecture and self-interested character of the users. Privacy concerns, levels of comfort, and diversity in household structures and equipment types are the primary obstacles.
However, over the last few years, classical residential building technologies have evolved to include more advanced features so as to enable the transformation of traditional struc-tures into so-called “smart homes” [92]. These homes typically include schedulable ap-pliances, DG, energy storage, electrical vehicle (EV), and a home energy management system (HEMS) controller providing access to near real-time information on electricity consumption, weather, changing electricity rates, and enabling technologies such as the Internet-of-things. Fig. 1.6 depicts the smart home concept with its components.
Figure 1.5: Total energy and electric energy breakdown for each sector.
Figure 1.6: Smart home architecture.
needs of customers while meeting their comfort and economic requirements. Communi-cation between the service provider and the customer is achieved through AMI and smart meters. Using the information provided by the service provider (e.g., forecast and real-time prices, DR requests) and local information on generation and loads, HEMS attempt to change the electricity profile of smart homes by adequately scheduling the use of local and grid resources.
In smart homes, the power consumption of the various loads can be measured by “smart plugs” [10], and additional information may be collected by sensors for environmental fac-tors such as temperature and irradiance [81]. The gathered information is typically cen-tralized by the HEMS, through wireline or wireless communication, together with the price signal. A graphical user interface (GUI), commonly delivered to the user via a computer interface or a smartphone app provides the user with information on current conditions (e.g., consumption, price). Such information is vital for making informed decisions, setting preferences for using smart appliances, or for overriding automatic schedules.
Household appliances are often divided into three categories, according to their oper-ational characteristics and controllability, although terms may vary: baseline loads (not controllable), burst loads (fully controllable), and regular loads (partially controllable) [52]:
• Baseline loads, also called non-deferrable loads or must-run appliances, include
appliances which are run directly by the customers, and are not controlled by an automated HEMS algorithm. As the usage of such loads is entirely dependent on end-user behavior, there are no exact operation time intervals for them. As a con-sequence, models of these loads typically rely on historical load profiles. Lighting, computers, televisions, ovens, music players and other electronic devices are ex-amples of baseline loads.
• Burst loads, also called deferrable-shiftable or scheduable loads, have specific
op-eration time intervals with a given energy consumption defined by the technical characteristics of the appliance. These loads can be shifted in time, and may also be paused at specific predefined cycle times. This ability enables significant energy consumption flexibility. For example, a washing machine cycle includes several phases. At the end of each phase, the machine can stop and resume its cycle a few minutes or hours later [107]. Similarly, a clothes dryer usually operates after a washing machines cycle is over. Therefore, the clothes dryer cycle may also be shifted several hours later [71].
• Regular loads, also called deferrable-thermal loads, are periodically working
appli-ances with varied operation cycles, and that are affected by environmental con-ditions. These loads can be interruptible and manageable for short periods of time, depending on end-user preferences. Thermal loads such as electric water heaters, space heating, air conditioning and refrigerators are included in this cate-gory [68, 66].
In the residential sector, each end-user has different energy consumption habits depend-ing on behavioral patterns, house occupancy, geographic location, climate conditions, and economics. Therefore, in addition to the technical characteristics of appliances, his-torical information about the end-user must also be taken into account while modeling the energy consumption of a house [50].
1.3.2/ COMMERCIAL SECTOR
The commercial sector consists of a wide variety of buildings, such as retail, banks, ho-tels, real estate, education centers (e.g., universities, institutes), and electricity, gas and water supply services. Compared to the residential section, the commercial sector has a more centralized structure as each building has a higher energy consumption, such as for hotels (hundreds of rooms with big halls and various facilities). Most of the consump-tion sources are the same as in the residential sector, however a larger amount of such sources is to be considered compared to households.
Commercial buildings are high consumption sources, and thereby can provide ancillary services to the utility (by load curtailment) in the distribution grid. Demand-side solutions (load-management and DG integration) can provide significant operational cost reduction while reducing the peak load consumption of buildings in critical conditions by deferring unit operation, such as with Heating-Ventilation-Air-Conditioners (HVAC) devices [142].
However, such methods require detailed and accurate modeling of the building structure to estimate and control indoor temperature without violating user preferences in the facil-ities.
On the other hand, when outages occur on the main grid, commercial buildings can dis-connect from the main grid to keep critical services alive. To enable this feature, backup power sources must be installed to provide electric energy during blackouts [133]. Most commonly, outages are often backed up with diesel generators, which are generally more expensive (in terms of operational expenditures) compared to grid prices [142]. Hence, RES and storage units can be used as an alternative to diesel generators. However, such a change requires more detailed analysis by taking into account the intermittent nature of RES.
1.3.3/ INDUSTRIAL SECTOR
Industrial loads consume the highest amount of energy compared to other sectors. Hun-dreds of different types of industries (e.g., automotive, textile, furniture, electronics) exist with various types of electric machinery (e.g., engines, turbines, valves, pumps, compres-sors). Therefore, the industrial sector can provide various opportunities for demand-side management in the electricity network.
As in the commercial sector, industry has a centralized structure with high power electric machines that are used for different tasks, such as carrying, lifting, crushing and melting. Load profiles exhibit differences as different products and materials are used. Therefore, understanding and using the flexibility opportunities with industrial loads is more difficult than for other sectors [3]. However, the impact of DSM tools is more effective compared to other sectors, hence the flexibility of the loads in this area plays a crucial role for ancillary services.
However, the delay of operation of a single unit can cause losses amounting to thousands of dollars or more. Thus, load-management sometimes may not be possible for specific loads and/or during specific times. For example, a particular process may be inter-locked with other processes, or sometimes certain processes are continuous hence it is not possible to stop them [6]. In such cases, the loads are must be controlled in a coordinated manner and, if necessary, some storage space can be placed between two processes. Efficiency and effectiveness of the load-management algorithms can then be secured. Consequently, DR has to be adapted to each customer, so it is difficult to have a generic solution for all types of customers.
1.3.4/ TRANSPORTATION SECTOR
Although the transportation sector consumes the lowest amount of electric energy, it is responsible for the highest energy consumption among all other sectors. The reason is that most of the energy is from carbon-based energy resources (i.e., petroleum). The transportation sector consists of many forms of vehicles such as personal cars, buses, trains, boats and ships. Many of these vehicles currently do not use electric motors. Therefore, combustion engines are still common in transportation, which impacts CO2
emissions.
in-terest in electric vehicles (EV) has increased for cars, buses and trains. However, these changes threaten the reliability and the stability of the electricity network. Charging of an EV (i.e., a personal car) can require two or three times more power compared to a typical single home power consumption. Therefore, as mentioned earlier, the grid should be reinforced with increasing capacity in transmission and distribution, which is costly and slow. Otherwise, intelligent charging strategies should be deployed to protect grid reliability and customer comfort.
1.4/
P
ROBLEM STATEMENTSG technology is based on the collection of relevant data, and the implementation of control strategies to increase the efficiency of resource utilization in addition to ensuring grid reliability. However it is certainly not possible to process data from every level of the electrical network, which may contain billions of resources. Therefore, decentralized control strategies are required.
Especially, as DG gains in popularity throughout the world, neighborhoods are expected to turn into small microgrids (MG) (also known as nanogrids) that can operate indepen-dently from the rest of the main grid. This feature is only possible if such neighborhoods are constructed with AMI, and homes are equipped with smart meters and HEMS to make local resources (appliances, DG, storage, and electric vehicles) accessible and controllable. This, in turn, enables self-consumption mechanisms, where smart homes consume their own generated energy, or through cost-efficient electric energy manage-ment. Thus, with SG technologies, customers gain the opportunity to become active participants through smart homes, e.g. by controlling their appliances in response to system conditions [130, 108].
At the scale of a smart home, several resources can be used: DG, typically in the form of PV panels, energy storage (batteries), and DSM in the form of DR. By enabling some loads to be stopped or shifted in order to reduce the energy consumption at a given time, DR programs bring flexibility to the customer side in neighborhoods. However, comfort and cost reduction levels are crucial issues for active participation: end-users need to find a trade-off between the loss of comfort and the expected savings. If an end-user thinks that the signed DR program may not be worth using, he/she may decide to turn the controller off, and become a passive customer again [14]. Moreover, DR programs should take into account end-user preferences, which are typically determined by their living habits. Depending on usage and characteristics, appliances need to be categorized (non-deferrable, deferrable–shiftable, and deferrable–interruptible) to ease the control process without impacting user comfort.
Although individual customers are encouraged to take advantage of participation in DR programs, uncoordinated decision-making (single home load-management) may limit the overall performance of the proposed algorithms. This may lead, for example, to unex-pected issues in the distribution grid, such as rebound peaks, overloading, or contingen-cies [39]. An example is shown in Fig. 1.7, where the peak load is higher after DR than before, as most loads were shifted to the same period. As a consequence, the system stability can be put at risk. Hence, the design of coordination mechanisms for smart homes is necessary in neighborhoods, so that smart homes can adjust their strategies without negative side-effects for the utility or the community as whole.
Time (hour) 5 10 15 20 Power (kW) 200 300 400 500 600 700 800 900 1000 Before DR After DR
Figure 1.7: Rebound peak effect with uncoordinated DR.
Under this purpose, this dissertation focuses on the development of coordination mech-anisms established among smart homes in a neighborhood area. Various coordination mechanisms are presented and compared, using different control approaches (central-ized and decentral(central-ized), and various pricing schema, with two complementary objectives: economic well-being (cost reductions) for end-users and grid reliability (peak reduction) for the utility.
1.5/
O
RGANIZATION OF THE DISSERTATIONThe remainder of this dissertation is organized in five chapters as follows. In chapter 2, a detailed state-of-art review is presented for electric energy management strate-gies through the coordination of multiple smart homes. The chapter starts by giving an overview of load-modeling techniques and single home energy management using DR programs. After that, this chapter explains why coordination mechanisms are required and how smart homes can be controlled in a coordinated manner in neighborhoods. Ac-cordingly, coordination mechanisms are classified based on the used control and com-munication architecture, and popular coordination techniques are listed by reviewing se-lected studies. Lastly, the chapter is concluded with a summary of the reviewed coordina-tion studies from the literature. Parts of this chapter are adapted from a published journal article [145].
In chapters 3, 4 and 5, several centralized and decentralized coordination mechanisms are proposed. These methods are compared with a baseline scenario (without control and coordination)—in all chapters—and with selfish control (without coordination)—in chapters 3 and 4—to evaluate the effectiveness of the presented algorithms. In chapter 3, an energy trading algorithm is presented where smart homes are sellers and buyers in the neighborhood. To increase the interest in energy trading inside the area, a
neigh-borhood pricing scheme is proposed with an enhanced grid TOU, a feed-in tarrif (FIT) and incentives. In the neighborhood, customers only trade with each other using self-generated renewable energy. End-users are the owners of DG and the energy storage in the neighborhood area. Centralized and decentralized control algorithms (schedul-ing electricity appliances and battery charg(schedul-ing/discharg(schedul-ing) are developed and compared with each other in terms of cost reduction and computation times. In the centralized one, the aggregator is the controller that determines the control decisions using the re-ceived household information. In the decentralized one, HEMSs are the controllers in the smart homes. They optimize themselves, and the aggregator is the advisor which informs HEMSs about the electricity price and the neighborhood electricity (consumption, generation and storage) situation. Parts of this chapter are adapted from a published book chapter [132].
In chapter 4, two decentralized coordination algorithms are proposed as an extension of the work in chapter 3. Compared to it, the control and communication architecture is improved, although there are similarities with the proposed coordination mechanisms. In this work, a dynamic pricing structure is based on the neighborhood consumption and the grid TOU price is used to bill customers for their electricity consumption. Moreover, the effects of forecasting errors on the consumption and generation profiles are also consid-ered. The performance of the control algorithms are evaluated with annual simulations through three novel metrics. Parts of this chapter are adapted from a journal publication [144].
In chapter 5, the impact of residential PVs on aggregator and customer profits is analyzed. The aggregator interacts with the spot market and the utility as well as smart homes to control electricity appliances, by proposing an alternative price called customer incentive pricing (CIP). The aggregator achieves to make profit as long as it proposes a convincing price (i.e., lower than spot and/or utility price) for controlling home electricity appliances. The existing control algorithm is modified to integrate residential PVs, and simulation results are compared with a no-PV case. Parts of the explanations related to this work, which was developed in collaboration with Colorado State University, are based on an accepted conference publication [146].
Lastly, the contributions of this work are overviewed, and the possible future works are listed in chapter 6. After that, this dissertation is concluded.
S
TATE
-
OF
-
THE
-A
RT
R
EVIEW
H
EMS create opportunities to develop flexibility strategies for the residential sectorthrough smart meters and AMI. The proposed control algorithms motivate users via economic profits, but also benefit service providers by reducing operation expenses as well as maintaining the reliability of the system. Moreover, these approaches can also be combined with RES and energy storage to try to balance generation and consumption under the concepts of self-consumption and self-sufficiency.However, most of the time, uncoordinated HEMS are not able to reach their target ob-jectives in terms of economic and environmental efficiency. Moreover, based on the area electricity profile, these methods may lead to the occurrence of unexpected conse-quences (e.g. contingencies). Hence, proper control methodologies should be explored to overcome efficiency and reliability issues through coordination between entities in the residential sector.
This chapter discusses several aspects related to coordination, from load modeling to multiple-home energy management. With respect to this defined objective, literature pa-pers between 2010 and 2016 are reviewed and classified according to their similarities and differences.
2.1/
L
OAD MODELING TECHNIQUESDesigning efficient and reliable HEMS usually requires load models to estimate the impact of control strategies on home energy consumption. In the literature, two main approaches are followed for modeling residential loads: top-down and bottom-up approaches. While top-down approaches model each home or the whole residential area as a single unit, bottom-up approaches investigate the energy consumption of each individual load (or group of loads), and aggregate these to obtain the consumption of the whole area or house. A comparison between two approaches is given in Table 2.1. A comparative review of such models for the residential sector may also be found in [23].
2.1.1/ TOP-DOWN APPROACHES
The principle of the top-down approach is to aggregate all energy consumption units in one spot (e.g., a home or several ones); thus only the total energy consumption of a house or a residential area is known [55]. Top-down models often rely on historical data to
model the energy consumption of an area, and are typically used to investigate the effect of long term changes (five years or more) on load profiles. The main advantage of this approach is simplicity, as load profiles. Such data is commonly available, for example from distribution transformers. On the other hand, the main drawback of this method is that information about individual peaks, types of loads, load factors and customer behavior are overlooked. As a consequence, precise control strategies cannot be studied, used, or developed with such models.
2.1.2/ BOTTOM-UP APPROACHES
Contrary to the top-down approach, the bottom-up approach investigates the energy con-sumption of each household appliance (or group of appliances) separately. By aggregat-ing the consumption of each appliance, the load curve for a saggregat-ingle home or several ones may be easily obtained [85]. Bottom-up models give control system designers the ability to identify areas of potential improvement. However, a drawback of bottom-up models is the difficulty to obtain such detailed data on the consumption of each appliance, as this is typically not readily available in standard homes due to limited instrumentation. Moreover, a validation of the model is required, e.g., by comparing the aggregated load curves with actual measurements from top-down approaches.
On the other hand, grouping household appliances helps in identifying which appliances can be controlled and how long they can be managed over a certain time horizon. The flexibility of the house demand can then be investigated. Therefore, bottom-up ap-proaches enable understanding the behavior of each appliance as well as each home using statistical analysis. It is thus a requirement to enable the precise control of smart home resources using DR and related techniques.
2.2/
H
OME ENERGY MANAGEMENT IN THE RESIDENTIAL SECTOR With the concept of smart home, HEMS with DR programs in the residential sector have been a topic of interest, but only gained significant momentum recently, with the advent of what is now known as the SG. This led to publications in both scientific [67] and popular [101, 22] literature, indicating an interest from researchers as well as from the general public. In the following, single home energy management studies with DR programs are briefly reviewed.Table 2.1: Residential energy consumption modeling approaches [23].
Advantages Disadvantages Typical scale
Top-down Simplicity, easy access to
data.
Limited information on in-dividual behaviors.
Neighborhood, city, re-gion, or nation.
Bottom-up Detailed information on
individual behaviors.
High model complexity, difficulty of data acquisi-tion.
Individual or groups of residences.
2.2.1/ INCENTIVE-BASED SINGLE HOME ENERGY MANAGEMENT
The following paragraphs review selected IBP methods, with a focus on single home energy management. In [61], a load commitment formulation is extended with a DLC pro-gram to control responsive loads in emergency conditions (e.g., the loss of a large genera-tor or transmission line), and to provide lower electricity costs and peak-to-average (PAR) values through appliance scheduling. The gained profit is related to consumer comfort, and is determined by the electricity cost reduction. When the household consumption is decreased in the emergency condition, the electricity tariff decreases. Compared to the base case, when the consumer tariff decreases in the emergency condition, the con-sumer neglects its comfort, and a cost reduction is obtained for the simulation duration. However if he consumer gives priority to its comfort, the total cost slightly increases. In [113], the HEMS problem is formulated as a mixed-integer nonlinear program (MINLP) with an inconvenience factor that corresponds to the difference between the baseline and optimal results. An incentive reward for power reduction during peak hours is considered. The MINLP program schedules 10 controllable appliances with operation time limits and power rates, as defined by the customer. Incentives are defined for early morning and after working hours. Compared to the reference scenario, customers can save up to 25% in electricity costs.
In [117], incentive rewards are used with battery and PV management for controlling household area consumption. The used method takes into account the stochastic behav-ior of price, water usage, PV generation and loads. Incentive rewards are offered based on the participation of the customer to the DR event. Results show that DR can decrease the customer electricity bill by 18%.
The above studies show that using IBP, in critical conditions, the utility can satisfy grid se-curity requirements and consumers can reduce their electricity bills. However, consumers cannot benefit from frequent cost reductions, as they depend on utilities for receiving in-centives. Moreover, if a consumer accepts the IBP contract and does not participate in the program when the request from the utility is received, he/she will be penalized. Also, if DR requests are too frequent and its comfort is impacted more often than expected, the customer may choose to opt-out of the program. Another difficulty lies in determining the baseline load profile for the end-user, so the financial compensation can be determined. While there is little difficulty in achieving this for selected types of industrial and commer-cial users, it may be more complex for residential ones due to the high number of small loads running.
2.2.2/ PRICE-BASED SINGLE HOME ENERGY MANAGEMENT
As for IBP, a short review of selected PBP methods is proposed below. In [54], TOU is used to minimize the electricity bill of consumers while taking into account end-user preferences and managing overload conditions. User preferences include the acceptable time intervals for appliances to run. TOU is used in three simulation scenarios, each with a different objective: (a) avoiding overload, (b) optimizing savings, and c) participating in a DR program. Simulation results show that all strategies achieve their expected goal; however, although b) can include a), c) considers different constraints and cannot be directly compared with others.
An adaptive neural fuzzy inference system (ANFIS) is used for forecasting the expected electricity demand, then a branch-and-bound method is used for appliance scheduling. This study takes into account TOU tariffs with power availability at specific time intervals and consumer comfort. Results show a reduction in the total cost of deferrable appliances electricity cost from $0.19 to $0.14, for the simulation duration.
In [40], a performance comparison is presented for different HEM applications for con-sumer benefit. The impact of TOU, RTP, and priority-based scheduling are compared. Simulations are performed for 210 days. Cost reductions are determined for several sce-narios: 30% with TOU, 45 % with TOU and PV with FIT, 27% without the FIT, 9% with priority-based scheduling, and 18 % with an RTP program.
In [51], scenario-based stochastic and robust optimization algorithms are presented to schedule household appliances using 5-min intervals with RTP pricing. The presented methods also take into account RTP uncertainties while minimizing operation costs. Both optimization methods are compared in terms of performance and computation time. Re-sults show that while stochastic optimization achieves 26.6% cost reduction, robust op-timization exhibits lower performance with 24.3% reduction. However, the computation time for robust optimization is shorter than for stochastic optimization.
In [77], an HEMS is presented to reduce the cost of consumed energy under RTP by scheduling resources and PV and battery operations. It uses a framework called Action Dependent Heuristic Dynamic Programming (ADHDP) that relies on neural networks. An online and an offline particle swarm optimization (PSO) algorithm are used to determine the optimal schedule, as well as for pre-training the networks and improve algorithm per-formance. While the online PSO algorithm works only in the current time period, the offline PSO algorithm also uses data on forecast RES generation, load and prices near the current state. Results are compared in four different cities. Depending on the consid-ered city, savings can reach 9.3%, and ADHDP with offline PSO pre-training returns the best results.
In [72] and [100], authors combined the RTP price with incremental block rates (IBR). IBR is a pricing scheme where the unit price increases with the amount of electricity consump-tion, i.e., the higher the consumpconsump-tion, the higher the unit price. In [72], two approaches are considered for HEM design: deterministic and stochastic. The stochastic approach considers uncertainties in appliance operation time and consumed energy through an energy adaptation variable β, while the deterministic approach, based on linear program-ming, does not. A total load consumption limit is defined for the smart home, so that excess loads are tripped. Compared to the baseline case, results show that to the total cost can be reduced by up to 41%.
In [100], the authors combine RTP with IBR and compare full and partial flexibility in load scheduling. In the full flexibility approach, individuals only focus on profit (or savings) and preferences are not considered, while for the partial flexibility approach, customer preferences are also taken into account in the scheduling process. Both are formulated as mixed integer linear optimization problems. Results show that end-user costs decrease on average by about 20% when the schedule is partially flexible.
In [95], an HEMS is developed with a two-horizon algorithm (THA) and a rolling-horizon technique. Goals are to increase computational efficiency compared to traditional moving-window algorithms, and to achieve load management with TOU, RTP and a pre-defined peak demand charge (PDC) paid for electricity bought during peak periods. The algorithm uses two time horizons: one is for short-term scheduling with a high time
reso-lution (THA-s) and the other is for longer term scheduling with a lower resoreso-lution (THA-l). THA-s is combined with THA-l in the rolling horizon technique to reduce the computa-tional burden of the energy management algorithm. The study shows that the proposed THA algorithm returns 18% better results with RTP than with TOU for a one-week simula-tion. Results show that when the PDC price increases, the THA algorithm achieves more cost reduction.
Through time-varying price signals, the utility or the aggregator provides opportunities for consumers to reduce their bills. Consumers, on the other hand, try to find the right balance between the induced loss of comfort and the financial gains from the DR pro-gram. Overall, PBP can be expected to provide more frequent cost reduction opportuni-ties compared to IBP, as they are not necessarily linked with grid conditions. However, PBP approaches introduce some uncertainty for the utility, as the achieved load reduc-tion amount depends on end-user response to prices. Moreover, due to their frequent and hard to predict variations, schemes such as RTP are difficult for end-users to adapt to, and may be rejected.
2.3/
N
EIGHBORHOOD ENERGY MANAGEMENTIn the previous sections, the proposed methodologies ignored the energy consumption of other households while controlling their own loads. Such myopic HEM strategies may potentially lose the benefits of a global optimum in energy management goals. In typ-ical DR programs, all customers receive the same signal from the utility, thus posing a potentially significant risk that they may all shift their appliances to run during the same hours [57, 125]. In this case, although the objective of the DR program was to reduce demand during high price periods, an unexpected peak demand called “rebound peak” may occur immediately after the DR event has ended. This effect may lead to an even higher demand peak that the DR program tried to avoid in the first place and that may in turn threaten grid stability [63, 70]. For this reason, from the perspective of the utility, such narrowly focused individual customer-side optimization can reduce the effectiveness of DR programs [28]. Coordination mechanisms are therefore required for neighborhood energy management.
In this section, the concept of neighborhood-level coordination is introduced. The com-munication and control structures, the roles of entities (utility, aggregator, and end-users), and the coordination mechanisms used in the literature are described with their respective underlying theories.
2.3.1/ CONCEPT OF NEIGHBORHOOD AREA
Smart neighborhoods rely on individual smart homes, that are interconnected through an electricity and a communication network. These networks enable a variety of mecha-nisms for managing energy at the neighborhood level.
2.3.1.1/ NEIGHBORHOOD AREA STRUCTURE
A neighborhood area may be defined as a group of houses located in the same geo-graphical area. Its size may range from a few houses to possibly a few hundreds. A neighborhood area network (NAN) enables smart homes to communicate and coordinate their actions. The NAN is formed by a collection of smart homes equipped with smart meters to collect consumption and generation data from resources (DG, storage devices, loads). Each meter has two-way communication ability in the NAN. Information is usu-ally aggregated at the feeder or substation level by a concentrator or gateway [76]. This concentrator can then communicate with the utility information system or the aggregators. Aggregators are new entities that, as the name implies, aggregate energy or power from small scale consumers and try to sell this aggregated capacity on markets. Aggregators typically aggregate load reduction capacity from many customers and sell it on markets, hence generating revenue for the participating customers [56, 78].
Depending on the size of the area and local legislation, none, one or multiple aggre-gators may be available [84, 27]. An aggregator may not be required if the local utility communicates directly with each home. However, for large regions serving hundreds of thousands of customers, the number of controllable assets increases dramatically and aggregators can facilitate the coordination of these resources. Aggregators can thus act as intermediaries between the utility and customers for specific needs. In a restructured market, multiple aggregators may be competing with each other, and also potentially with suppliers as in Fig. 2.1.
2.3.1.2/ ROLE OF ENTITIES
In this subsection, the roles of the various entities depicted in Fig. 2.1 are reviewed.
• Utility operator: At the top level, the utility has to ensure reliable electricity delivery
to end-users. As issues such as T&D congestion may occur, DG and DR programs may be useful for the utility to increase local generation or decrease load. The utility can communicate with aggregators and possibly customers to coordinate their actions, e.g., for DR.
• Aggregator: At the middle level, aggregators have three roles depending on
oper-ation conditions: a) The aggregator negotiates with end-users (customers) in the neighborhood to provide DR services to the utility. In this condition, from the end-user perspective, the aggregator temporarily undertakes part of the role of the util-ity operator, and influences electricutil-ity consumption patterns through price/energy-volume signals in the retail market; b) The aggregator receives ancillary service requests from the utility operator to secure the system; c) The aggregator acts as an independent entity and tries to profit from electricity trade, by selling negative load on markets [120].
• End-users: With the increase in penetration of DG and storage devices, end-users
can play several roles [32]. Depending on the electricity balance between house-hold electricity components (e.g., loads, DG, storage units, and EV), end-users are alternatively taking the role of consumer or producer from the perspective of the aggregator.
Figure 2.1: System architecture with neighborhood area networks (CES: Community en-ergy storage).
This structure provides a basic infrastructure for electricity and information flow, that co-ordination algorithms use to achieve their objectives.
2.3.2/ COORDINATION STRUCTURE AND OBJECTIVES
In this section, two coordination structures, namely centralized and decentralized, are distinguished, depending on the used communication and control architectures.
2.3.2.1/ CENTRALIZED COORDINATION
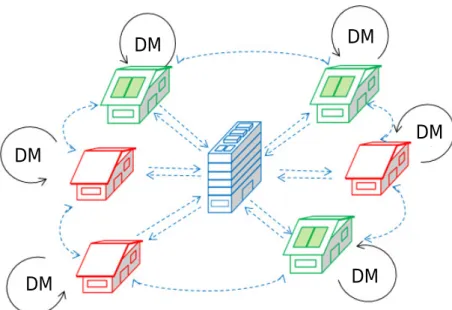
In this framework, as shown in Fig. 2.2, there is one central operator, which can be the utility or an aggregator. This central operator manages (a part of) the electricity usage of all smart homes. It has direct access to all information on end-users’ household electricity appliances through secure AMI networks. Smart meters and HEMS send information about their electricity usage and preferences to the central operator. The operator then optimizes electricity consumption by scheduling appliances operation for each household. The decisions taken by the central operator are then sent to smart homes and the strategy is applied.
In the following, selected papers that use centralized coordination schemes are reviewed. In [58], a day-ahead DSM strategy coordinated by a central operator is proposed for a large residential area including 2600 smart appliances. The goal is to minimize electricity consumption while reducing the PAR of the demand profile. To obtain the desired load consumption, the proposed DSM algorithm uses load shifting to bring the actual load curve as close as possible to an objective (target) load curve derived from the objective of the DSM strategy, i.e., to minimize costs. The proposed DSM method achieves a 5.0% cost reduction, and a 18.3% peak load reduction for the area.