OATAO is an open access repository that collects the work of Toulouse
researchers and makes it freely available over the web where possible
Any correspondence concerning this service should be sent
to the repository administrator:
[email protected]
This is an author’s version published in: http://oatao.univ-toulouse.fr/20456
Official URL:
http://doi.org/10.2166/wst.2018.189Open Archive Toulouse Archive Ouverte
Oliveira, Pedro and Alliet-Gaubert, Marion and
Coufort, Carole and Frances, Christine New insights
in morphological analysis for managing activated
sludge systems. (2018) Water Science and
Technology, 77 (10). 2415-2425. ISSN 0273-1223
To cite this version:
New insights in morphological analysis for managing
activated sludge systems
Pedro Oliveira, Marion Alliet, Carole Coufort-Saudejaud
and Christine Frances
ABSTRACT
In activated sludge (AS) process, the impact of the operational parameters on process efficiency is assumed to be correlated with the sludge properties. This study provides a better insight into these interactions by subjecting a laboratory-scale AS system to a sequence of operating condition modifications enabling typical situations of a wastewater treatment plant to be represented. Process performance was assessed and AS floc morphology (size, circularity, convexity, solidity and aspect ratio) was quantified by measuring 100,000 flocs per sample with an automated image analysis technique. Introducing 3D distributions, which combine morphological properties, allowed the identification of a filamentous bulking characterized by a floc population shift towards larger sizes and lower solidity and circularity values. Moreover, a washout phenomenon was characterized by smaller AS flocs and an increase in their solidity. Recycle ratio increase and COD:N ratio decrease both promoted a slight reduction of floc sizes and a constant evolution of circularity and convexity values. The analysis of the volume-based 3D distributions turned out to be a smart tool to combine size and shape data, allowing a deeper understanding of the dynamics of floc structure under process disturbances.
Pedro Oliveira
Marion Alliet(corresponding author) Carole Coufort-Saudejaud Christine Frances
Université de Toulouse, Laboratoire de Génie Chimique,
CNRS, 4, allée Émile Monso, Toulouse 31432, France
E-mail: [email protected]
Key words|circularity distribution, image analysis, particle size distribution, settleability, water treatment
INTRODUCTION
Among the different technologies for dealing with the strict regulations concerning wastewater treatment, the activated sludge process (ASP) remains extensively applied as a bio-logical treatment because of its low cost and its ease of implementation. This straightforward technique achieves good levels of organic matter removal combining biodegra-dation in an aerated tank with solid-liquid separation through a subsequent clarifier. Although much has been learned about its applicability, ASP sensitivity to unexpected modifications of operating conditions still constitutes an sig-nificant drawback (Mesquita et al. ). As a result, the balance between floc-forming bacteria and the other species within the activated sludge (AS) system is affected, leading to poor sludge flocculation and consequently compromising the effluent quality (Guo et al. ).
Considering the role that operating conditions can play on the dynamics of the structure of AS flocs, it is thus cru-cial to better understand what is behind this interaction. Studies carried out in the last few decades (Palm et al.
; Wilén & Balmér ; Guo et al. ) highlight that variations in the levels of dissolved oxygen (DO) and in the organic loading rate (OLR) are responsible for most of the separation problems that can arise in the pro-cess. Filamentous bulking is one of the disturbances which can occur as consequence of these operating con-dition modifications. The overgrowth of filamentous contents promotes a complex network of open flocs which impacts the sludge compaction, settling and thicken-ing (Mesquita et al. ). Other process parameters, such as solids retention time (SRT), hydraulic retention time (HRT), recycle ratio (RR), carbon/nitrogen ratio (C:N) and nutrient availability are also considered to be factors that could influence the AS floc characteristics (Ye et al. ;Amanatidou et al. ).
Investigations into corrective measures for malfunctions still rely on the assessment of classic sludge and effluent quality parameters. For example, obtaining a sludge volume index (SVI) higher than 150 mL·g!1 obviously doi: 10.2166/wst.2018.189
indicates a loss of clarifier efficiency but it does not provide any further information about what led to this situation. Thus, it would be more practical if the source of the problem was identified. For that purpose, image analysis (IA) has proved to be truly helpful, since it provides a new perspec-tive on the biological aggregates by enabling a full morphological characterization of them (Amaral et al. ). One of the pioneer works quantifying morphological properties to assess AS settleability was performed by
Grijspeerdt & Verstraete (). Their results demonstrated that equivalent diameter and form factor, i.e. size and shape parameters, could be sensitive to variations in sludge settling properties. This study provided support to those ofda Motta et al. (),Casellas et al. () and Koi-vuranta et al. () correlating low values of form factor and high filament lengths to the worsening of settling conditions in the clarifier.
Some of the IA methodologies that have been used to evaluate AS floc morphology were recently gathered and reported byCosta et al. (). All published studies have emphasised the importance of acquiring a sufficient number of flocs in order to present statistically relevant data. Those numbers can vary from 150 to 3,000 objects (both flocs and filaments) per sample, depending on the approach of each study. The present work, on the other hand, has analyzed about 100,000 objects per sample, which significantly increases the accuracy and consequently the statistical reliability of the results found here.
The application of IA techniques has usually supported researchers (da Motta et al. ;Liao et al. ; Liwarska-Bizukojc et al. ) interested in establishing a parallel between the floc morphological parameters and the process performance. Even though the potential of correlating the sludge and effluent quality parameters to the morphological ones is known (Mesquita et al. ), less attention is paid to the importance of how operating conditions may affect AS floc population dynamics in terms of their shape distributions.
In this context, the aim of this work is to bring new insights into this association that, in fact, exists between the three foundations of AS systems: operating conditions, sludge floc characteristics and process performance. There-fore, a pilot system was subjected to a sequence of operating condition modifications leading to various situ-ations that can be found in a wastewater treatment plant. Statistically significant size and shape descriptors, based on the analyze of about 100,000 flocs for each sample, as well as volume-based 3D distributions combining both descriptors were determined and deeply analyzed in order
to enhance the understanding of the dynamics of floc struc-ture under process disturbances and throughout the modifications.
MATERIAL AND METHODS
Pilot AS system
The pilot system was designed to work as an ASP consisting of a cylindrical aerated tank (volume 0.02 m3) connected to a clarifier (0.006 m3). The system was continuously fed through two peristaltic pumps: one for the concentrated syn-thetic wastewater and pH buffering solution (NaHCO3,
35 g·L!1) and the other one for the addition of tap water
to dilute the concentrated solution. Both feed flow rates were calibrated so as to reach a dilution ratio of 1:100. The sludge thickened in the clarifier was recycled to the aer-ated tank. Since the SRT was fixed at 15 days, 1.3 L of waste sludge was removed every day from the bottom of the aera-ted tank.
DO, temperature (19–23"C) and pH (7.0–8.0) were
mon-itored by in situ probes at a frequency of 1 Hz. The pilot system worked under intermittent aeration in order to enable a nitrification-denitrification process to take place. The aerobic (DO > 4 mg·L!1) and anoxic sequencing cycles
were set at 1.5 hours each. Air was supplied at the bottom of the tank through a perforated membrane. The composition of the synthetic wastewater was based on previous works in the literature (Jamal Khan et al. ): 750 mg·L!1C6H12O6
(chemical oxygen demand, COD: 800 mg·L!1); 214 mg·L!1 NH4Cl; 51 mg·L!1KH2PO4; 0.03 mg·L!1FeCl3; 10 mg·L!1
CaCl2; 25 mg·L!1; MgSO4.7H2O. The pilot system was thus
fed with a COD:N:P ratio of 100:7:1 and inoculated with sludge from a municipal wastewater plant (Nailloux, France). Before any operational modifications to the pilot system, a period of almost two SRTs elapsed to allow sludge acclimation. The overall experimental campaign lasted 85 days. Samples were withdrawn from two different ports in the pilot system. The first was at the bottom of the aerated tank, which served for SRT control, image analyses, total sus-pended solids (TSS) and SVI measurements. The second port was located at the clarifier outlet to assess the process efficiency regarding the organic matter removal and nitro-gen contents.
During this study, a total of four operating condition modifications (M ) were performed to change the laboratory-scale AS pilot parameters, as indicated in bold inTable 1.
Each operating condition modification lasted 1 SRT (i.e. almost 15 days) and all were based on typical changes that can take place in real wastewater treatment plants and poss-ibly influence biomass characteristics.
Process performance parameters
The AS performance was estimated by measuring the TSS and the SVI, while the treated effluent was assessed by analyzing the COD, total nitrogen (TN), ammonium (N-NH4þ) and nitrate (N-NO3!) contents. TSS and SVI
were measured following the protocols contained in APHA Standard Methods (Eaton & Franson ). The treated effluent samples for COD, TN, N-NH4þ and
N-NO3! determination were always collected at the end
of the aerobic period to avoid variations in the microbial activity cycle related to aeration sequencing as far as possible. The samples were then filtered with a 1.2 μm glass fiber filter and analyzed in triplicate, once a week, using a Hach-Lange spectrophotometer (DR3900) and Hach-Lange cuvette tests LCI 500, LCK 338, LCK 339 and LCK 304.
Morphological characterization
Samples were analyzed once a week during the Acclimation phase. In the course of the process Modifications (M1 to M4), the morphological characterization was performed every day during the first week and then twice during the second week using the Morphologi G3 system (Malvern Instruments®), a fully automated bright-field microscope coupled with an image treatment software.
All morphological characterizations were accomplished in triplicate using a protocol described by Oliveira et al. (). For each sample, 100,000 flocs were individually analyzed.
Once the AS floc images had been correctly processed, it was possible to obtain a complete morphological
characterization of the sample population. Considering the aggregate size and shape, the circular equivalent diameter (CED) was measured for each floc together with the floc’s circularity, convexity, solidity and aspect ratio according to how they are described by Morphologi G3 software.
The CED is defined as the diameter of a circle that has the same area (A) as the aggregate analyzed, i.e., the floc size is expressed by:
CED ¼ ffiffiffiffiffiffiffi 4A π r (1)
The shape descriptor, circularity (C), measures how close to a perfect circle an aggregate is. It is defined by the ratio of the circular equivalent perimeter (PE) to the actual
perimeter of the floc (P). C can have values between 0 (linear floc) and 1 (circular floc).
C ¼PE P ¼ ffiffiffiffiffiffiffiffiffi 4πA P r (2)
The convexity (Cx) is the shape parameter that measures
the floc edge roughness through the ratio of its convex hull perimeter (PC) to its actual perimeter. When the surface of
an aggregate is very spiky, Cx is close to 0. Conversely,
when convexity values are around 1, the floc surface is smooth.
Cx¼
PC
P (3)
Solidity (S) is the measure of the overall concavities of a particle. It is defined as the actual area (A) divided by the convex hull area (AC). As flocs become more solid (filled),
the actual and convex hull area come closer resulting in solidity values close to 1.
S ¼ A AC
(4)
Table 1|Summary of operating condition modifications
Variables Acclimation
Modifications
M1 M2 M3 M4
OLR (kgCOD·m!3·day!1) 1.00 3.75 (COD: 4,000 mg·L!1) 1.00 1.00 1.00
COD:N ratio 100:7 100:7 100:7 100:7 100:28
Recycle ratio 1:1 1:1 1:1 3:1 1:1
The aspect ratio (AR) expresses the ratio of the floc width (W ) to the floc length (L). The width is the longest projection onto the minor axis among all the possible lines between two points on the floc perimeter and the length is the longest projection onto the major axis among all the possible lines between two points on the floc perimeter.
This property also varies from 0 (very elongated aggre-gates) to 1.
AR ¼W
L (5)
An AS floc population can be organized in terms of classes of a given parameter describing the size or the shape. This strategy allows the samples to be represented graphically by plotting distributions based on number or volume. For example, for a random data set, the total number of flocs ana-lyzed is NT, corresponding to a total volume VT.If the sum of
the volume of all the flocs (N1) with a size somewhere between
CED1 and CED2 is V1, the number (Nb) and volume (Vol)
percentages are calculated using the following relations:
Nb %ð Þ ¼N1 NT
; Vol %ð Þ ¼ V1 VT
(6) A three-dimensional representation combining size and shape can also be considered. In this case, the numerator of the volume percentage (Vol) corresponds to the sum of the volume of the aggregates that have a size somewhere between CED1and CED2and a shape parameter (aspect ratio,
circular-ity, solidity or convexity) somewhere between Shape Parameter1and Shape Parameter2.
RESULTS AND DISCUSSION
Monitoring of sludge performance parameters
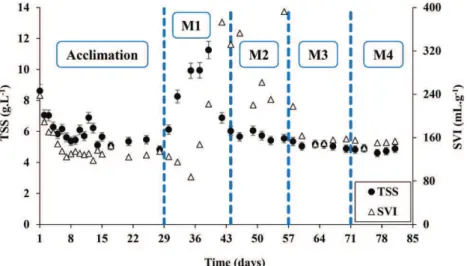
Sludge performance is commonly indicated by measuring the TSS and the SVI. The influence of the operating con-dition modifications on these two parameters is displayed inFigure 1.
The Acclimation phase lasted almost two SRTs. However, considering the evolutions of SVI and TSS inFigure 1, it seems that steady state conditions were reached after about one SRT. For the Acclimation phase, the average stabilized values of TSS and SVI were 5.5 g·L!1and 127 mL·g1respectively. This
TSS value corresponds to an expected biomass concentration under the applied organic load of 1 kgCOD·m!3d!1and the
SVI value is within the range characterizing a sludge with good settling properties (Grady et al. ).
The increase of the OLR from 1.00 to 3.75 kgCOD·m!3d!1
(M1) clearly affected TSS and SVI profiles. The TSS concen-trations increased dramatically, reaching a peak of 11.2 g·L!1on day 39, which suggested a significant growth
of biomass. Then, a drop in the TSS values to about 6.5 mg·L!1was found a few days later. According to direct
observations, this was connected to suspended material that had been washed out with the treated effluent. The SVI showed different changes. Firstly, a diminution of the SVI was observed for almost 6 days, indicating that sludge had settled satisfactorily. Then, from day 37 onwards, the SVI increased strongly, attaining values up to 372 mL·g!1. At this SVI, the sludge settled very slowly and compacted poorly, pointing to a probable separation
problem, which might have been the apparent cause of the sludge washout.
The decrease in the OLR from 3.75 to 1 kgCOD·m!3d!1
(M2) showed that biomass gradually found its own balance (average TSS ¼ 5.6 g·L!1). On the other hand, the AS pre-sented some resistance to recovering its settleability, as demonstrated by the significant variability of the SVI values for this period.
Increasing the recycle ratio during M3 and the COD:N ratio during M4 seemed not to have any major impact on TSS and SVI.
Monitoring of effluent quality parameters
COD concentration (CODOUT) and nitrogen contents
(NH4þ, NO3!) in the treated effluent were measured in
order to assess the effluent quality and the pilot system per-formance. The measurements corresponding to the end of each period are listed inTable 2.
During the Acclimation phase, good levels of COD and TN removal were attained. Organic matter and TN removal efficiencies of 99.2% and 78.7%, respectively, were observed at the end of this period. Low amounts of ammonium (NH4þ)
and nitrate (NO3!) were also measured, suggesting an
effi-cient nitrification-denitrification process. These values are in agreement with the ones reported byMohammadi et al. ()characterizing good AS system performance.
M1 was rapidly reflected in the effluent quality. Before the end of the modification period, where a CODOUT of
37.7 ± 3.9 mg·L!1was measured, a pronounced increase of 298.7 ± 3.1 mg·L!1 had been observed. This increase occurred because of the presence of sludge in the treated effluent for this period, as mentioned before in the analysis of TSS evolution. Although samples were filtered, it is known that a large amount of soluble material can be released during filtration if several cells are lyzed. TN removal rates were also impacted by the modification of OLR: the high concentration of ammonium (NH4þ) in the
treated effluent may also have been a result of sludge
content in the analyzed samples but, alternatively, it may be a sign that the nitrification process had possibly been lim-ited through M1.
Despite the high values of SVI during M2, the decrease of the OLR from 3.75 to 1 kgCOD·m!3·d!1
enhanced COD removal efficiencies since at least 97.8% of the organic load received by the system was degraded. The suction force on the AS flocs applied by the recycling pump may aid decantation in the clarifier and is not taken into account in the SVI measurements. On the other hand, TN removal efficiencies during M2 seemed to still undergo the effect produced by the previous increase of OLR (M1). A decay of the TN removal rates was noted in comparison with those of the Acclimation phase. Of the TN received by the system, only 61.7% could be eliminated at the end of M2. A higher concen-tration of ammonium in the treated effluent was also confirmed. This is probably due to the time necessary for the development of nitrifying bacteria that would have been washed out during M1.
Throughout M3, CODOUT concentrations were slightly
higher than in M2. A few assumptions could be made to explain this modest increase in the CODOUT values but,
since the recirculation of the mixed liquor was increased by a factor of three during M3, the most likely explanation for this result would be the deterioration of the bioflocs due to the pumping effects. As reported by Kim et al. (), an increase in the COD concentrations was to be expected as a result of the release of soluble organic content, which occurred after microbial floc deterioration. With respect to the TN removal, a progressive improvement was seen in M3 and, by the end of this period, an efficiency of 68.2% had been achieved.
The COD removal efficiencies were not disturbed by M4; CODOUT concentration at the end of this phase was even
lower than in M3. Despite that TN concentration of 43.1 ± 1.3 mg·L!1being greater than the admissible by the
Euro-pean standard for final effluent discharge (Fulazzaky et al. ), the TN removal efficiencies in this modification could
Table 2|Laboratory-scale pilot performance in terms of COD, TN removals and nitrogen contents at the end of each modification period
Period CODOUT(mg·L!1) COD removal (%) TNOUT(mg·L!1) TN removal (%) NH4þ(mg·L!1) NO3!(mg·L!1)
Acclimation 6.4 ± 1.4 99.2 11.9 ± 0.5 78.7 2.29 ± 0.03 1.81 ± 0.06 M1 37.7 ± 3.9 99.1 38.9 ± 1.1 86.1 38.5 ± 1.0 0.27 ± 0.10 M2 17.4 ± 0.4 97.8 21.8 ± 1.1 61.7 21.0 ± 1.0 0.69 ± 0.10 M3 24.8 ± 2.7 96.8 18.1 ± 0.6 68.2 13.3 ± 0.6 0.73 ± 0.09 M4 17.5 ± 2.3 97.7 43.1 ± 1.3 81.4 41.6 ± 1.1 0.63 ± 0.02
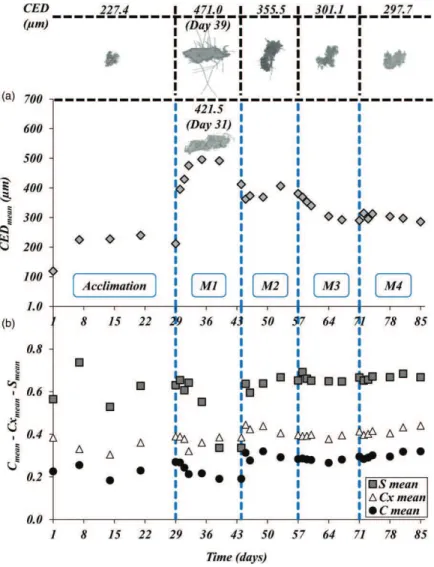
be considered quite pronounced in relation to the amount of nitrogen (232.0 ± 5.3 mg·L!1) coming into the system. Evolution of the mean morphological parameters Images of typical flocs throughout the campaign are shown in the Supplementary Material (Figure S1, available with the online version of this paper). The evolution of the mean floc size (CED), solidity (S), convexity (Cx) and circularity (C)
over the operating condition modifications is shown in
Figure 2. The mean morphological parameters were obtained from the calculation of their volume-based distributions.
Regarding the size of the AS flocs (Figure 2(a)), the mean CEDs observed during the Acclimation phase are con-sistent with the data from previous studies (Wilén & Balmér ; Mesquita et al. ) on an AS process functioning
under normal conditions. The first mean floc size during this phase (118.9 ± 56.2 μm) was smaller than the others and corresponded to the inoculated AS supplied by Nailloux WWTP. After 1 week, the mean floc size increased until it stabilized around 225 μm. Over the next 3 weeks, only small variations were noticed in the size of aggregates, simi-larly to what was observed before in TSS and SVI profiles for this same period.
As OLR changed from 1.00 to 3.75 kgCOD·m3·d!1(M1),
the size of the biological aggregates increased drastically. Twenty-four hours after OLR modification, the floc size had almost doubled, the mean volume-based CED chan-ging from about 220 to 400 μm. Then, it continued to increase slowly reaching a value around 500 μm on Day-35. It should be added that SVI values, and CODOUTand
NH4þ concentrations were proportionally higher at that
point. This exponential increase in the mean CED values can lead to the supposition that flocs became larger but not more compact, since the analyses of sludge and efflu-ent quality parameters revealed a worsening of the pilot performance. Furthermore, the end of M1 and the begin-ning of M2 were marked by a significant decrease in the size of the aggregates, which seemed to be correlated with the decrease of the TSS and the washout of large aggregates.
A decrease in the mean CED from 491.6 to 362.3 μm was noted after the transition from M1 to M2. During the modification, the size of the aggregates stabilized around 370 μm. As a sludge washout was identified at the end of M1, it seemed likely that the decrease in the floc mean size was associated with this incident rather than with the OLR diminution. Considering that the OLR in M2 and in the Acclimation phase were the same, it could be concluded that floc characteristics (such as the size) were not only dependent on the current operating conditions but also on the changes brought about by the previous conditions.
Despite the increment in shear stress due to the increase of the recycle ratio during M3, the floc size did not show a meaningful decrease. The mean floc sizes were 380.9 μm and 304.2 μm at the beginning and at the end of the modifi-cation, respectively. Nevertheless, this result can imply that floc deterioration clearly occurred, confirming the assump-tion about the release of soluble organic material that slightly increased the CODOUTconcentrations in this period.
The modification to a lower COD:N ratio (M4) resulted in a small decrease of the mean floc size (285.7 μm) as com-pared to the beginning of M4 (303.3 μm). This trend was similar to the one described by Amanatidou et al. ()
who observed that, at low COD:N ratios, the amount of denitrification gases (N2) increased inside the aggregates,
leading to floc breakage.
In this study, the evolution of the floc shape properties was assessed over all four modifications.
In Figure 2(b), the evolution of the mean solidity expresses the variations regarding the existence of concav-ities on the floc surface. Considerable fluctuations in this shape property can be seen throughout the Acclimation period. During M1, floc solidity decreased slightly until day 36 and a drop in the values (S ¼ 0.29) was observed immediately afterwards. This evidence, added to the other symptoms, suggests a separation problem since a higher degree of concavities can indicate poor floc compaction. On the other hand, once M2 started, solidity values quickly recovered their initial range without showing large vari-ations during M3 or M4.
Apart from M1, it can be seen that circularity and con-vexity values evolved in a similar manner during the Acclimation and the other modifications. Compared to the solidity, floc circularity and convexity during Acclimation were quite stable (around 0.21 and 0.30, respectively). During M1, in a similar way to solidity, cir-cularity and convexity underwent a small decrease in their mean values until Day-36 of M1. This means that aggre-gates became less and less circular and even rougher. Afterwards, mean circularity did not show any meaningful evolution and convexity values remained constant. Microscopic observations for this period confirmed the occurrence of a filamentous bulking after day 36 (at the top of Figure 2), which could clarify the circularity and convexity behavior from this day onwards. The massive presence of filaments on the floc surface promoted a global shape closer to a circle and caused simultaneous variation of both the actual and the convex hull per-imeter, making convexity less sensitive in this type of situation.
In M2, circularity and convexity values did not recover their acclimation characteristics as was observed for solidity. In contrast, these parameters maintained a steady increase until the end of M4. Since M3 and M4 both promoted a decrease of the aggregate size, circularity and convexity behaviors may be related to a size reduction. Usually, small flocs are more regular (i.e., circular and smoother) than the larger ones (Xu & Gao ).
Overall, it can be considered that the evolution of these three shape properties was mostly affected by the excessive growth of filamentous bacteria encouraged by the increase of OLR during M1.
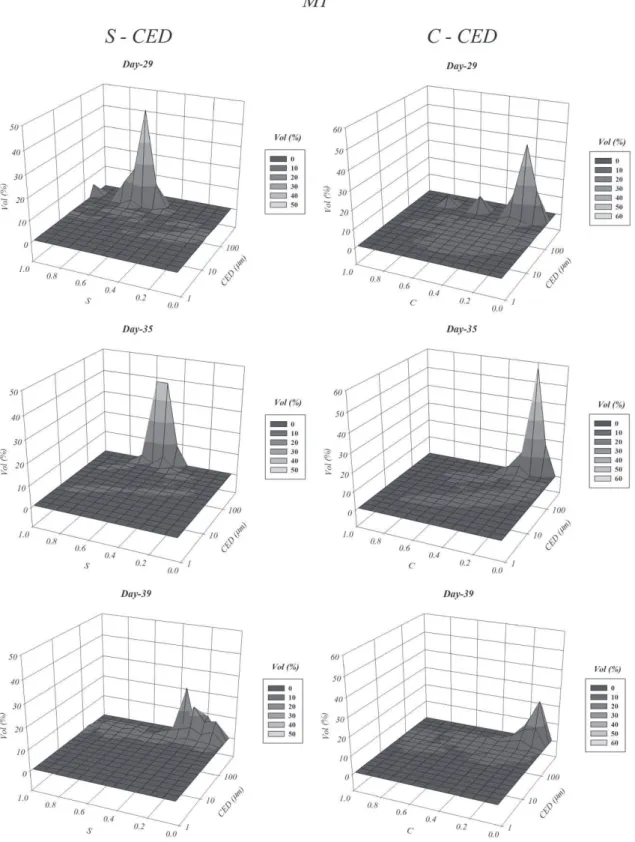
Analysis of the 3D distributions in M1 and M2
As seen in the previous section, the modifications of operating conditions brought several variations regarding both the size and shape of the AS flocs. The previous analysis was con-ducted for the floc size on the one hand and for the shape properties on the other. However, to reach a deeper under-standing of the changes caused by the modifications, it is indispensable to combine the morphological parameters. In order to combine the floc size with the shape characteristics, 3D distributions were plotted.
This approach is illustrated for the solidity-CED and circularity-CED pairs on some specific days of M1 (days 29, 35 and 39) and M2 (days 44, 49 and 53), which could reasonably represent the beginning, the middle and the end of both modifications. Circularity and
solidity were selected to be represented alongside the CED because of their responses during OLR modifications. In the 3D distributions, the Z-axis and
the color gradient (from a cold color to a warmer one) shows layers representing percentages of the volume.
Analyzing, firstly, M1 (Figure 3) from day 29 to day 35, it is possible to observe that:
•
the S-CED distribution peak becomes wider and a por-tion of small particles with high solidity values (CED < 50 μm and S > 0.4) appears;•
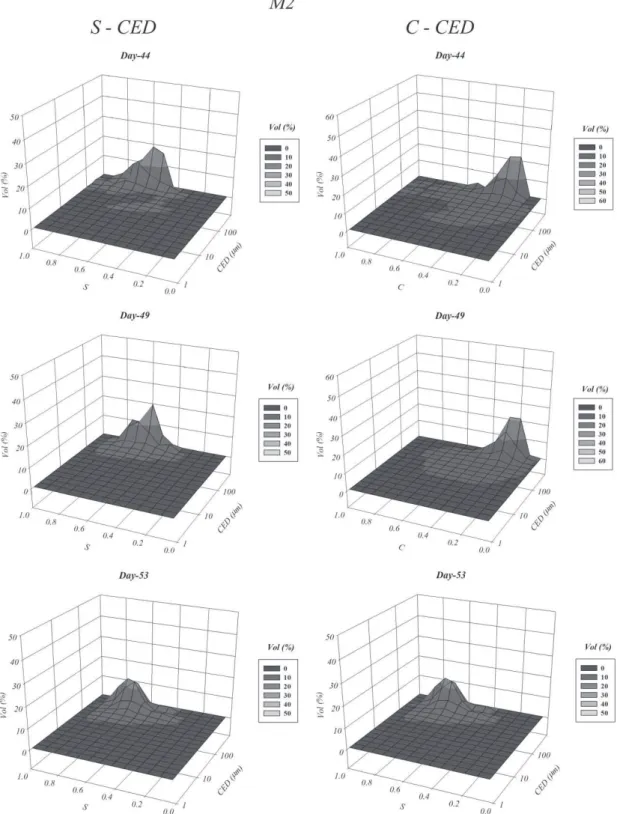
the C-CED distribution reveals that some large and quite circular flocs (CED > 100 μm and C > 0.6) disappear at the same time.This means that, after almost 1 week of the modification, flocs increased in size and deviated from a regular shape. From day 35 to day 39, S-CED and C-CED distributions shifted to lower values of solidity and circularity, respectively, this modification being more pronounced in the case of S-CED than C-CED. The S modes decreased from 0.6 to 0.3 whereas C modes decreased from 0.2 to 0.1. This implies an increase in the degree of concavities (or porosity) for an even less circular population of AS flocs, which were concentrated in a group of large aggregates. In summary, it can be supposed that the AS flocs increased in size, acquiring an irregular structure after OLR increase. This finding is in accordance with the micro-scopic observations indicating filamentous bulking for this period and with the results found byBarbusin´ski & Kos´ciel-niak (), which state that flocs with a great number of associated filaments tend to present large dimensions with a ‘loose’ structure and poor settling properties (SVI > 150 ml/g). Comparing the 3D distributions corresponding to day 39 and day 44 (Figure 4) during M2, the distribution correspond-ing to S-CED shows a sudden shift to the left, mainly indicatcorrespond-ing an increase in the floc solidities. Such an abrupt displacement makes it difficult to believe that this morphological change was related only to the switch of OLR. It is more reasonable to consider that solidity values increased again because many of the flocs plagued with filaments were washed out within this period. During M2, the 3D distributions also high-light the stability of the floc size while circularity and solidity parameters gradually evolve in opposite ways.
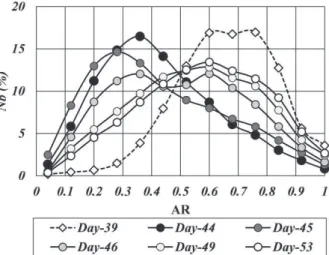
A gradual homogenization of the 3D distributions observed along M2 encouraged a more detailed analysis of the image data. This investigation brought to light the exist-ence of a population of small free filaments (CED: 7.39 μm) between day 45 and day 46. This means that flocs and fila-ments began to detach from each other at that time, which can likely explain the homogenization of the overall popu-lation. This fact became even more obvious when aspect ratio (AR) distributions for M2 were analyzed on a number basis (Figure 5), since this approach gave an idea of the elongation of the small aggregates.
An inversion of the distribution towards low aspect ratios (in terms of their modes from 0.7 to 0.3) is thus the clearest evidence that the population of small flocs became more elongated on day 45 due to the release of small filaments. Afterwards, those free filaments left the system, leading to a subsequent inversion towards higher aspect ratios on the AR distributions.
CONCLUSION
The performance of a laboratory-scale AS process was evalu-ated while sludge morphological properties were determined through quantitative IA. OLR increase meaningfully impacted process efficiency due to filamentous bacteria growth. In the case of this study, this was characterized by a pronounced increase in floc size concomitant with a significant decrease in solidity values and a less significant decrease in circularity numbers. These results mainly highlight solidity as a promising indicator of a filamentous bulking situation. These obser-vations must be verified in a full-scale WWTP. Furthermore, the implementation of the 3D distribution analyses for the pairs S-CED and C-CED proved to be a key tool for obtaining a deeper understanding of bulking and washout phenomena. Changes in recycle and COD:N ratios suggest that floc shape is more sensitive to modifications than floc size.
ACKNOWLEDGEMENTS
The authors would like to thank Science without Borders and the Fundação CAPES for financial support.
REFERENCES
Amanatidou, E., Samiotis, G., Trikoilidou, E., Pekridis, G. & Taousanidis, N. Evaluating sedimentation problems in activated sludge treatment plants operating at complete sludge retention time. Water Research 69, 20–29. Amanatidou, E., Samiotis, G., Trikoilidou, E., Tzelios, D. &
Michailidis, A. Influence of wastewater treatment plants’ operational conditions on activated sludge microbiological and morphological characteristics. Environmental Technology 37 (2), 265–278.
Amaral, A. L., Mesquita, D. P. & Ferreira, E. C. Automatic identification of activated sludge disturbances and assessment of operational parameters. Chemosphere 91 (5), 705–710. Barbusin´ski, K. & Kos´cielniak, H. Influence of substrate loading intensity on floc size in activated sludge process. Water Research 29 (7), 1703–1710.
Casellas, M., Dagot, C., Pons, M.-N., Guibaud, G., Tixier, N. & Baudu, M. Characterisation of the structural state of flocculent microorganisms in relation to the purificatory performances of sequencing batch reactors. Biochemical Engineering Journal 21 (2), 171–181.
Costa, J. C., Mesquita, D. P., Amaral, A. L., Alves, M. M. & Ferreira, E. C. Quantitative image analysis for the characterization of microbial aggregates in biological wastewater treatment: a review. Environmental Science and Pollution Research 20 (9), 5887–5912.
da Motta, M., Pons, M.-N., Roche, N. & Vivier, H.
Characterisation of activated sludge by automated image analysis. Biochemical Engineering Journal 9 (3), 165–173. Eaton, A. D. & Franson, M. A. H. Standard Methods for the
Examination of Water and Wastewater. American Public Health Association.
Fulazzaky, M. A., Abdullah, N. H., Mohd Yusoff, A. R. & Paul, E. Conditioning the alternating aerobic–anoxic process to enhance the removal of inorganic nitrogen pollution from a municipal wastewater in France. Journal of Cleaner Production 100, 195–201.
Grady Jr, C. P. L., Daigger, G. T., Love, N. G. & Filipe, C. D. M. Biological Wastewater Treatment, 3rd edn. CRC Press, Boca Raton, FL, USA.
Grijspeerdt, K. & Verstraete, W. Image analysis to estimate the settleability and concentration of activated sludge. Water Research 31 (5), 1126–1134.
Guo, J., Peng, Y., Wang, S., Yang, X., Wang, Z. & Zhu, A.
Stable limited filamentous bulking through keeping the competition between floc-formers and filaments in balance. Bioresource Technology 103 (1), 7–15.
Guo, J., Wang, S., Wang, Z. & Peng, Y. Effects of feeding pattern and dissolved oxygen concentration on microbial morphology and community structure: the competition between floc-forming bacteria and filamentous bacteria. Journal of Water Process Engineering 1, 108–114.
Jamal Khan, S., Ilyas, S., Javid, S., Visvanathan, C. & Jegatheesan, V. Performance of suspended and attached growth MBR
systems in treating high strength synthetic wastewater. Bioresource Technology 102 (9), 5331–5336.
Kim, J.-S., Lee, C.-H. & Chang, I.-S. Effect of pump shear on the performance of a crossflow membrane bioreactor. Water Research 35 (9), 2137–2144.
Koivuranta, E., Keskitalo, J., Haapala, A., Stoor, T., Sarén, M. & Niinimäki, J. Optical monitoring of activated sludge flocs in bulking and non-bulking conditions. Environmental Technology 34 (5), 679–686.
Liao, B. Q., Lin, H. J., Langevin, S. P., Gao, W. J. & Leppard, G. G. Effects of temperature and dissolved oxygen on sludge properties and their role in bioflocculation and settling. Water Research 45 (2), 509–520.
Liwarska-Bizukojc, E., Klepacz-Smółka, A. & Andrzejczak, O. Variations of morphology of activated sludge flocs studied at full-scale wastewater treatment plants. Environmental Technology 36 (9), 1123–1131. Mesquita, D. P., Amaral, A. L. & Ferreira, E. C.
Characterization of activated sludge abnormalities by image analysis and chemometric techniques. Analytica Chimica Acta 705 (1–2), 235–242.
Mesquita, D. P., Amaral, A. L. & Ferreira, E. C. Activated sludge characterization through microscopy: a review on quantitative image analysis and chemometric techniques. Analytica Chimica Acta 802, 14–28.
Mesquita, D. P., Amaral, A. L. & Ferreira, E. C. Estimation of effluent quality parameters from an activated sludge system using quantitative image analysis. Chemical Engineering Journal 285, 349–357.
Mohammadi, H., Sabzali, A., Gholami, M., Dehghanifard, E. & Mirzaei, R. Comparative study of SMBR and extended aeration activated sludge processes in the treatment of high-strength wastewaters. Desalination 287, 109–115.
Oliveira, P., Coufort-Saudejaud, C., Alliet, M. & Frances, C. Activated sludge systems for wastewater treatment: relation between floc morphological properties and solids retention time Revue des sciences de l’eau. Journal of Water Science 30 (1), 29–32.
Palm, J. C., Jenkins, D. & Parker, D. S. Relationship between organic loading, dissolved oxygen concentration and sludge settleability in the completely-mixed activated sludge process. Journal (Water Pollution Control Federation) 52 (10), 2484–2506.
Wilén, B.-M. & Balmér, P. The effect of dissolved
oxygen concentration on the structure, size and size distribution of activated sludge flocs. Water Research 33 (2), 391–400. Xu, W. & Gao, B. Effect of shear conditions on floc properties
and membrane fouling in coagulation/ultrafiltration hybrid process – The significance of Alb species. Journal of Membrane Science 415, 153–160.
Ye, F., Ye, Y. & Li, Y. Effect of C/N ratio on extracellular polymeric substances (EPS) and physicochemical properties of activated sludge flocs. Journal of Hazardous Materials 188 (1–3), 37–43.