HAL Id: tel-01813424
https://hal.archives-ouvertes.fr/tel-01813424
Submitted on 12 Jun 2018HAL is a multi-disciplinary open access archive for the deposit and dissemination of sci-entific research documents, whether they are pub-lished or not. The documents may come from teaching and research institutions in France or abroad, or from public or private research centers.
L’archive ouverte pluridisciplinaire HAL, est destinée au dépôt et à la diffusion de documents scientifiques de niveau recherche, publiés ou non, émanant des établissements d’enseignement et de recherche français ou étrangers, des laboratoires publics ou privés.
Skin Cancer segmentation and Detection Using Total
Variation and Multiresolution Analysis
Faouzi Adjed
To cite this version:
Faouzi Adjed. Skin Cancer segmentation and Detection Using Total Variation and Multiresolution Analysis. Signal and Image processing. Univeristé Paris-Saclay; Université d’Evry-Val-d’Essonne; UTP Petronas, 2017. English. �NNT : 2017SACLE042�. �tel-01813424�
Skin Cancer segmentation and
Detection Using Total Variation
and Multiresolution Analysis
Thèse de doctorat de Universiti Teknologi PETRONAS et l'Université Paris-Saclay préparée à l’universiti Teknologi PETRONAS et l’université d’Evry Val d’Essonne École doctorale n°580 Sciences et Technologies de l’Information et de la Communication (STIC)
Spécialité de doctorat: Traitement du signal et des Images
Thèse présentée et soutenue à Seri Iskandar, Perak, Malaisie, le 18 décembre 2017, par
Faouzi Adjed
Composition du Jury : Rachid Jennane
Professeur des universités, Université d’Orléans Président, Rapporteur
Nur Ashidi Bin Mat Isa
Full Professor, Universiti Sains Malaysia Rapporteur
Vincent Vigneron
Maître de conférences - HDR, Université d’Evry Val d’Essonne Examinateur
Mahmod Bin Othman
Associate Professor, Universiti Teknologi PETRONAS Examinateur
Fakhreddine Ababsa
Professeur des universités, Arts et Métiers ParisTech Directeur de thèse
Ibrahima Faye
Associate Professor, Universiti Teknologi PETRONAS Co-Directeur de thèse
Université Paris-Saclay
Espace Technologique / Immeuble Discovery
Titre : Segmentation et Détection du Cancer de la Peau en Utilisant la Variation Totale et l’Analyse Multi-résolution
Mots clés : Segmentation, Détection, Variation Totale, Analyse Multi-résolution, Imagerie médicale
Résumé : Les décès du cancer de la peau sont majoritairement des mélanomes malins. Il est considéré comme l’un des plus dangereux cancer. A ses débuts, les mélanomes malins sont traités avec des simples biopsies et sont complètement curable. Pour cela, une détection précoce est la meilleure solution pour réduire ses conséquences désastreuses. Imagerie médicale telle que la dermoscopie et les caméras à images standard sont les outils disponibles les plus adaptées pour diagnostiquer précocement les mélanomes. Le diagnostic assisté par ordinateur (CAD) est développé dans le but d’accompagner les radiologistes dans la détection et le diagnostic.
Cependant, il y a un besoin d’améliorer la précision de la segmentation et de détection des lésions. Dans ce travail, le modèle de Chan et Vese a été adapté pour segmenter davantage les variations à l’intérieur des lésions avec un résultat très encouragent. La deuxième tâche consiste à extraire des caractéristiques afin de discriminer les mélanomes. Deux méthodes ont été développée, une se basant sur l’irrégularité des bords des lésions et l’autre par la fusion des caractéristiques texturales et structurelles. Les résultats ont montrés de bonnes performances avec une précision de 86.54% et de 86.07%, respectivement.
Title : Skin Cancer Segmentation and Detection Using Total Variation and Mutiresolution Analysis
Keywords : Segmentation, Detection, Total Variation, Multiresolutional Analysis, medical imaging
Abstract : The vast majority of skin cancer deaths are due to malignant melanoma. It is considered as one of the most dangerous cancers. In its early stages, malignant melanoma is completely curable with a simple biopsy. Therefore, an early detection is the best solution to improve skin cancer prognostic. Medical imaging such as dermoscopy and standard camera images are the most suitable tools available to diagnose melanoma at early stages. To help radiologists in the diagnosis of melanoma cases, there is a strong need to develop computer aided diagnosis (CAD) systems. The accurate segmentation and classification of pigment skin lesions still remains a challenging task due to the various colors and structures developed randomly inside the lesions. The current work focused on two main tasks. In the first task, a new approach of the segmentation of skin lesions based on Chan and Vese model is developed. The model is adapted to segment the variations of the pigment inside the lesion and not only the main border. The subjective evaluation, applied on a database of standard camera images, obtained a very encouraging results
with 97.62% of true detection rate. In the second main task, two feature extraction methods were developed for the analysis of standard camera and dermoscopy images. The method developed for the standard camera skin cancer images is based on border irregularities, introducing two new concepts, which are valleys and crevasses as first and second level of the border irregularity. The method has been implemented on DermIs and DermQues, two databases of standard camera images, and achieved an accuracy of 86.54% with a sensitivity of 80% and a specificity of 95.45%. The second method consisted of a fusion of structural and textural features. The structural features were extracted from wavelet and curvelet coefficients, while the textural features were obtained from the local binary pattern operator. The method has been implemented on the PH2 database for dermoscopy images with 1000-random sampling cross validation. The obtained results achieved an accuracy, a sensitivity and a specificity of 86:07%, 78.93% and 93.25%. Compared to the existing methods, the proposed methods in this work show very good performances.
DEDICATION
ACKNOWLEDGEMENTS
Firstly, I would like to thank the two universities that were part of this joint supervision, Université d’Evry Val d’Essonne, Paris Saclay and Universiti Teknologi PETRONAS, for the opportunity they gave me to be part of their Ph.D program. They both collabo-rated and contributed to the succeed of this Ph.D study.
I would like to express my sincere gratitude to my supervisors, Associate Professor Ibrahima FAYE and Professor Fakhreddine ABABSA for their continuous support, their patience and constant motivation, but also for the hard questions which encouraged and guided me to widen my research from various perspectives. Without their high quality supervision this work would not have been accomplished. I would like to thank also my co-supervisor in UTP, Associate Professor Sarat CHANDRA DASS.
Besides my supervisors, I would like to give my high, respectful gratitude to Pro-fessor Rachid JENANE, ProPro-fessor Nur Ashidi BIN MAT ISA, Doctor Vincent VI-GNERON and Doctor Mohamed BIN OTHMAN for accepting to be part of the com-mittee members, and for their brilliant comments and suggestions.
I especially thank Virginie BRIANTAIS, medical expert, and Dalil ICHALAL, im-age processing expert, for evaluating my recent work, and providing good advice and perspectives.
A special gratitude to CISIR and IBISC Laboratory for their hospitality, a wonder-ful workspaces and facilities provided. My special gratitude to Sabine Segala, Marité QUINTIN, Professor Gilles DUC and Bahrul Ilmi. I am also grateful to all my col-legues at the CISIR Laboratory, for their wonderful company and support, especially
to Dr. Munsif, Dr. Jamal, Dr. Abu Elhassan, Amjad, Altahir, Nirbhay and Dr. Ved-pal for their support during this work. I also would like to thanks IBISC collegues for their wonderful company and support, especially to Aylen, Dr. Alia, Dr. Abdelkader, Mahmoud, Dr. Junior and Ludovic.
I would like to thank my friend Peter and his wife Keri for their help and support, my friends Emefa, Sheela, Djoudi, Mounir, Krimo and all my friends of ACKB association for their support and encouragement.
I would like to express my eternal appreciation towards my brother Hassan and my sister-in-law Nadège, my nieces Pauline and Lisa, my nephew Akli and his wife for their support and continuous help during this three years of instability between two countries.
I would like to thank all my brothers and sisters living in Kabylia (Algeria), Slimane, Hayet, Zahir, Ferdjallah, Nabil, Toufik, Karima and all my nephews and nieces.
Finally, and most important, I want to thank my parents, Hadi and Nouara, who have been there unconditionally and urged me to be better. This accomplishment would not have been possible without them.
TABLE OF CONTENTS LIST OF TABLES . . . IX LIST OF FIGURES . . . XI LIST OF ABBREVIATIONS . . . XV NOMENCLATURE . . . .XVII CHAPTER 1 Introduction . . . 1 1.1 Overview . . . 1
1.1.1 Causes of Skin Cancer . . . 2
1.1.2 Types of Skin Cancer . . . 2
1.2 Medical Diagnosis . . . 4
1.2.1 ABCD Rule . . . 4
1.2.2 7-point Checklist . . . 7
1.3 Computer Aided Diagnosis Systems . . . 9
1.4 Problem Statement . . . 10
1.5 Research Objectives . . . 11
1.6 Research Hypothesis . . . 12
1.7 Scope of Research Work . . . 12
1.8 Thesis Organization . . . 13
CHAPTER 2 Literature Review . . . 15
2.1 Overview . . . 15
2.2 Preprocessing: Image Enhancement . . . 17
2.3 Segmentation . . . 23
2.3.1 Total Variation Segmentation . . . 23
2.3.2 Multiresolution Analysis . . . 24
2.3.3 Thresholding Approaches . . . 25
2.3.4 Other Segmentation Methods . . . 26
2.5 Classification . . . 33
2.6 Summary . . . 35
CHAPTER 3 Mathematical Tools . . . 37
3.1 Overview . . . 37
3.2 Total Variation . . . 37
3.2.1 Mumford Shah Function . . . 38
3.2.2 Chan and Vese Model . . . 38
3.3 Multiresolution Analysis . . . 40
3.3.1 Fourier Transform . . . 41
3.3.2 Wavelet Transform . . . 42
3.3.3 Ridgelet Transform . . . 46
3.3.4 Curvelet Transform . . . 47
3.4 Local Binary Pattern . . . 49
3.5 Statistical Classification and Pattern Recognition . . . 51
3.5.1 Support Vector Machine . . . 52
3.5.2 Artificial Neural Network . . . 54
3.5.3 Validation of the Results . . . 56
3.5.4 Performance Metrics . . . 56
3.6 Summary . . . 58
CHAPTER 4 Methodology . . . 61
4.1 Overview . . . 61
4.2 Segmentation . . . 62
4.2.1 Chan and Vese Model . . . 62
4.2.2 Generalization of Chan and Vese model . . . 64
4.2.3 Proposed Extension of Chan and Vese model . . . 66
4.2.3.1 Detection of three regions . . . 67
4.2.3.2 Extension to detect four regions . . . 72
4.2.3.3 Extension for five regions . . . 74
4.2.3.4 comparison with Generalization of Chan and vese model 75 4.2.3.5 Implementation and illustration . . . 75
4.3.1 Overview . . . 77
4.3.2 Structural and textural features . . . 77
4.3.2.1 Structural features . . . 79
4.3.2.2 Textural features . . . 79
4.3.2.3 Implementation . . . 80
4.3.3 Border Irregularity Features . . . 80
4.3.3.1 Standard image orientation . . . 81
4.3.3.2 Border feature extraction . . . 82
4.4 Summary . . . 86
CHAPTER 5 Results and Discussion . . . 87
5.1 Overview . . . 87
5.2 Datasets . . . 87
5.2.1 Dermoscopic Images Database . . . 87
5.2.2 Significance of the database . . . 90
5.2.3 Standard Camera Images Database . . . 94
5.3 Segmentation of Images Results . . . 95
5.3.1 Implementation . . . 95
5.3.1.1 Segmentation by Inclusion . . . 96
5.3.1.2 Segmentation by Separation . . . 96
5.3.2 Obtained results . . . 98
5.4 Multi-resolution analysis results . . . 101
5.4.1 Technical details . . . 102
5.4.2 Hair removing . . . 106
5.4.3 Obtained Results . . . 107
5.4.3.1 Melanoma Vs Atypical Nevus . . . 108
5.4.3.2 Melanoma Vs Common Nevus . . . 109
5.4.3.3 Melanoma Vs Atypical and Common Nevus . . . 110
5.4.4 Analysis and comparison . . . 112
5.5 Results of Border features . . . 116
5.5.1 Implementation . . . 117
5.5.1.2 Border irregularities implementation . . . 118
5.5.2 Obtained Results . . . 119
5.5.2.1 Statistical analysis of the results . . . 119
5.5.2.2 SVM classification on border irregularity features . . 121
5.5.2.3 Standard image view contribution . . . 123
5.5.2.4 Comparison with existing methods . . . 124
CHAPTER 6 Conclusions and Recommendations . . . 127
6.1 Conclusion . . . 127
6.1.1 Part I: Segmentation method . . . 127
6.1.2 Part II: Feature extraction . . . 128
6.2 Future directions . . . 130
LIST OF TABLES
Table 1.1: ABCD rule with the interval values of pi and the weight factor
wi of each component [1]. . . 6
Table 1.2: The major and minor criteria of 7-point checklist and the differ-ent weights for each criterion [1]. . . 8 Table 2.1: Comparison of different used methods on hair-removal task . . . 21 Table 2.2: Comparison and summary of some different methods used for
segmentation . . . 27 Table 2.3: Comparison and summary of some different methods used for
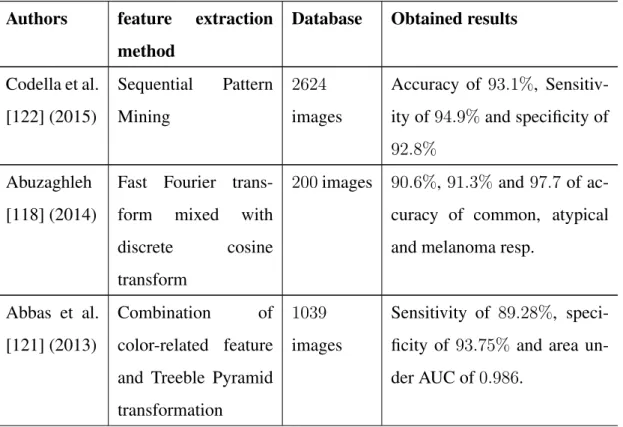
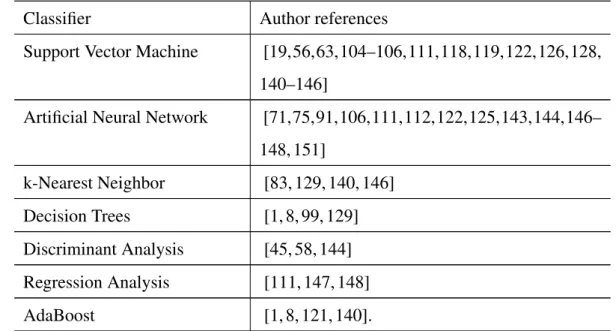
feature extraction and their obtained results . . . 31 Table 2.4: Summary of the most used classifiers in skin cancer recognition 35 Table 5.1: Summary of the characteristics of PH2database representing the
percentage of each sub-feature and between brackets the num-ber of images. . . 89 Table 5.2: Result of ABCD rule obtained from PH2database . . . . 92
Table 5.3: Subjective evaluation rules. . . 99 Table 5.4: Subjective Evaluation done by image processing expert on the
results obtained from the extension of Chan and Vese model by inclusion method . . . 100 Table 5.5: Subjective Evaluation done by image processing expert on the
results obtained from the extension of Chan and Vese model by inclusion method . . . 100 Table 5.6: Number of features of studied combinations . . . 107 Table 5.7: Results obtained for Melanoma Vs Atypical nevus giving
Per-formance validation VP and the standard deviation Std for 1000 random-cross validation under SVM classifier. . . 109
Table 5.8: Results obtained for Melanoma Vs Common nevus giving Per-formance Validation VP and the standard deviation Std for the 100− random-cross validation under SVM classifier. . . 110 Table 5.9: Results obtained for Melanoma Vs Atypical and Common
ne-vus giving Performance validation VP and the standard devia-tion Std for the 100− random-cross validadevia-tion under SVM clas-sifier. . . 111 Table 5.10: Comparison of the results of proposed approach with the results
of recent methods in the literature using the same database . . . 113 Table 5.11: Comparison of the results of proposed approach with the results
of recent methods in the literature using the same database . . . 114 Table 5.12: Number of detected area in equidistant segments using first level
of irregularity (horizontalS vertical). Valley geometrical forms 120 Table 5.13: Number of detected area in equidistant segments using second
level of irregularity (horizontalT vertical). Crevasse geometri-cal forms . . . 121 Table 5.14: Result of SVM classifier using the extracted features following
the different values of the threshold τv. . . 122
Table 5.15: Comparison of the obtained result with the existing method us-ing the same database. . . 124
LIST OF FIGURES
Figure 1.1: Different kinds of skin cancer classified by the Skin Cancer
Foundation [2] . . . 2
Figure 1.2: Asymmetry of melanoma compared with benign lesion [2]. . . 4
Figure 1.3: Border irregularity between malignant and benign lesions [2]. . 5
Figure 1.4: Color variation between melanoma and benign lesion [2]. . . . 5
Figure 1.5: Diameter in melanoma and benign lesion [2]. . . 5
Figure 1.6: Evolving of melanoma over time [2]. . . 5
Figure 1.7: 7-point checklist illustration [1]. . . 8
Figure 3.1: Wavelet representation scale j=0 . . . 45
Figure 3.2: Wavelet representation scale j=0 and j=1 . . . 45
Figure 3.3: A comparison between wavelet (a) and curvelet (b) [3] . . . 49
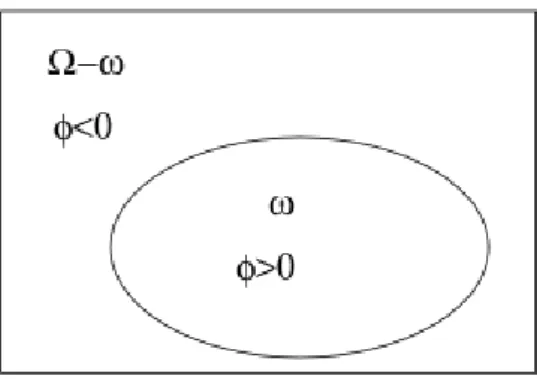
Figure 4.1: The zero level set function. The boundary C is illustrated by the ellipse which is equivalent toφ(x, y) = 0 and it separates the domainΩ into 2 regions φ(x, y) > 0 and φ(x, y) < 0. . . . 64
Figure 4.2: C is represented by the 2 curves {φ1 = 0} ∪ {φ2 = 0} which gives 4 distinct regions illustrated in this figure, 3 in the fore-ground and the backfore-ground. . . 65
Figure 4.3: C is represented by the 3 curves {φ1 = 0} ∪ {φ2 = 0} ∪ {φ3 = 0} dived it to 8 regions with the background. . . 65
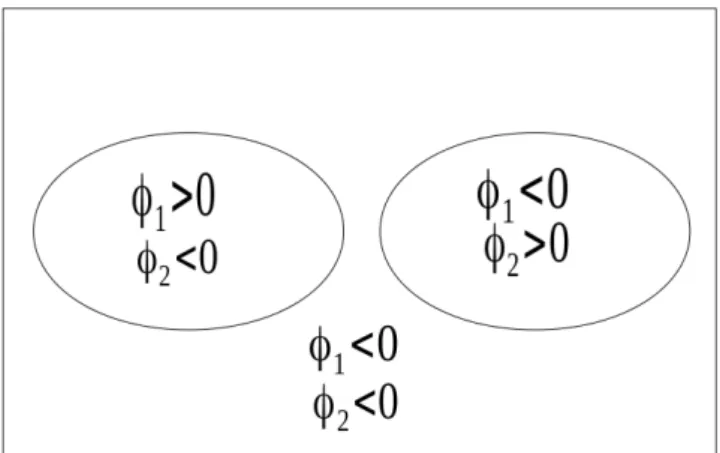
Figure 4.4: C is represented by the 2 curves without intersection between φ1 andφ2. It illustrates one possible case ofN = 3. . . 67
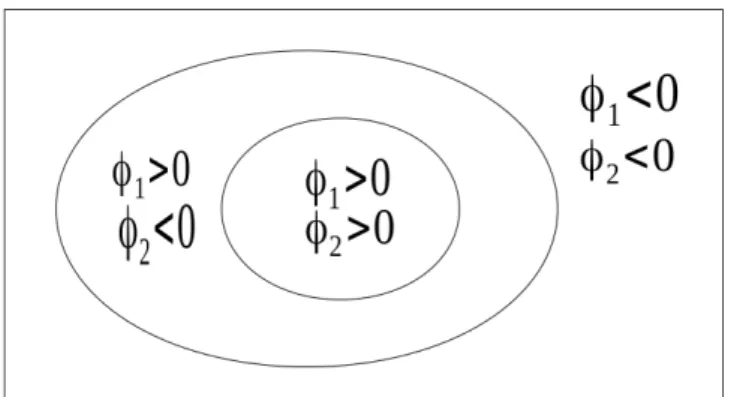
Figure 4.5: C is represented by the overlapping curves. It is illustrated by φ2 ⊂ φ1which is symetric toφ1 ⊂ φ2. . . 68
Figure 4.7: Four regions using three level set functionsφ1,φ2andφ3 using
the total separation method . . . 73 Figure 4.8: Four regions using two level set functionsφ1, φ2 andφ3 using
separation-inclusion . . . 73 Figure 4.9: Four regions using two level set functionsφ1, φ2 andφ3 using
inclusion-separation. . . 74 Figure 4.10: Four regions using two level set functions φ1, φ2 andφ3 using
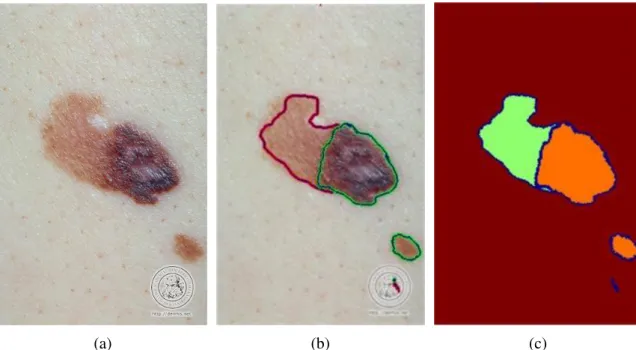
total inclusion. . . 74 Figure 4.11: Comparison with existing generalization of Chan and Vese model 75 Figure 4.12: Implementation of the approach using equation (4.13). (a):
Original RGB image. (b): Segmentation of the two regions under separability model (equation (4.13)). (c): Global region-based segmentation. . . 76 Figure 4.13: Implementation of the approach using equation (4.14). (a):
Original RGB image. (b): Segmentation of the two regions under inclusion model (equation (4.14)). (c): Global region-based segmentation. . . 76 Figure 4.14: Flowchart of structural and textural features fusion proposed in
this work. . . 78 Figure 4.15: Illustration of the normalization of the images using standard
view orientation approach. (a): Original RGB image. (b): The ROI of the lesion. (c): The isolation of the ROI. (d): Reori-entation of the ROI to horizontal view. The image is provided from DermIs website (www.dermis.net) under the name of SSM26a. . . 82 Figure 4.16: Four direction to detect the regular border. Horizontal
direc-tion: left to right and right to left. Vertical direcdirec-tion: up to down and down to up. . . 83 Figure 4.17: Illustration of the valley and the crevasse cases: Valley: using
only one direction (horizontal or vertical) and Crevasse: Using two directions (horizontal and vertical) . . . 84
Figure 4.18: p-norms illustration . . . 85
Figure 5.1: ANOVA test results . . . 92 Figure 5.2: Variability of the three classes of the PH2database. (1):
Com-mon nevus. (2): Atypical nevus. (3): Melanoma. . . 93 Figure 5.3: Results of ABCD rule system applied on PH2 database. . . 93 Figure 5.4: Illustration of the same image acquired with different distance.
(a): LMM8_orig image (kept). (b): LMM8_2_orig image (re-moved) [4]. . . 94 Figure 5.5: Implementation of the approach using equation (4.14) on
im-ages from DermIs database. (a): Original RGB image SSM18. (b): Segmentation of the two regions with ν = 0.2 and dt = 0.5. (c): Global region-based segmentation. (d): Original RGB image SSM9. (e): Segmentation of the two regions with ν = 0.28 and dt = 1.5. (f): Global region-based segmentation. (g): Original RGB image SSM11. (h): Segmentation of the two regions with ν = 0.07 and dt = 1.5. (i): Global region-based segmentation. (j): Original RGB image SSM11. (k): Segmentation of the two regions with ν = 0.15 and dt = 0.3. (l): Global region-based segmentation. . . 97 Figure 5.6: Implementation of the approach using equation (4.13). (a):
Original RGB image (SSM34). (b): Segmentation of the two regions. (c): Global region-based segmentation.(d): Original RGB image (SSM18). (e): Segmentation of the two regions. (f): Global region-based segmentation . . . 98 Figure 5.7: Subjective evaluation examples. (a): Excellent Segmentation.
(b):Good Segmentation. (c): Average segmentation.(d): Unac-ceptable segmentation. . . 99 Figure 5.8: Training and test sets selection . . . 102
Figure 5.9: Illustration of the modified accuracy effect’s on the obtained result using the formula given by equation (5.4). (a): Modi-fied accuracy ( ˆacc) in function of α, presented by blue calor. (b):Accuracy (acc) depending on the number of malignant and benign lesions, presented by the dark color. . . 105 Figure 5.10: Hair removing with DullRazor software. (a,c): original
im-ages. (b,d): Dullrazor software treatment on the original imim-ages. 106 Figure 5.11: histogram of the thousand combinations results for accuracy
metric . . . 115 Figure 5.12: Single orientation of melanoma sample from DermQuest Database
[5]. (a): original malignant image NM61. (b): gray level ROI of the oriented ROI of NM61 image. (c) Binary ROI of the ori-ented ROI of the image NNM61. (d): Original Malignant im-age (SSM74). (e):gray level ROI of the oriented ROI of SSM74 image. (f) Binary ROI of the oriented ROI of the image SSM74. 117 Figure 5.13: Single orientation of benign lesions sample from DermQuest
Database [5]. (a): original benign image D45. (b): gray level ROI of the oriented ROI of D45 image. (c) Binary ROI of the oriented ROI of the image D45. (d): Original benign image D54. (e):gray level ROI of the oriented ROI of D54 image. (f) Binary ROI of the oriented ROI of the image D54. . . 118 Figure 5.14: Illustration of main stages of border irregularities. (a): Original
gray level image. (b): Binary ROI image. (c): valleys areas detected with the edge of the ROI. (d): Valley areas detected (13 elements). (e): Crevasse areas detected with the edge of the ROI. (f): Crevasse areas detected (3 elements). . . 119 Figure 5.15: Accuracy of standard view and original images using border
features presented in the current method. blue (up) : proposed standard view images, red (down): Original images. . . 123
LIST OF ABBREVIATIONS
ABCD Asymmetry, Border, Color, Diameter Acc Accuracy metric
AN N Artificial Neural Network AN OV A Analysis Of Variance AU C Area Under Curve
CAD Computer Aided Diagnosis
CIE International Commission on Illumination CN N Convolutional Neural Network
DCT Discrete Cosine Transform DF T Discrete Fourier Transform DW T Discrete Wavelet Transform EM Expectation Minimization Ep Error probability
F CM Fuzzy C-Mean
F DCT Fast Digital Curvelet Transform F F T Fast Fourier Transform
F N False Negative F P False Positive F P R False Positive Rate
GP AC Graph Partitioning Active Contours GV F Gradient Vector Flow
ISIC International Skin Imaging Collaboration J RC Joint Reverse Classification
kN N k-Nearest Neighbor LBP Local Binary Pattern
M LR Multi-scale Lesion-biased Representation N P R Negative Predictive value
P DE Partial Differential Equation P H2 PH2Database
P P R Positive Predictive value RGB Red Green Blue channel
ROC Receiver Operating Characteristic ROI Region Of Interest
SCF Skin Cancer Foundation
SIF T Scale Invariant Feature Transform Sen Sensitivity metric
Spe Specificity metric
SP AM Sequential Pattern Mining
SP T Steerable Pyramids Transformation SSA Stacked Sparse Auto-Encoder Std Standard deviation
SV M Support Vector Machine
T DLS Texture Distinctiveness Lesion Segmentation T D Texture Distinctiveness
T DR True Detection Rate T N True Negative T P True Positive T V Total Variation
V P Validation Performance V s Versus
NOMENCLATURE
C Set of complex numbers div Divergence α alpha ∂ differential partial δ delta ∆ Delta ε epsilon Γ Gamma χ khi ⊂ inclusion inf infinite λ lambda µ mu
N Set of positive integer numbers
∇ nabla ν nu ω omega Ω Omega π pi Π Product (PI) φ phi Φ Phi ϕ varphi ψ psi
R Set of real numbers
R2 Set of two dimensional real numbers
∪ union
ξ xi
CHAPTER 1 INTRODUCTION
1.1 Overview
Melanoma is the most dangerous abnormal skin tissue. Its treatment requires chemother-apy and radiotherchemother-apy and it becomes more difficult to treat when it is in advanced stages such as metastasis step [6], where one person die each 54 minutes [2]. The statistics show that approximately 132, 000 melanoma cases and 2 to 3 millions of non-melanoma cases [6,7] are reported annually in the world. In total, it accumulates to 1.6% of cancer cases worldwide [8]. Despite the rarity of this diseases, the vast majority of persons affected by malignant skin cancer deaths within two years [2]. As ozone levels are de-pleted, the World Health Organization (WHO) [6] estimates that 10% of decrease in ozone level will result in an additional of 300, 000 non melanoma and 4500 melanoma cases. According to WHO and Lee et al. [9], Caucasian populations generally have a much higher risk of getting skin cancer disease than dark-skinned populations. Natu-rally, brown and black people can usually safely tolerate relatively high levels of sun exposure without getting sunburns or greatly increasing their skin cancer risk. In con-trast, people with pale or freckled skin, fair or red hair and blue eyes belong to the highest risk group. Followed by people with dark hair and eyes who do not normally get sunburns are at medium risk of skin cancer developing [6]. According to the World Health Organization, the following items present a set of risk factors of skin cancer: fair skin; blue, green or hazel eyes; light-coloured hair; tendency to burn rather than suntan; history of severe sunburns; many moles and/or freckles; a family history of skin cancer. In the United States and worldwide, skin cancer incidence is reported as one of the most
increasing tumor. The risk of developing invasive melanoma was estimated to 1 in 39 of Caucasian men and 1 in 58 for Caucasian women in American society in 2010 [10].
1.1.1 Causes of Skin Cancer
Cancer starts when cells in the body begin to grow out of control. Cells in nearly any part of the body can become cancer, and can then spread to other areas of the body [11]. Similarly, skin cancer is the uncontrolled growth of abnormal skin cells. It occurs when unrepaired DNA damage to skin cells, most often caused by ultraviolet radiation from sunshine or tanning beds, triggers mutations, or genetic defects, that lead the skin cells to multiply rapidly and form malignant tumors [2].
1.1.2 Types of Skin Cancer
The multitude of benign and malignant melanoma complicates the recognition of skin lesion cases. In the clinical practice, three main types of abnormal skin cells are noticed i.e. Basic cell carcinoma, Squamous cell carcinoma and Melanoma [11, 12]. The Skin Cancer Foundation (SCF) [2], further into these, characterizes three more kinds of ab-normal cells, i.e., Actinic keratosis, Merkel cell carcinoma and Atypical moles, which are less common. Figure 1.1 illustrates the six types of skin lesions. It notices also that the atypical moles are the second most dangerous cells after melanoma cases.
According to Skin Cancer Foundation [2], the difference between these abnormality tissues are:
• Actinic Keratosis, also known as a solar keratosis, is a crusty and scaly growth. It is considered as pre-cancer because if left alone, it could develop into a skin cancer.
• Merkel cell carcinoma is a rare and aggressive skin cancer that is at high risk of recurring and spreading (metastasizing) throughout the body. But, it is 40 times rarer than melanoma.
• Basic cell carcinoma is the most occurring form of skin cancer. It often looks like open sores, red patches, pink growths, shiny bumps or scares. This skin cancer very rarely spreads.
• Squamous cell carcinoma is the second most common form of skin cancer. It often looks like scaly red patches, open sores, elevated growths with a central depression, or warts.
• Atypical moles are unusual-looking benign moles, also known as dysplastic nevi. They may resemble melanoma, and people who have them are at increased risk of developing melanoma in a mole or elsewhere on the body. They have 10 times or more the risk of developing melanoma.
• Melanoma is the most dangerous form of skin cancer, these cancerous growths develop when unrepaired DNA damage to skin cells, mostly caused by ultraviolet radiation from sunshine or tanning beds, triggers mutations (genetic defects) that lead the skin cells to multiply rapidly and form malignant tumors. The majority of melanomas are black or brown, but they can also be skin-colored, pink, red, purple, blue or white. If melanoma is recognized and treated early, it is almost always curable, but if it is not, the cancer can advance and spread to other parts of the body, where it becomes hard to treat and can be fatal.
from exposure to ultraviolet radiations [2, 6, 7, 11].
1.2 Medical Diagnosis
To recognize melanoma cases, dermatologists compare and analyze a multiple signs of each tumor. Mostly, they use two scoring systems based on visual characteristics to recognize the melanoma tissue, which are ABCDE rule [2, 12–15] and Glascow 7-point checklist / 7-point checklist [12, 16–18].
These two scoring systems are well known by medical experts and they constitute the basic methods of comparison for image processing experts. Most of the developed and explored methods are based on these systems, such as Bareiro et al. [19] and She et al. [20] for ABCD rule, and Argenziano et al. [21] for 7-point checklist. The features used in these systems are also explored separately in the goal of melanoma recognition, for example, pigment network [8, 22] and vascular structure [23]. These systems are summarized in the current chapter and detailed in the literature review chapter.
1.2.1 ABCD Rule
The skin cancer foundation explained the ABCD rule, called also ABCDE rule when the evolving feature is available. The meaning used for each case is explained and illustrated below:
• Asymmetry (A): The pigment is considered asymmetric if by drawing one vertical or horizontal line, the two parts of the mole will not be similar.
• Border (B): More the pigment border is not smooth, more it can be considered as malignant case.
Figure 1.3: Border irregularity between malignant and benign lesions [2].
• Color (C): Most benign pigments have one color (often brown color). Melanoma has a variety of colors (black, red, blue and/or wight).
Figure 1.4: Color variation between melanoma and benign lesion [2].
• Diameter (D): Benign pigments have usually smaller diameter than malignant ones. Melanoma is often greater than 6 mm, but it can be smaller.
Figure 1.5: Diameter in melanoma and benign lesion [2].
• Evolving (E): Over time, benign pigment looks the same. However, malignant melanoma evolves or changes in size, shape, color and/or elevation.
Table 1.1: ABCD rule with the interval values of pi and the weight factor wi of each
component [1].
Feature Description Points pi
Weight factor wi
sub-score range Asymmetry One value of 0.5 for each axis. 0 − 2 1.3 0 − 2.6 Border Eight segment, one value of 1 for
each abrupt pigment cutoff. 0 − 8 0.1 0 − 0.8 Color
One value of 1 for each color: white, red, light brown, dark brown, blue-gray.
1 − 6 0.5 0.5 − 3
Dermoscopic structures
One value for each structure: pig-ment network, structureless area, dots, globules, branched streaks.
1 − 5 0.5 0.5 − 2.5
Figures from 1.2 to 1.6 illustrate the five rules of ABCD/ABCDE rules showing the difference between malignant and benign lesion. The real computation of ABCD system is done only for the first four components using the following formula:
Sabcd = 4
X
i=1
wipi (1.1)
where wiand piare the weight and the value attributed to each point. They are
summa-rized in table 1.1 as explained by Capdehourat et al. [1], according to Stolz et al. [14]. Knowing that the evolution of the lesion over time is the most missed data, then the feature given by the item E is used only for visual comparison by dermatologists when it is available.
The evaluation of ABCD rule is performed following equation (1.1) using the scores given in the table 1.1 to classify the pigment into three cases, benign, clinically doubtful and malignant [1]:
Sabcd < 4.75 then the pigment is benign
4.75 ≤ Sabcd ≤ 5.45 then the pigment is clinically doubful
Table 1.1 expresses the description of each feature of the system and gives their different point values and weight factors.
1.2.2 7-point Checklist
The 7-point checklist [17] and Glascow 7-point checklist system [18], summarized by Capdehourat et al. [1] (see Figure 1.7) and Korotkov et al. [12], is another scoring system based on seven criteria divided into two sets. For Glascow 7-point checklist, the major criteria are changes in shape, size and color, and the minor criteria are diameter, inflammation, crusting and sensory changes. The 7-point checklist criteria works in the same way, with some differences and more details, as presented below:
• Atypical pigment network: Black, brown, or gray thickened and irregular lines segments in the lesion.
• Blue-whitish veil: Irregular, confluent, gray-blue to whitish-blue diffuse pigmen-tation that can be associated with pigment network alteration, dots/globules, or streaks.
• Atypical vascular pattern: Linear-irregular and/or dotted red vessels not seen in regression area.
• Irregular streaks: Pseudo pods or radial streaming irregularities arranged at the periphery of lesion.
• Irregular pigmentation: Black, brown or gray featureless areas with irregular shape and/or distribution.
• Irregular dots/Globules: Black brown, or gray rounded to oval, and variously sized irregularity structures distributed in the lesion.
• Regression structures: White scar-like areas and/or blue pepper-like areas (gray-blue areas and/or multiple (gray-blue-gray dots).
Table 1.2: The major and minor criteria of 7-point checklist and the different weights for each criterion [1].
Major criteria Score Minor criteria Score Atypical pigment network 2 Irregular streaks 1 Blue-whitish veil 2 Irregular pigmentation 1 Atypical vascular pattern 2 Irregular dots/globules 1 Regression structures 1
Figure 1.7: 7-point checklist illustration [1].
For 7-point checklist, the scores given to each point, the same for Glascow 7-point checklist, are 2 for major criteria and 1 for minor ones as summarized in table 1.2. The evaluation of the score follows the following formula:
s7pc = 3 X i=1 Mi+ 4 X j=1 mj (1.2)
where Mi and mj define the ithmajor and jth minor criteria respectively.
The classification following this system is also based on thresholding functions into two different classes [1]:
S7pc < 3 the pigment is benign
S7pc ≥ 3 the pigment is malignant
1.3 Computer Aided Diagnosis Systems
Computer Aided Diagnosis (CAD) systems have been developed in several contribu-tions of medical imaging [24–26]. The objective of CAD systems is to provide a computer output as a second opinion in order to assist radiologists on interpretation to improve the accuracy of diagnosis and reduce the image reading time [27]. A CAD system is generally identifying two types of systems depending upon its main func-tion i.e. Computer Aided Detecfunc-tion (CADe) system and Computer Aided Diagnosis (CADx) system. It is also explored for the early both detection and diagnosis [28]. A CAD system is applied on different tumor images such as mammograms, dermoscopy, MRI, radiography, etc. A CAD system was already known in the 1960s and became more interesting topic in the 1980s, where many investigations and researches were ex-plored in some laboratories and hospitals [12]. Since 2000s, the number of papers in CAD system are mostly increased in the achievement of the detection and the diagnosis of melanoma [24, 27].
The CAD system applied in medical imaging contains five main steps from the image acquisition to the classification and diagnosis:
1. Image acquisition: In image processing, this step is considered as source or data for the next steps. In addition to that, there are many important and consistent informations from the acquisition to help the image processing experts to have a baseline and an intuitive work direction to explore.
2. Image enhancement: The objective of this step is to reduce noises and all arti-facts in the images. These artiarti-facts in most cases depend on the kind of image acquisition technique employed, and represent, for example, numbering in mam-mogram images, hair and blood vessels in dermocopic images.
3. Segmentation: The segmentation of the Region Of Interest (ROI) is an important step in CAD system. The multitude of skin cancer images makes the segmenta-tion task more difficult. It becomes one of the hardest and most challenging task in CAD system.
4. Feature extraction: Once the ROI is isolated, the objective of this step is to provide the best descriptor to extract features which discriminate the database into two or more classes.
5. Classification and detection: The final step is classification and diagnosis where the proposed system is observed and analyzed. Depending on the feature ex-tracted and the number of classes desired, the choice of the classifier is primordial to get better results on the detection. According to the classifier used, the classi-fication rate is evaluated following some performance metrics, such as accuracy, sensitivity, specificity and receiver operating characteristic (ROC).
CAD system is developed in melanoma recognition as well. Following the five steps of the system, there are many methods adopted or developed specifically for melanoma detection. The next chapter summarizes the literature review on skin cancer detection according to these steps, it makes also in evidence the logic of these steps on CAD system and the different contributions in each step.
1.4 Problem Statement
Melanoma treatment needs chemotherapy and radiotherapy, as breast cancer, blood cancer, brain tumor, lung cancer, and other cancer types when they reach metastasis state [2, 29]. To avoid these painful procedures and receive successful treatment, early detection is one of the most reliable solutions.
The CAD systems explored for improving the accurate decision is still in develop-ment. Nowadays, as reported by Korotkov et al. [28], many CAD systems are available for pigment skin lesions detection such as Dell’Eva-Burroni Melanoma Image process-ing Software which is the most cited in the literature and gives lower performances in real applications. However, it is difficult to draw overall conclusions regarding the per-formance of these systems. The different image acquisition (dermoscopic, clinical and standard camera images) in structured studies complicates furthermore the classifica-tion task in one global methodology. Thus, the current CAD systems are still far from
perfection and need more developments to improve the detection and the diagnosis of melanoma. Despite, the improvements of CAD systems over years, there are still some challenges involved, such as accurate and adaptive segmentation. Moreover, to clas-sify the skin pigment lesions into malignant and benign cancer, two major problems are evoked.
• Firstly, the accurate segmentation is the first challenging task to improve in the first plan the detection of suspicious lesions, and in the second plan the classifi-cation of these lesions into malignant and benign.
• Secondly, the extraction of the most discriminative set of features describing the relevant characteristics separating the pigment lesions into benign and malignant skin cancer.
In addition to that, the key to improve the real output quality of CAD systems is to apply the proposed methods on free public datasets for the comparison of all de-veloped algorithms. To reduce also the human error of diagnosis, each pigment skin lesion should be accompanied by the ground truth and diagnosis reported from several dermatologists [12].
1.5 Research Objectives
The main objective of this thesis is to improve melanoma detection and recognition. To accomplish this objective, the PhD work was oriented into the following specific directions:
• To investigate a method of segmentation adapted for skin lesions characteristics, that could segment even the small regions inside the skin pigment lesion.
• To develop a method of features extraction based on fusion of structural and tex-tural features.
1.6 Research Hypothesis
To achieve our research objectives, the following research hypothesis are made:
• A total variation method exploring an extension of Chan and Vese model would be efficient for segmentation of regions of interest in skin lesion images.
• A fusion of structural and textural features exploring the Local Binary Pattern op-erator and multiresolution analysis methods (curvelet and wavelet transform) on dermoscopic image database would be efficient to discriminate further between malignant and benign lesion.
• An investigation of geometrical characteristics based on the border irregularities may provide a description of pigment skin lesions.
1.7 Scope of Research Work
The scope of the work is to aid and improve the Computer Aided Diagnosis based on image processing methods. The work is concentrated on two main directions, segmen-tation and features extraction. The first direction is based on Chan and Vese model. The model was extended and adapted for skin cancer segmentation. In addition to the whole region of interest, the algorithm segments the inter-regions of the lesions. The second part of the work consists of extracting the most discriminant features, either for dermoscopic and standard camera images. For dermoscopic images, multiresolution analysis using wavelet and curvelet were combined with local binary pattern and used for feature extraction to discriminate skin lesions. For standard camera images, bor-der smoothness and irregularities are explored and developed, introducing valleys and crevasses concepts as features to make border between malignant melanoma and benign skin lesion (non-melanoma) images. All results of developed methods and comparisons are highlighted and discussed.
1.8 Thesis Organization
The work of this thesis is organized into the following six chapters:
Chapter 1 describes the skin cancer, computer-aided diagnosis tasks, objectives and contributions of the current work.
Chapter 2 presents a literature review of CAD systems and different methods de-veloped for skin cancer enhancement, segmentation, feature extraction and finally the detection and recognition step.
Chapter 3 contains mathematical tools used in the current work. It is divided into three sections which are Total Variation, Multiresolution Analysis (Fourier transform, wavelet, ridgelet and curvelet) and finally the classifiers used (support vector machine and artificial neural network).
Chapter 4 introduces the methodology of the proposed system. It provides all the details of the techniques developed during this PhD work.
Chapter 5 reports the obtained results from the proposed methodology and its com-parison to existing methods and algorithms. It also illustrates different intermediate steps of the work.
Chapter 6 concludes the overall work of the thesis and gives recommendations for the future work. It enumerates the scientific papers published in workshops, conferences and journals.
CHAPTER 2 LITERATURE REVIEW
2.1 Overview
Skin cancer recognition on CAD systems has been an active research area for more than 30 years back [28]. For instance, many methods have been developed and explored for melanoma detection [30]. Korotkov and Garcia [12] presented an interesting overview of used and explored methods on clinical and dermoscopic images from 1984 to 2012. Their review is organized following ABCDE [31] criteria and other methods developed in clinical and computer-aided diagnosis system (CAD) from the data acquisition step to the classification and diagnosis. Maglogiannis and Doukas [16] have also presented in 2009 an overview on CAD system methods. A non exhaustive comparison of the most important implementations is reported, specifically features selection such as color and border, and wavelet coefficients. They also presented the classifiers often used in the literature, such as Artificial Neural Network and Support Vector Machine. Masood and Al-Jumaily [32] in 2013 presented a review of techniques and algorithms used in skin cancer, and also a comparison of performances of these methods on skin lesion recognition. Recently, in 2015, Celebi et al. [33] presented a state of the art survey on the 50 published border detection methods. The authors evaluated the subjective and objective evaluations and their impact on the quality of segmentation results of skin border lesions. The conclusions of these review papers are detailed below in the different steps of CAD system.
As mentioned in the Introduction chapter (Chapter 1), the two scoring systems, ABCD rule and 7-point checklist, well known by the clinicians and dermatologist in
clinical diagnosis and by non dermatologists in screening procedures are detailed in this chapter. In this topic, the scoring system related to ABCD rule was proposed by Friedman [13] in 1985 and developed by Stolz et al. [14] in 1994. This system is widely used in clinical practice [12]. Following each feature, the system is divided into points values and weight factors as detailed in Table 1.1 in the last chapter.
According to Capdehourat et al. [1], the scoring system for ABCD rule follows equation (1.1) (page: 6). Where pi represents the number of points attributed to each
feature and wi is the weight factor as explained in table 1.1.
The classification of the ABCD system scoring is based on two thresholds following the value of Sabcdgiven in equation (1.1). Therefore, if Sabcd < 4.75 the lesion is
clas-sified as benign, if 4.75 ≤ Sabcd ≤ 5.45 the lesion is considered as clinically doubtful
and if Sabcd > 5.45 then the lesion is classified as malignant. It can be seen from the
table 1.1 that border irregularity feature has less impact, with variation from 0 to 0.8, comparing to other features with variation from 0 to more than 2.5.
The 7-point checklist was proposed by Argenziano et al. [17], which is another variation of pattern analysis with fewer criteria for identification and analysis [1]. The idea of 7-point checklist system is to attribute the score of 2 for major and 1 for minor criteria as summarized in the table 1.2.
The classification is performed following a fixed threshold equal to 3 separating the pigment lesions on two classes. Thus, the pigment is classified as benign if the total value is lower than 3 (Total ≤ 3), on the other side it is classified as malignant if the total is greater than 3 (Total > 3) as explained in the previous chapter. Argenziano et al. [21] in 2011 and Walter et al. [34] in 2013 presented a new version of 7-point checklist to improve the accuracy of diagnosis.
Dolianitis et al. [35] compared 4 dermoscopic algorithms, ABCD rule, pattern anal-ysis, Menzies method and 7-point checklist. The study showed that the best results are obtained by Menzies method with an accuracy of 81.1%, followed by ABCD rule with an accuracy of 79%, 7-point checklist is in the third place with an accuracy of 77.2%
and in the last position, the pattern analysis algorithm. They reached the same conclu-sion that Carli et al. [36], where 7-point checklist is more sensitive than ABCD rule and pattern analysis. However, in their study (Dolianitis et al.), the Menzies method showed the highest sensitivity of 84.6%, followed by 7-point checklist with 81.4% and ABCD rule with 77.5%, and finally, pattern analysis had the lowest sensitivity of 68.4%. On the other hand, the highest value of specificity of 85.3% is reported by pattern analysis followed by ABCD rule with 80.4% and Menzies method with 77.7% and in the last position 7-point checklist with a specificity of 77.2%. This study was conducted by the ground truth of sixty-one medical experts, but only on 40 melanocytic skin lesions.
In the literature, most CAD system papers contribute in one or more than one area of image processing, which include image preprocessing, segmentation, feature extrac-tion and finally the classificaextrac-tion and diagnosis. The techniques developed in image preprocessing are presented in section 2.2 where the main objective is to enhance the image quality and remove noise. Then, it is followed by the segmentation techniques treated in section 2.3 for the detection of the Regions of Interest. Methods explored for feature extraction to discriminate the lesions are presented in section 2.4. Finally the classification and diagnosis treated in section 2.5 describes the most cited classifiers and methodologies used for melanoma recognition. The different obtained results are described continuously following the main area of contribution.
2.2 Preprocessing: Image Enhancement
The main objective of image enhancement is to improve the quality and readability of the images. In the literature, it is also known as the preprocessing image step. In skin cancer images, the goal of this step is specially to remove the artifacts, such as hair and human made artifacts. Image enhancement is also used to improve the contrast quality for the exploration and visibility of details. Therefore, to compensate the imperfection of image acquisition and eliminate different artifacts, many methods and algorithms are developed and explored on various skin lesion databases. The dermoscopic images artifacts can be obtained and observed as uneven illumination, dermoscopic gel, black
frames, ink markings, rulers and air bubbles. In fact, the border detection can also be affected by intrinsic cutaneous features such as blood vessels, hairs, and skin lines [16]. In the literature, according to Koroktov [28], artifacts are divided into two sets, artifacts rejection and image enhancement. Artifacts rejection contains hair, air bubbles, spec-ular reflections and ink marking. In the other part, image enhancement contains color correction and calibration, illumination correction, contrast enhancement and edge en-hancement. In 2009, Celebi et al. [37] focused on the importance of the current step in border detection, mentioning the most important used methods such as Gaussian and Median filters.
In dermoscopic images, the most common artifact, and necessary to remove, is the hair. Many methods and algorithms are presented in the literature to remove the hair when it is not shaved before the acquisition step. Therefore, the typical algorithm of hair removal methods is based on two main steps:
1. The hair detection: it consists on detecting and removing the different hairs in the image using algorithms of detection. Most developed methods in this step use segmentation because the hair is an integral component compared to other noise types.
2. The image restoration: the restoration or inpainting step consists on filling the space occupied by the removed hair with proper intensity and color values. The image quality can be affected when the density of hair is big in the lesion bor-der. Also, the texture of the pigment can be affected in some cases. Therefore, the shaving of the concerned area, when it is possible, is a good solution and compromise to reduce diagnosis errors.
Many methods are explored in the hair removal task. In the literature, DullRazor software [38], proposed in 1997, is the first widely adopted method for removal-of hair [12]. DullRazor performs the identification of the dark hair location using mor-phological closing operation, the verification of hair pixel shape and the replacement using bilinear interpolation, and the smoothness of replaced pixels with median filter. In 2008, Wighton et al. [39] proposed an alternative method for the inpainting step of
DullRazor software. In addition to the interpolation used in DullRazor software, the authors explored other information, like the direction of the border using Laplacian to regulate and measure the smoothness.
In 2011, Kiani et al. [40] proposed an improvement of DullRazor method using different approaches. The authors used Prewitt filter for edge detection and Radon transform for predominant direction of the hair, they also used different masks to iso-late the hair from other noises. Following the same idea, Toossi et al. [41] proposed a morphological operator using adaptive canny edge detector for hair detection and multi-resolution coherence transform inpainting technique to repair and replace smoothly the emplacements of removed hair. On a database of 50 images, the method achieves 88.3% of diagnostic accuracy and 9.9% of error segmentation. Nguyen et al. [42] used univer-sal matched filtering kernel and local entropy thresholding to get raw binary hair mask. Therefore, a combination of morphological thinning with Gaussian curve fitting is used for refining and verification of hair masks. Xie et al. [43] focused their research on re-pairing removed hair using PDE-based image inpainting. The method proposed by the authors contains three main parts, morphological closing is used for enhancement in the first step, followed by hair segmentation using statistical thresholding and extracted by the elongate of connected regions, and at the end they used PDE-based image in-painting for restoration. The authors applied their proposed method on 80 images (40 images without hair and 40 with hair). The obtained result showed 5% of errors for the case without hair and 18% for the images containing hair. Following the same idea Fierose et al. [44] proposed PDE-based image inpainting for restoration combined with top-hat operator (morphological enhancement) for segmentation and Otzu threshold for hair detection. Applying the current method on 20 images, the results showed an error of 15.6%. Huang et al. [45] explored multi-scale curvilinear matched filtering for hair detection and linear discriminant analysis for image restoration. Abbas et al. [46] pro-posed a matched filtering with first derivative-of-Gaussian method for hair detection. This approach showed accurate results, but the multitude of parameters complicates its implementation. Applied on 100 dermoscopic images, the method showed a diagnostic accuracy of 93.3%. The authors applied the same method in the next published pa-per [47, 48] when hair removal was needed. Barata et al. [49] used a bank of directional
filters and PDE-based interpolation for hair detection and inpainting, respectively. Gómez et al. [50] proposed an unsupervised algorithm based on Independent His-togram Pursuit. This algorithm estimates a set of linear combinations of images bands to enhance the different structures of the image. The results obtained showed an increment of border quality detection. Following the similar objective of contrast enhancement, Celebi et al. [51], proposed for a given RGB image input, they maximize the histogram bi-modality measure to increase the contrast between the lesion and the background. Madooei et al. [52] explored artifacts removal and image enhancement on 120 images based on the effect of light-intensity on the edges. The experience was implemented on border detection after enhancement with a sensitivity of 92% and a specificity of 88%.
Recently, in 2015, Koehoorn et al [53] proposed a new approach based on threshold-ing set decomposition and morphological analysis usthreshold-ing gap-detection by multi-scale skeletons. Mizaarlian et al. [54] proposed an alternative approach to detect hair in dermoscopic images using the measurement of turbulence quaternion [55] and dual matched filters for hair suppression. For the restoration, the authors used the interpola-tion used in DullRazor software developed in [38]. On a database of 40 dermoscopic image and 94 synthetic images, the results obtained for hair segmentation are 86% and 85% of accuracy for dermoscopic and synthetic images respectively. The results of enhancement gave 90% and 96% of sensitivity for dermoscopic and synthetic images respectively.
To remove other artifacts such as capillary and blood vessels, many methods are also developed and explored. Huang et al. [56] extracted capillaries from skin lesions, they used a compact set of 1 curvilinear and 2 color parameter features and trained us-ing SVM classifier to detect the different capillaries. Applyus-ing the proposed method on a database of 49 images with 21 visible capillaries and 28 non visible capillaries. The authors obtained 98.8% of accuracy, 90.5% of sensitivity and 89.3% of specificity. Ear-lier, Argenziano et al. [23] described the different vascular structures and its association with various melanocytic and nonmelanocytic tumors using statistical tests, such as χ2
and Fisher tests. On a database of 531, the dots vessels showed a positive prediction on melanocytic lesions of 90%.
Abbas et al. [47] also treated specular reflexion reduction using Fourier transform and median filter for air bubbles or dermoscopic-gel reduction. Barata et al. [49] used in their work a sub-band thresholding for the intensity to reduce the reflexion to enhance the quality of images in pigment network detection.
Table 2.1 summarizes some methods used for hair detection and inpainting steps with the results obtained for each one. Most of the presented methods in this table had compared their result to DullRazor software.
Table 2.1: Comparison of different used methods on hair-removal task Method Hair detection Restoration Database Results DullRazor [38]. (1997) Generalized mor-phological clos-ing operator Bilinear inter-polation
5 images Visual presentation of the segmenta-tion
Kiani et al. [40]. (2011)
Perwitt edge de-tector
Color averag-ing
5 images Visual presentation and comparison with DullRazor Toossi et al. [41]. (2013) Adaptive canny edge detector Multi-resolution coherence transform inpainting 50 images 88.3% of diagnos-tic accuracy and 9.9% of error seg-mentation Nguyen et al. [42]. (2010) Universal matched fil-tering kernel and Gaussian fitting Linear interpo-lation not avail-able visual illustration on synthetic and real images Xie et al. [43]. (2009) Top-hat operator + elongate func-tion for thresh-olding PDE-based im-age inpainting 80 images: 40 with hair, 40 without hair) 5% of false hair error and 18% of misclassified
Method Hair detection Restoration Database Results Fiorese et al. [44]. (2010) Top-hat operator + Otzu Threshold PDE-based im-age inpainting 20 images 15.6% of misclas-sified Huang et al. [45]. (2013) Multiscale matched filters Median filter-ing
20 images 81% of true hair detection Abbas et al. [48]. (2011) Derivative of Gaussian Coherence transport
100 images Diagnostci accu-racy of 93.3% Mizaarlian et al. [54]. (2014) Quaternion color curvature filter Bilinear inter-polation [38] 40 der-moscopic and 94 synthetic images ≈ 85% of accu-racy for hair detec-tion and over then 90% of sensitivity for both databases Koehoorn et al. [53]. (2015) Gap- detection by multi-scale skeletons Fast Marching method [57]
300 images Visual comparison with methods pre-sented in [38, 40, 43–45, 47].
In hair segmentation and removing, there have been many contributions and less for published papers analyzing on tubular structures and vessels. In the state-of-the-art research, the results obtained of most papers are based more on visual analysis and comparison. We notice that the majority of methods developed for skin image enhance-ment are based on thresholding. Despite the multitude approaches, it is very difficult to draw a clear conclusion due to the use of private databases and the application of these methods on small datasets.
2.3 Segmentation
The accurate detection of skin lesion border is the most important step and the crucial stage for classification and diagnosis. In image processing, many methods and algo-rithms were developed and applied in different databases. As mentioned in the previous chapter, the border detection is not so trivial and it has some shortcomings and prob-lems [28]. Two points are related, firstly, there are the ground truth problem done by dermatologists which is difficult to discriminate by algorithms and reproduce by the human observers, where the variation in contrast or blur [58] are not visible or well explored by naked eyes. Secondly, the issue between the manual and the automated segmentation is the morphological structure of the lesion as explained by Celebi et al. [37], specially the low contrast between the lesion and the normal skin and the fuzzy lesion borders in some cases.
The multitude of lesion development and its appearance in dermoscopic images complicates and influences the choice of the best method to detect lesion border [12,28, 37]. Therefore, the current subsection is organized following three major methods sets explored in image segmentation in generally, and skin lesion images particularly. In the first step, the methods developed using total variation segmentation are presented, then followed by multiresolution analysis and finally, those using thresholding approaches. Other various methods, that do not belong to these sets are also studied and explored. Recently, Celebi et al. [33] reviewed the border lesions detection and classified them into twelve categories, such as Histogram thresholding, clustering and active contours, etc.
2.3.1 Total Variation Segmentation
In the literature, as in general image processing, many methods are developed and/or implemented for skin lesion segmentation. Using total variation regularization, Ab-bas et al. [47] for the segmentation part, used a modified region-Ab-based active contours (RACs) developed by Lankton et al. in [59]. The current method explored the same
concept of Chan and Vese model [60], and its generalization [61] proposed for the reso-lution of Mumford-Shah function [62] (see chapter 3). On a database of 320 images, the results present over than 90% true detection rate (TDR) and less than 10% of false pos-itive rate (FPR). For the same objective, Safi et al. [63] applied another generalization of Chan and Vese Model developed by Li et al. [64] (see chapter 4). Using ABCD rule for feature extraction and SVM classifier on a database of 4240 benign and 232 malig-nant moles, the performance evaluation was conducted using a 10-fold cross-validation and it performed a true detection rate over than 98% for all 10 tested cases. Another extension of the model is presented recently by Kang et al. [65].
In 2009, Silviera et al. [66] compared 6 methods of segmentation, adaptive thresh-olding (AT), gradient vector flow, adaptive snake (AS), level set of Chan and Vese model (C-LS), expectation-minimization level set (EM-LS) and fuzzy-based split-and merge (FBSM) algorithm. The comparison shows that the best result of false positive rate (FPR) of 2.55% is given by C-LS method, but the results are lower for true detection rate (TDR) of 83.39% comparing to Adaptive snake with a TDR of 95.47%. In 2015, an extension of Chan and Vese model applied on dermoscopic images is developed [67], the proposed extension is detailed in Chapter 4.
2.3.2 Multiresolution Analysis
Multiresolution analysis is also used for segmentation of pigment skin lesions. There-fore, Castillejos et al. [68], in 2012, mixed wavelet transform [69] with Fuzzy K-Means Clustering algorithm, Fuzzy means algorithm and Cluster Preselection Fuzzy C-Means algorithm using all color channel for segmentation. On a database of 50 im-ages, the diagnostic performance was quantified by the AUC measure, the best result was performed using Daubechies wavelet with an AUC value over than 0.96 for the three combinations. In another way, Ma et al. [70, 71] used wavelet decomposition banks [72] to discriminate melanoma and non-melanoma cases, the artificial neural net-work (ANN) classifier is used for classification. The authors applied the approach on a database of 134 skin lesion images with 72 melanoma and 62 benign lesions. The
obtained results achieved a sensitivity of 90% and a specificity of 83%.
A comparison between wavelet [73] and curvelet transforms [74] for segmentation and identification of melanoma was implemented by Abu Mahmoud et al. [75]. Us-ing the two layers back-propagation neural network classifier on 448 digital skin lesion images, the result showed a better performance for curvelet compared to wavelet trans-form. The accuracy obtained using curvelet transform is 86.57%, which is much higher than the result obtained by wavelet transform with 58.44% of accuracy. Erkol et al. [76] proposed the gradient vector flow to find the border of skin lesions under 20 iterations. On a database of 100 dermoscopic images (30 malignant melanoma and 70 benign le-sions), 13.77% of error detection is obtained.
2.3.3 Thresholding Approaches
The idea of thresholding method is one of the simplest approaches of segmentation. The structure of these kind of methods is mostly to separate the image following some limits applied on gray-scale into binary image. Mostly, these methods are complemented by other approaches as morphological operators.
The thresholding approaches by morphological operators segmentation is one of the most known method and used in border detection in different imaging databases [77–82]. In skin cancer images, the morphological segmentation was used by Ganster et al. [83]. The authors explored a gray-scale morphology for segmentation. The method based on three algorithms of thresholding, global thresholding, dynamic thresholding and they also explore the blue color channel of RGB and CIE-Lab color space on 4000 lesion images, and after rejection of 159 images considered as rejected due to segmen-tation failures, they obtained around 96% of correctly segmented skin lesion images. Earlier, Shmid [84] used anisotropic diffusion and morphological flooding on dermo-scopic lesion detection. In [66], the adaptive thresholding showed a potential result compared to other used methods in terms of TDR and FPR performances. It performed a better result of true detection rate and false detection rate in benign and malignant
melanoma than gradient vector flow method, and it showed an equivalent result com-paring to other methods. In 2013, Celebi et al. [82] proposed an automated fusion of thresholding method with a Markov random field, applied on 90 dermoscopic images (23 malignant melanoma and 67 benign lesions), and compared to the state of the art methods expressing the result using exlusive-OR errors of 9.16 ± 5.21%.
Otsu thresholding segmentation [85] is developed and applied for automatic bor-der detection in bor-dermoscopic images [75, 86–89]. This method is always combined with other methods to perform the segmentation. In Abbas et al. [88], the authors proposed a combined algorithm of Otsu thresholding algorithm and a morphological reconstruction-based algorithm. The authors presented a result of 92.10% of TDR and 6.41% of FPR on a database of 100 dermoscopic images.
2.3.4 Other Segmentation Methods
Genetic algorithms [90] were used by Xie et al. [91], where a self-generating neural network and the genetic algorithm were combined for the segmentation of dermoscopic images. Watershed technique [79, 92] was also used for lesion segmentation by Wang et al. [93]. It was applied on 100 skin lesions and had a percentage error of 15.98%. An anisotropic mean shift based on Fuzzy C-Mean (FCM) algorithm variant is used by Zhou et al. [94], where the authors utilized an anisotropic mean shift algorithm cou-pled with fuzzy c-means for the segmentation. Sobiecki et al. [95] used Gap-sensitive segmentation on digital images. The authors also applied their method on skin cancer images. Glaister et al. [96] used TDLS algorithm for textural feature extraction joined with TD metric to calculate the dissimilarity of the texture. Applied to 126 standard camera images, the segmentation results achieved an accuracy of detection of 98.3%, a sensitivity of 91.2% and a specificity of 99%. An unsupervised segmentation algo-rithm using k means clustering under spatial constraints was also proposed by Zhou et al. [97]. Qi et al. [98] applied a fully deep constitutional neural network to automati-cally segment melanoma. the authors learned their model on 2000 training images and tested on 600 images, then validated on 150 images. However, the authors illustrate
visually their results and they did not present any performance due to the small dataset used for learning step.
Table 2.2 summarizes the different methods of segmentation explored for skin lesion images. For each paper, the method used, the result obtained and the size of the dataset (number of images) are mentioned.
Table 2.2: Comparison and summary of some different methods used for segmentation Authors Segmentation method Database Results Abbas et al. [47] (2011) Region-based Active Contours [59] 320 images TDR of 92.17% and FPR of 5.62% Safi et al. [63] (2011) Multipahse seg-mentation with TV and H1 regulariza-tion [64] 4472 images Accuracy of 98.57% with a TDR of 99.1% Casttilejos et al. [68] (2012) Wavelet Transform mixed with three variants of FCM algorithm
50 images AUC value over then 0.96
Clawson et al. [99] (2009)
Harmonic wavelet transform [100]
30 images With ground truth of two ex-perts: 1St- Acc: 93.3%, Sen: 50%, Spe: 100%. 2nd-Acc: 93.3%, Sen: 95.2%, Spe: 88.9% Ma et al. [71] (2013) Wavelet decomposi-tion bank [72]
134 images Spe: 90.32%, Sen: 83.33% and Area of ROC: 89.07%.
Ganster et al. [83] (2001) Gray-scale morpho-logical segmentation 4000 images
Around 96% of correct seg-mentation.
![Figure 1.1: Different kinds of skin cancer classified by the Skin Cancer Foundation [2]](https://thumb-eu.123doks.com/thumbv2/123doknet/14656930.738809/23.892.140.703.843.1088/figure-different-kinds-cancer-classified-skin-cancer-foundation.webp)
![Table 1.1: ABCD rule with the interval values of p i and the weight factor w i of each component [1].](https://thumb-eu.123doks.com/thumbv2/123doknet/14656930.738809/27.892.117.744.168.448/table-abcd-rule-interval-values-weight-factor-component.webp)
![Table 1.2: The major and minor criteria of 7-point checklist and the different weights for each criterion [1].](https://thumb-eu.123doks.com/thumbv2/123doknet/14656930.738809/29.892.107.733.165.571/table-major-minor-criteria-checklist-different-weights-criterion.webp)
![Figure 3.3: A comparison between wavelet (a) and curvelet (b) [3]](https://thumb-eu.123doks.com/thumbv2/123doknet/14656930.738809/70.892.229.738.109.348/figure-comparison-wavelet-curvelet-b.webp)