HAL Id: hal-03244260
https://hal.archives-ouvertes.fr/hal-03244260
Submitted on 1 Jun 2021
HAL is a multi-disciplinary open access
archive for the deposit and dissemination of
sci-entific research documents, whether they are
pub-lished or not. The documents may come from
teaching and research institutions in France or
abroad, or from public or private research centers.
L’archive ouverte pluridisciplinaire HAL, est
destinée au dépôt et à la diffusion de documents
scientifiques de niveau recherche, publiés ou non,
émanant des établissements d’enseignement et de
recherche français ou étrangers, des laboratoires
publics ou privés.
blood CD8 + T cells in patients with toxic epidermal
necrolysis
Axel Patrice Villani, Aurore Rozieres, Benoît Bensaid, Klara Kristin Eriksson,
Amandine Mosnier, Floriane Albert, Virginie Mutez, Océane Brassard, Tugba
Baysal, Mathilde Tardieu, et al.
To cite this version:
Axel Patrice Villani, Aurore Rozieres, Benoît Bensaid, Klara Kristin Eriksson, Amandine Mosnier,
et al.. Massive clonal expansion of polycytotoxic skin and blood CD8 + T cells in patients with
toxic epidermal necrolysis. Science Advances , American Association for the Advancement of Science
(AAAS), 2021, 7 (12), pp.eabe0013. �10.1126/sciadv.abe0013�. �hal-03244260�
Massive clonal expansion of polycytotoxic skin and
blood CD8
+
T cells in patients with toxic epidermal
necrolysis patients
Axel Patrice Villani1,2*, Aurore Rozieres1*, Benoît Bensaid2, Klara Kristin Eriksson3,
Amandine Mosnier1, Floriane Albert1, Virginie Mutez1, Océane Brassard1, Tugba Baysal1,
Mathilde Tardieu1, Omran Allatif1, Floriane Fusil1, Thibault Andrieu1,4, Denis Jullien1,2,
Valérie Dubois5, Catherine Giannoli5, Henri Gruffat1, Marc Pallardy6, François-Loïc Cosset1,
Audrey Nosbaum1,7, Osami Kanagawa1, Janet L. Maryanski8, Daniel Yerly3,9,
Jean-François Nicolas1,7*, Marc Vocanson1*†
Toxic epidermal necrolysis (TEN) is a life-threatening cutaneous adverse drug reaction. To better understand why skin symptoms are so severe, we conducted a prospective immunophenotyping study on skin and blood. Mass cytometry results confirmed that effector memory polycytotoxic CD8+ T cells (CTLs) are the main leucocytes in
TEN blisters at the acute phase. Deep T cell receptor (TCR) repertoire sequencing identified massive expansion of unique CDR3 clonotypes in blister cells. The same clones were highly expanded in patient’s blood, and the degree of their expansion showed significant correlation with disease severity. By transducing and chains of the ex-panded clonotypes into a TCR-defective cell line, we confirmed that those cells were drug specific. Collectively, these results suggest that the relative clonal expansion and phenotype of skin-recruited CTLs condition the clinical presentation of cutaneous adverse drug reactions.
INTRODUCTION
Toxic epidermal necrolysis (TEN) is characterized as a rapidly pro-gressing blistering eruption accompanied by an important mucosal involvement and skin detachment. Hence, TEN is associated with a high mortality rate of approximately 25 to 40% and nearly constant and invalidating sequelae, which are responsible for profound loss of quality of life in surviving patients (1–3).
The etiopathogenesis of TEN, similar to other cutaneous adverse drug reactions (cADRs), involves the activation of drug-specific T cells, which have been isolated and cloned from the blood and the skin lesions of patients with TEN (4–7). Similar to chemical haptens, the majorities of the drugs responsible for TEN are protein reactive and generate new drug-peptide epitopes that trigger a hypersensitivity/ allergic reaction (8–10). Notably, recent works suggest that T cell stimulation could also be consecutive to a direct and noncovalent interaction of the drug with the T cell receptor (TCR) or the major histocompatibility complex (MHC)–binding groove (a process re-ferred to as “p-i concept”) (11), as well as via the presentation of an altered repertoire of self-peptides (12, 13).
The current paradigm for TEN onset states is that, once they have been primed in lymphoid organs, drug-specific cytotoxic CD8+ T cells
(CTLs) are recruited at the dermo-epidermal junction where they kill keratinocytes presenting drug epitopes at their surface, through mechanisms involving perforin/granzyme B and MHC class I– restricted pathways (6, 10). To explain the extensive blister formation and subsequent skin detachment, several investigators have reported that specific T cells produce massive amounts of soluble mediators such as granulysin (14), interferon- (IFN-), or tumor necrosis factor– (TNF-) that further amplify and extend keratinocyte cell death. IFN- and TNF- promote Fas ligand (FasL) expression on keratinocytes, followed by cell-cell suicide (via Fas-FasL presentation), which may explain disseminated epidermal apoptosis in some pa-tients (15). Alternatively, other studies have suggested that natural killer (NK) cells and inflammatory monocytes exert an additional contribution to epidermal necrolysis, notably via granulysin-dependent, TNF-like weak inducer of apoptosis (TWEAK/CD255)–dependent, TNF-related apoptosis inducing ligand (TRAIL/CD253)–dependent, or annexin A1–dependent mechanisms (16–18).
These immunological features are now well established, includ-ing the skin infiltration by CTLs (19). Yet, most of them have also been detected in patients suffering from less severe cADRs, such as maculopapular exanthema (MPE) (20, 21). Patients with MPE har-bor limited spots of epidermal apoptosis/necrolysis (22, 23), but no blisters, and fast healing upon drug discontinuation. Hence, to date, it is still largely unknown why some patients, who sometimes take the same drugs (24, 25), develop a severe and life-threatening dis-ease (TEN) or a mild reaction (MPE). The fact that drug-specific CTLs are involved in diverse types of cADRs questions whether their number, their functions, or their activation parameters are specific to TEN disease. Moreover, the differential recruitment of uncon-ventional cytotoxic leucocytes could also precipitate the severity of this disease.
To gain further insight on TEN pathogenesis, we conducted a comprehensive immunophenotyping study to characterize the immune
1Centre International de Recherche en Infectiologie (CIRI); INSERM, U1111; Université
de Lyon 1; Ecole Normale Supérieure de Lyon; and CNRS, UMR 5308, Lyon, France.
2Drug Allergy Reference Center, Hospices Civils de Lyon, Hôpital Edouard Herriot,
Service de Dermatologie, Lyon, France. 3Department of Rheumatology, Immunology
and Allergology, Drug Allergy Research Laboratory, University Hospital of Bern, 3010 Bern, Switzerland. 4SFR Biosciences Gerland, US8, UMS3444, Lyon, France. 5Etablissement Français du Sang (EFS), Décines, France. 6INSERM, UMR 996, Châtenay-
Mallabry, France. 7Département d’Allergologie et d’immunologie Clinique, Hôpital
Lyon Sud, Pierre-Bénite, France. 8Unité de Thérapie Cellulaire et Génique (UTCG), Centre
Hospitalier Universitaire de Nice, 06101 Nice, France. 9ADR-AC GmbH, Holligenstrasse
91, 3008 Bern, Switzerland.
*These authors contributed equally to this work. †Corresponding author. Email: [email protected]
The Authors, some rights reserved; exclusive licensee American Association for the Advancement of Science. No claim to original U.S. Government Works. Distributed under a Creative Commons Attribution License 4.0 (CC BY).
cells infiltrating the skin or circulating in the blood of patients suf-fering from TEN or MPE at the time of disease diagnosis. Our re-sults revealed a marked clonal expansion of polycytotoxic CD8+ T cells in the blood and skin of patients with TEN, which may affect final clinical severity.
RESULTS
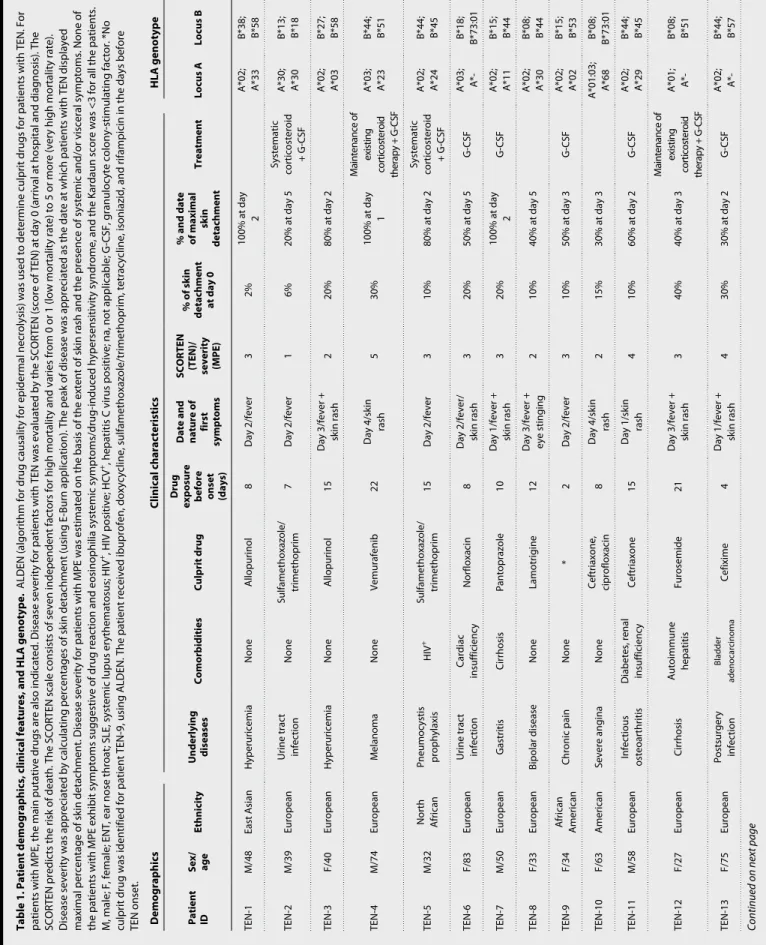
Skin and blood samples were collected from 18 TEN and 14 MPE hospitalized patients at the acute phase of their disease. Samples were recovered within 0 to 2 days after their hospital admission and diagnosis and within 0 to 5 days after the first symptoms (mainly fever and/or skin rash). Hence, most of the samples were collected before the peak of the disease, characterized for patients with TEN by the maximal percentage of skin detachment (Table 1 and table S1). Noteworthy, most of the patients displayed very diverse human leukocyte antigen (HLA) genotypes. A*02 and B*44 were the most represented loci (Table 1). A careful investigation of causative drug(s) associated to skin symptoms revealed a large variability in terms of drug nature or mode of action. The same molecule was reported as the culprit drug only for pairs of patients with TEN (allopurinol for patients TEN-1 and TEN-3, sulfamethoxazole/trimethoprim for TEN-2 and TEN-5, and ceftriaxone for TEN-10 and TEN-11; Table 1). Immunophenotype of leukocytes infiltrating the skin of patients with TEN
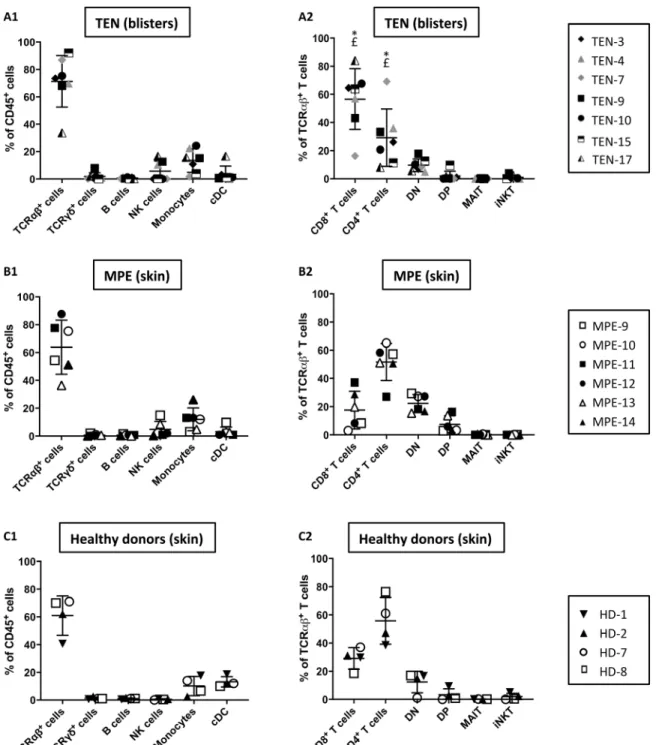
We first examined the immunophenotype of cells infiltrating the skin of patients with TEN by mass cytometry [cytometry by time of flight (CyTOF)] and subsequent computational data analysis. Blister cell samples obtained from seven patients with TEN were analyzed by CyTOF using a panel of 29 antibodies (table S2), enabling mapping of all major peripheral blood mononuclear cell (PBMC) subsets (lineage gating strategy is represented in fig. S1). We detected a large predominance of conventional T lymphocytes (TCR+; mean ±
SD = 71.3 ± 18.8%) among hematopoietic CD45+ cells, along with a minor infiltration of monocytes (CD14+ subset, 13.47 ± 8.6%); NK
cells (TCR−CD56+, 5.8 ± 7.2%); and very few gamma delta T (TCR+, 1.9 ± 2.8%), B (CD19+, 0.6 ± 0.6%), or dendritic cells (CD11c+, 3.4 ± 5.9%)
(Fig. 1A1). Conventional T lymphocytes were CD8+ (56.64 ± 21.6%), CD4+ (29.24 ± 20.4%), or double negative (9.6 ± 4.4%) T cells
(Fig. 1A2), and rare double-positive (2.0 ± 3.4%), mucosal-associated invariant T (MAIT) (CD4−CD8−TCRV7.2+, 0.2 ± 0.1%) cells, or
invariant NKT (iNKT; TCRintTCRV24+, 1.0 ± 1.5%) cells were recorded for all the patients (Fig. 1A2). When adjacent skin biopsies were collected instead of blister fluids, similar results were found, except for an increased representation of CD4+ versus CD8+ T cell
fraction (fig. S2).
Similar to TEN, the inflamed skin of patients with MPE was in-filtrated by conventional T lymphocytes (63.8 ± 19.5% of hemato-poietic CD45+ cells) and, to a lesser extent, by CD14+ monocytes
(12.3 ± 8.1%) and NK cells (4.8 ± 5.8%) (Fig. 1B1). In contrast to TEN, the CD4+ fraction (51.58 ± 13.2%) was greater than the CD8+
counterpart (17.6% ± 13.4) (Fig. 1B2). These frequencies were com-parable to those found in the skin of healthy donors (Fig. 1C).
Last, we detected no major difference in the immunophenotype of cells circulating in the blood of patients with TEN, patients with MPE, and healthy donors, with CD8+ T cells representing approxi-mately a quarter of total TCR+ cells in all the tested samples (fig.
S3). Collectively, these results thus confirm that the blistering and
inflamed skin of patients with TEN is extensively infiltrated by CD8+ T cells (14, 26, 20). By contrast, no major skewing was recorded for unconventional lymphocytes, NK cells, or monocytes.
Clustering of skin CD8+ T cells into seven phenotypic
FlowSOM subsets
As CD8+ T cell–mediated cytotoxicity is key in the initiation and formation of drug-induced lesions, we investigated in detail the molecular cytotoxic expression patterns of CD8+ T cells in TEN blisters. We performed high-dimensional profiling and investigated the (co)expression of several cell death–associated molecules [not only granulysin, granzyme B, granzyme A, and perforin but also TRAIL (CD253), TWEAK (CD255), annexin A1, and CD107a], as well as different activation markers (CD27, CD38, CD56, CD57, CD137, and CD226). Using concatenated CyTOF data from different sam-ples (blisters, skin, and PBMCs from not only TEN and MPE but also healthy donors), we ran FlowSOM, a self-organizing map (SOM) clustering algorithm, to assess the heterogeneity of the CD8+ T cell
population present in the different patients. FlowSOM first strati-fied the CD8+ T cell population into 100 nodes. Projected as minimal
spanning tree in Fig. 2A and fig. S4, each SOM node groups cells with similar phenotypes, with the node size representing the number of cells within that node. Illustrations of minimal spanning tree ob-tained for each tissue sample are also shown in fig. S5. SOM nodes were next gathered in four main clusters, as automatically calculated using K-finder tree-level approach algorithm. Because K-finder ap-proach did not capture the full diversity of the concatenated popu-lation, we decided to increase the FlowSOM clustering to seven distinct clusters (clusters A to G). To define the phenotype identity of each cluster, we generated a heatmap showing the integrated me-dian fluorescence intensity (MFI) values of each marker in each FlowSOM cluster (Fig. 2B). Figure S6 shows FACS (fluorescence- activated cell sorting) analysis of the seven FlowSOM CD8+ T cell clusters.
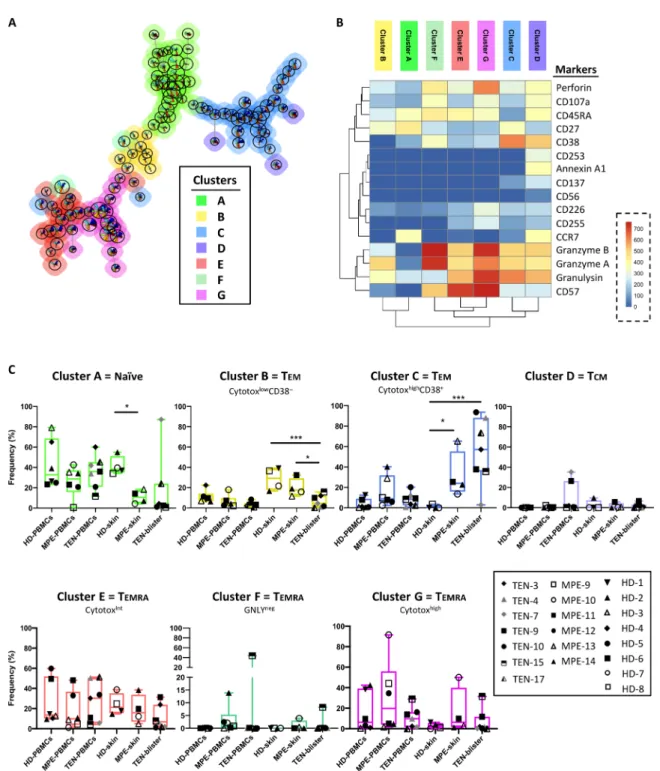
Cluster A displayed a phenotypic identity coincident with naïve T cells (characterized by high levels of CD45RA, CCR7, or CD27 and by the lack of classical cytotoxic markers such as granulysin, gran-zyme B, grangran-zyme A, or perforin), while clusters E, F, and G reca-pitulated the main features of TEMRA (effector memory T cell
reexpressing CD45RA) cells, i.e., high levels of CD45RA and CD57 and low levels of CCR7 and with granulysin, granzyme B, granzyme A, or perforin as the main variables between clusters (low, moderate, and high cytotoxicity, respectively, for clusters E, F, and G, but with no granulysin expression in cluster F) (Fig. 2B and fig. S6). Alter-natively, clusters B and C both displayed a phenotype of effector memory lymphocytes (TEM; CCR7− and CD45RA−), but conversely
to the former, cluster C was characterized by a phenotype of activated cytotoxic cells, as illustrated by their high level of CD38, granzyme B, and granulysin expression (Fig. 2B and fig. S12). The cluster D sub-population bore some of the hallmarks of central memory T cells (TCM; CCR7+ and CD45RA−), as well as an elevated expression of CD38, annexin A1, and CD253 markers (Fig. 2B and fig. S6). A polycytotoxic signature typifies lesional TEN CD8+ T cells
The in-depth FlowSOM analysis allowed a comparison of the fre-quency of the CD8+ T cell clusters in lesion (blisters and skin) and
blood samples from patients with TEN, patients with MPE, and healthy donors (Fig. 2C). Most of the clusters were present in all patient samples, except for clusters D and F found only in two and
Table 1. Patient demographics, clinical features, and HLA genotype.
ALDEN (algorithm for drug causality for epidermal necrolysis) was used to determine culprit drugs for patients with TEN.
For
patients with MPE, the main putative drugs are also indicated. Disease severity for patients with TEN was evaluated by the SCOR
TEN (score of TEN) at day 0 (arrival at hospital and diagnosis). The
SCORTEN predicts the risk of death. The SCORTEN scale consists of seven independent factors for high mortality and varies from
0 or 1 (low mortality rate) to 5 or more (very high mortality rate).
Disease severity was appreciated by calculating percentages of skin detachment (using E-Burn application). The peak of disease
was appreciated as the date at which patients with TEN displayed
maximal percentage of skin detachment. Disease severity for patients with MPE was estimated on the basis of the extent of skin
rash and the presence of systemic and/or visceral symptoms. None of
the patients with MPE exhibit symptoms suggestive of drug reaction and eosinophilia systemic symptoms/drug-induced hypersensiti
vity syndrome, and the Kardaun score was <3 for all the patients.
M, male; F, female; ENT, ear nose throat; SLE, systemic lupus erythematosus; HIV
+, HIV positive; HCV +, hepatitis C virus positive; na, not applicable; G-CSF, granulocyte colony-stimulating factor. *No
culprit drug was identified for patient TEN-9, using ALDEN. The patient received ibuprofen, doxycycline, sulfamethoxazole/trime
thoprim, tetracycline, isoniazid, and rifampicin in the days before
TEN onset. Demographics
Clinical characteristics HLA genotype Patient ID Sex/ age Ethnicity Underlying diseases Comorbidities Culprit drug Drug
exposure before onset (days) Date and nature of first symptoms SCORTEN (TEN)/ severity (MPE) % of skin detachment at day 0 % and date of maximal
skin detachment Treatment Locus A Locus B TEN-1 M/48 East Asian Hyperuricemia None Allopurinol 8 Day 2/fever 3 2% 100% at day 2 A*02; A*33 B*38; B*58 TEN-2 M/39 European
Urine tract infection
None Sulfamethoxazole/ trimethoprim 7 Day 2/fever 1 6% 20% at day 5 Systematic corticosteroid + G-CSF A*30; A*30 B*13; B*18 TEN-3 F/40 European Hyperuricemia None Allopurinol 15
Day 3/fever + skin rash
2 20% 80% at day 2 A*02; A*03 B*27; B*58 TEN-4 M/74 European Melanoma None Vemurafenib 22
Day 4/skin rash
5 30% 100% at day 1 Maintenance of existing corticosteroid therapy + G-CSF A*03; A*23 B*44; B*51 TEN-5 M/32 North African Pneumocystis prophylaxis HIV + Sulfamethoxazole/ trimethoprim 15 Day 2/fever 3 10% 80% at day 2 Systematic corticosteroid + G-CSF A*02; A*24 B*44; B*45 TEN-6 F/83 European
Urine tract infection
Cardiac
insufficiency
Norfloxacin
8
Day 2/fever/ skin rash
3 20% 50% at day 5 G-CSF A*03; A*-B*18; B*73:01 TEN-7 M/50 European Gastritis Cirrhosis Pantoprazole 10
Day 1/fever + skin rash
3 20% 100% at day 2 G-CSF A*02; A*11 B*15; B*44 TEN-8 F/33 European Bipolar disease None Lamotrigine 12
Day 3/fever + eye stinging
2 10% 40% at day 5 A*02; A*30 B*08; B*44 TEN-9 F/34 African American Chronic pain None * 2 Day 2/fever 3 10% 50% at day 3 G-CSF A*02; A*02 B*15; B*53 TEN-10 F/63 American Severe angina None Ceftriaxone, ciprofloxacin 8
Day 4/skin rash
2 15% 30% at day 3 A*01:03; A*68 B*08; B*73:01 TEN-11 M/58 European Infectious osteoarthritis Diabetes, renal insufficiency
Ceftriaxone
15
Day 1/skin rash
4 10% 60% at day 2 G-CSF A*02; A*29 B*44; B*45 TEN-12 F/27 European Cirrhosis Autoimmune hepatitis Furosemide 21
Day 3/fever + skin rash
3 40% 40% at day 3 Maintenance of existing corticosteroid therapy + G-CSF A*01; A*-B*08; B*51 TEN-13 F/75 European Postsurgery infection Bladder adenocarcinoma Cefixime 4
Day 1/fever + skin rash
4 30% 30% at day 2 G-CSF A*02; A*-B*44; B*57
Demographics Clinical characteristics HLA genotype Patient ID Sex/ age Ethnicity Underlying diseases Comorbidities Culprit drug Drug
exposure before onset (days) Date and nature of first symptoms SCORTEN (TEN)/ severity (MPE) % of skin detachment at day 0 % and date of maximal
skin detachment Treatment Locus A Locus B TEN-14 H/41 European Myeloma None Revlimid 15 Day 1 + fever + skin rash 2 5% 25% at day 3 Systematic corticosteroid A*02; A*02 B*15; B*27 TEN-15 F/69 European Lung infection Ischemic stroke, SLE Levofloxacin, metronidazole 5 Day 2 + fever + skin rash 3 10% 50% at day 3 A*03; A*30 B*18; B*40 TEN-16 F/69 European Lung infection None Pristinamycain 1
Day 0/fever + skin rash
2 10% 38% at day 2 A*02; A*03 B*35; B*51 TEN-17 M/50 European Infection None Azithromycin, paracetamol 5
Day 2/fever + skin rash
4 20% 80% at day 5 G-CSF A*02; A*03 B*07; B*51 TEN-18 M/58 European Liver cancer HCV + Sorafenib 10
Day 3/skin rash
5 5% 48% at day7 G-CSF A*03; A*11 B*35; B*40 MPE-1 H/18 European ENT infection None Amoxicillin 2
Day 1/skin rash
Mild na na Topical corticosteroid A*01; A*02 B*40; B*51 MPE-2 H/61 European ENT infection None Amoxicillin 3
Day 1/skin rash
Mild na na Topical corticosteroid A*02; A*-B*08; B*40 MPE-3 F/68 European Breast infection None Vancomycin 28
Day 4/skin rash
Severe na na Topical corticosteroid A*24; A*25 B*15; B*18 MPE-4 F/78 European Myeloma None Bortezomib 5
Day 4/skin rash
Severe na na Topical corticosteroid A*29; A*31 B*38; B*44 MPE-5 F/71 European Cardiac insufficiency None Diltiazem 15
Day 3/skin rash
Severe na na Topical corticosteroid A*02; A*-B*51; B*-MPE-6 F/62 European Infectious osteoarthritis None Vancomycin 2
Day 1/skin rash
Severe na na Topical corticosteroid A*01; A*02 B*40; B*57 MPE-7 H/61 North African Pulmonary infection None Vancomycin 42
Day 4/skin rash
Mild na na Topical corticosteroid A*02; A*32 B*49; B*51 MPE-8 F/24 East Asian Chronic pain None Ibuprofen 9
Day 3/skin rash
Severe na na Topical corticosteroid A*24; A*-B*15; B*38 MPE-9 F/94 European
Urine tract infection
None
Clindamycin
3
Day 3/skin rash
Mild na na Topical corticosteroid A*23; A*31 B*39; B49 MPE-10 F/62 European Graft-versus-host disease
Bone marrow transplant Piperacillin/ tazobactam,
contrast material
2
Day 1/skin rash
Mild na na Topical corticosteroid A*02; A*03 B*15:16; B*39 MPE-11 F/39 North African Hypertension SLE Macrogol, urapidil, amlodipine 14
Day 3/skin rash
Moderate na na Topical corticosteroid A*32; A*34 B*39; B*44 MPE-12 F/62 European Hypertension, gout None Allopurinol, fibrate 28
Day 2/skin rash
Mild na na Topical corticosteroid A*23; A*68 B*44; B*53 MPE-13 M/52 North African Myeloma None Revlimid, bortezomid 15
Day 2/skin rash
Severe na na Systemic corticosteroid A*01; A*02 B*07; B*51 MPE-14 F/67 European Dermatomyositis None Hydroxychloroquine 15
Day 4/skin rash
Mild na na Topical corticosteroid A*01; A*29 B*08; B*44
three patients, respectively. A degree of interindividual variation was found for most clusters. Notably, the activated polycytotoxic effec-tor memory subset (cluster C) was consistently elevated in TEN (mean, 55% of infiltrating CD8+ T cells) and, to a lesser extent, in MPE (mean,
30%) skin samples, relative to healthy donor (mean, 1%) samples (Fig. 2C). Unlike the other clusters, cluster C expressed high levels of the cell surface activation marker CD38. These results thus establish
that the major subset of TEN blister CD8+ T cells displays a hallmark CD38+ polycytotoxic effector memory cell phenotype (cluster C).
Restricted TCRV repertoire among TEN blister and blood CD8+ T cells
Parallel to these studies, we also addressed TCR usage of T cells present in TEN blisters. FACS analysis conducted on 24 of the most
Fig. 1. Immunophenotyping of leucocytes present in skin samples from TEN, MPE, or healthy donors. The leucocytes isolated from the blisters of seven patients
with TEN (A) and the skin of six patients with MPE (B) and four healthy donors (C) were analyzed by mass cytometry. Scatterplots depict percentages of conventional TCR+ lymphocytes, gamma delta T cells, B lymphocytes, NK cells, monocytes, or conventional dendritic cells (cDC) in CD45+ hematopoietic cells (A1 to C1) and
percent-ages of CD8+, CD4+, double-negative (DN), and double-positive (DP) T cell subsets, as well as iNKT and MAIT cells in gated TCR+ population (A2 to C2). Mean
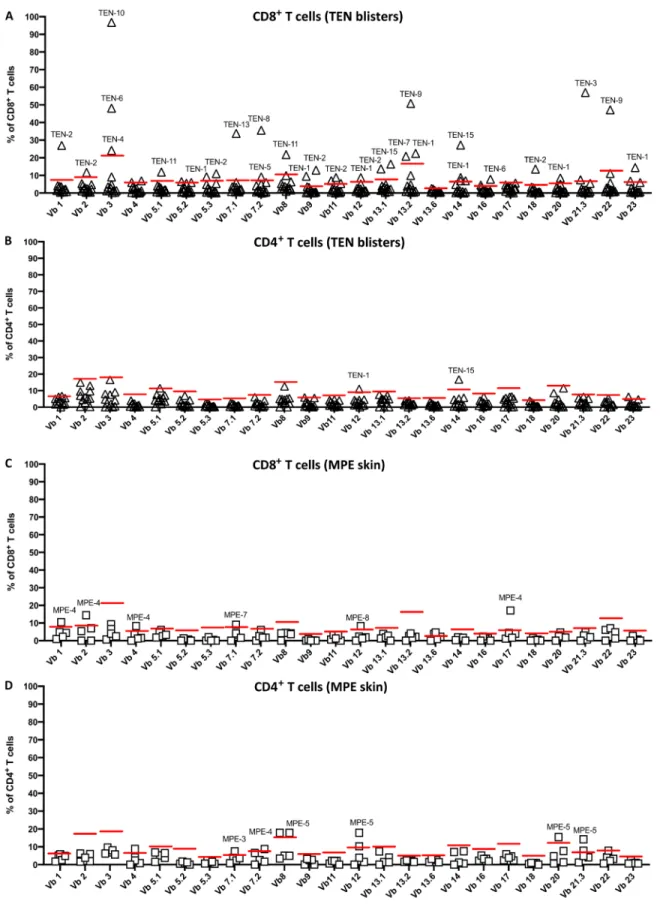
common Vbeta (V) chains found a highly restricted TCRV rep-ertoire usage in the 13 patients with TEN tested, with single V ex-pansions ranging from as much as 20 to 80% of total TCRV chains expression, when compared to healthy donors (Fig. 3 and fig. S7).
This preferential usage, detectable at the CD3+ population level (fig.
S8), concerned almost exclusively CD8+ (Fig. 3A) and rarely CD4+
T cells (Fig. 3B). It concerned quasi all the 24 V chains (with the exception of V4, V5.2, V13.6, and V17, using antibody V
Fig. 2. High-dimensional cell analysis of CD8+ T cells identifies TEN-enriched immunophenotypes. FlowSOM analysis with automatic consensus clustering was performed on concatenated CD8+ T cell data (300 cells per sample) from both lesion (blisters/skin) and PBMC samples from patients with TEN, patients with MPE, and healthy donors (HD).
(A) Results were presented as minimal spanning tree (MST) of 100 nodes gathered in seven background colored clusters (A to G). Each node includes phenotypically similar cells, and the size of the node indicates the number of cell events. See MST magnification in fig. S4 to understand marker expression in respective SOM nodes. (B) Heatmap of the inte-grated MFI of 16 markers across the seven FlowSOM clusters identified in (A). The color in the heatmap represents the median of the arcsinh for each cluster (centroid) with 0 to 1 transformed marker expression. Clusters (columns) and markers (rows) were hierarchically metaclustered using Ward’s method to group subpopulations with similar phenotype. (C) Cluster frequencies were determined for each sample from each individual to understand tissue abundance. Statistics compared frequencies of each cluster in PBMC or skin samples versus the frequency of the respective cluster in healthy donor samples. *P < 0.05 and ***P < 0.01, Mann-Whitney test (two tailed). GNLY, granulysin.
Fig. 3. TCRV repertoire usage in T cell subsets isolated from the lesional skin of patients with TEN and MPE. The leucocytes isolated from the blisters of 13 individuals
with TEN (A and B) and the lesional skin of 5 individuals with MPE (C and D) were analyzed by flow cytometry. Histograms depict percentages of the 24 TCRV chains in gated CD8+ (A and C) and CD4+ (B and D) T cell subsets, using the IOTest Beta Mark TCR V Repertoire Kit (TCRV 1 to 4, 5.1, 5.2, 5.3, 7.1, 7.2, 8, 9, 11, 12, 13.1, 13.2, 13.6, 14,
16 to 18, 20, 21.3, and 22, 23). Each symbol (triangles for TEN and squares for MPE) represents a different individual. The red bar illustrates the threshold value from which TCRV chains were considered as highly expanded [using Tukey’s rule for the detection of outliers, i.e., Q3 + 1.5 × interquartile range (IQR)].
nomenclature). V3 and V13.2 were the most overrepresented V chains, each found in 3 of 13 patients with TEN. Patients TEN-1 and TEN-2 showed overexpression of at least six TCRV chains, and TEN-9 exhibited two dominant V13.2+ and V22+ chains, each
representing approximately 45% of total TCRV repertoire for this patient (Fig. 3A).
Although less marked than in TEN blisters, TCRV expansions were observed in CD8+ T cells (but not CD4+ T cells) from TEN
PBMCs, with notable biases in patients TEN-3 to TEN-6, TEN-10, TEN-11, TEN-13, and TEN-15 (fig. S9, A and B). In contrast, a lim-ited number of TCRV expansions were detected in CD8+ and CD4+ T cells isolated from MPE skin (Fig. 3, C and D) and PBMC samples (fig. S9, C and D), when compared to healthy donors (fig. S7). Massive oligoclonal expansion of the TCR complementarity-determining region 3 (CDR3, the antigen recognition domains) to evaluate sample clonality
As FACS cannot catch the full spectrum of the TCR repertoire, we next used high-throughput sequencing (HTS) of the TCR CDR3 regions (the antigen recognition domains) to evaluate sample clon-ality. HTS was performed on total blister, skin, and PBMC samples from patients with TEN and MPE.
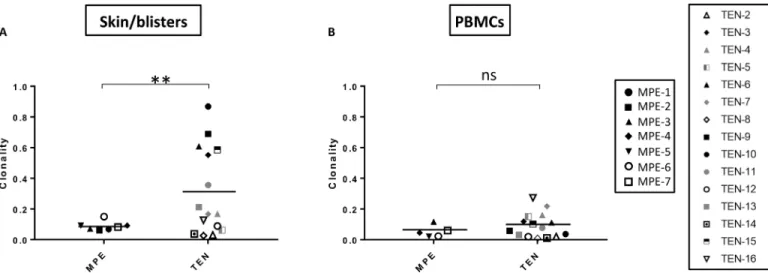
Investigations of TCR repertoire diversity, measured using Shannon entropy–based clonality index metric, first revealed the presence of a highly clonal repertoire in the blisters of approximately half of patients with TEN (Fig. 4A and table S3A). By contrast, no differ-ence was detected among PBMCs from patients with TEN and MPE (Fig. 4B and table S3B) compared to healthy donors [data not shown table S4; for healthy donor comparison, data were retrieved from Adapt-ive Biotechnologies project on normal human PBMCs at www. adaptivebiotech.com/products-services/immunoseq/immunoseq- analyzer and from (27), thus including data from 44 healthy donors].
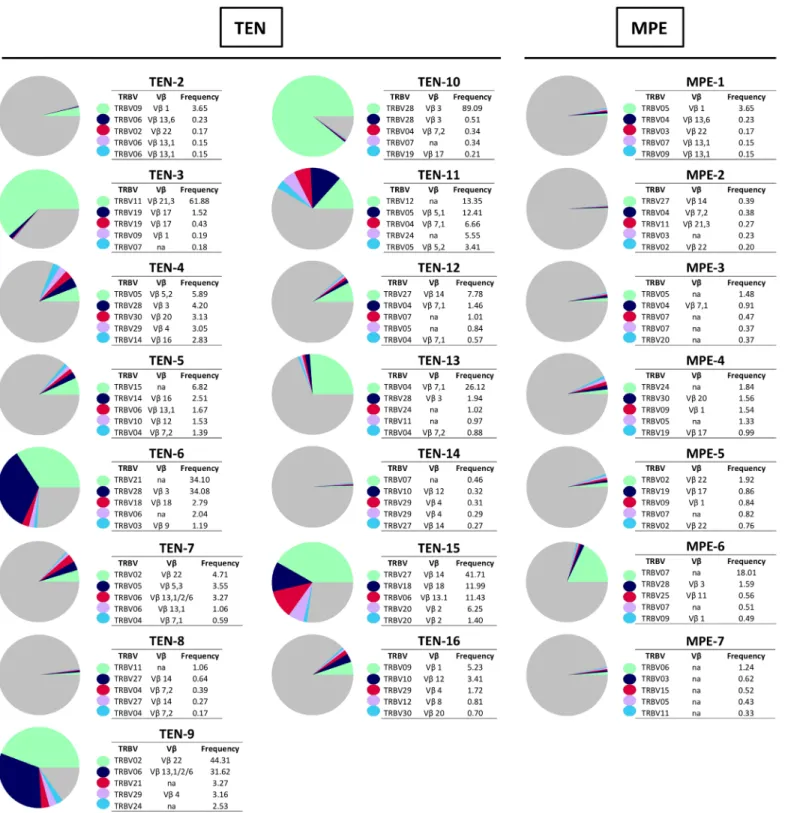
In-depth analysis of the T-cell receptor beta variable region (TRBV) repertoire next confirmed the existence of preferential TCR biases in the blisters of 12 of 15 patients with TEN. These were the result of very limited numbers of CDR3 clonotype expansions, ranging from >10 to 90% of total TCR sequences for combined top five
clones, except for TEN-2, TEN-8, and TEN-14 (Fig. 5 and tables S5). Notably, clone-tracking analyses revealed (i) that expanded clones expressed the same V chain cells as those observed by FACS (table S5) and (ii) no sharing of identical TCR CDR3 nucleotide (fig. S10) or amino acid (fig. S11) sequences among the 15 patients with TEN. An interesting exception was noted for one clone from patients TEN-6 and TEN-10, which shared amino acid but not nucleotide sequence (figs. S10 and S11). As these patients were exposed to norfloxacin and ciprofloxacin quinolones, respectively, and both expressed HLA-B*73:03 (Table 1), potential epitope cross-reactivity could have led to the expansion of clones sharing identical TCR chains. Another interesting observation was noted for the two dominant clones from patient TEN-9 (Fig. 3). Parallel TRBV and TRAV (T-cell receptor alpha variable region) investigations performed on FACS-sorted CD8+TCRV13.2+ and CD8+TCRV22+ cells of this patient revealed that they represent, in fact, a unique T cell clone, which has rear-ranged two functional TCR genes (TRBV02-01*01 and TRBV06 sequences, respectively), as well as two functional TCR genes (with the same TCRVA19-01*01 sequence, but distinct TRAJ segments, TRAJ30-01*01 and TRAJ29-01*01, respectively) (table S6).
Conversely to TEN, similar TRBV repertoire analysis revealed that clonal expansions were rare for patients with MPE and were usually lower than 5% (Fig. 5 and table S7). Clonotypes that were massively expanded in the TEN blisters were also found elevated in the blood of respective patients, at least for the top five clones (figs. S12 and S13 and tables S8 and S9). This result then indicates that the massive infiltration of unique clonotypes in TEN blisters was likely to be consecutive to a previous clonal expansion in the lymphoid organs. Only for patient TEN-15, and, to a lesser extent, for patients TEN-6 and TEN-11, were some of the highly expanded skin clones not represented in the blood (fig. S13).
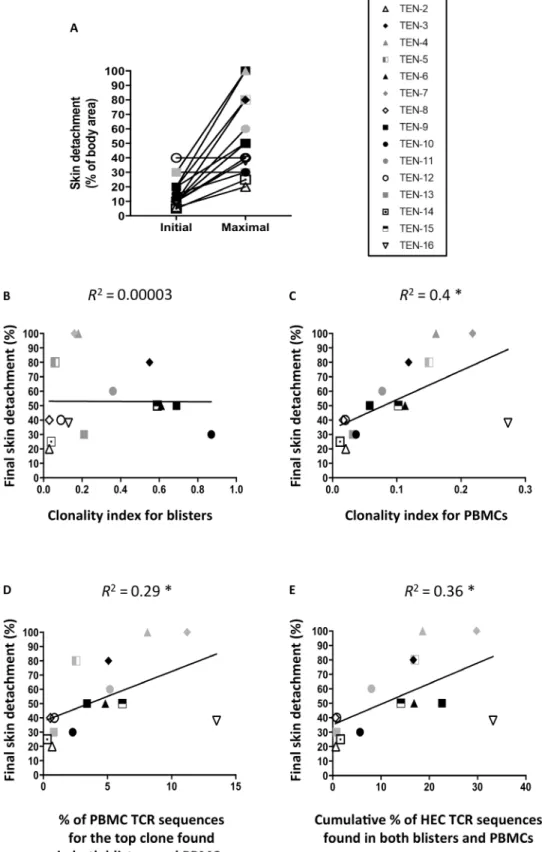
T cell repertoire diversity and clonal expansion of blister clones circulating in blood correlates with TEN severity TEN severity, assessed here as the percentage of final skin detach-ment, varied significantly after hospital admission (Fig. 6A) and was maximal between 1 and 7 days (mean ± SD = 3.2 ± 1.6 days;
Fig. 4. Increased clonality indices in TEN blister but not TEN PBMC samples. TCR repertoire diversity was evaluated by HTS on total blister and skin (A) and PBMC
(B) samples from 15 individuals with TEN and 7 individuals with MPE. Scatterplots depict Shannon entropy–based clonality indices for total productive TCR rearrangements. Exact dates of sample collection are reported in table S1. Values approaching 1 indicate a highly clonal repertoire in which a small number of rearrangements comprise a large portion of all immune cells. Conversely, values approaching 0 indicate a polyclonal repertoire where all rearrangements are present at an identical frequency. **P < 0.01. Student’s t test (two tailed). ns, not significant.
Table 1). We then investigated potential correlations between clonal expansions in the blisters or the blood of patients with TEN (measured at days 0 to 2 after hospital admission) and final skin detachment. While no association was detected with blister clonality indices
(R2 = 0.00003, P is not significant; Fig. 6B), by contrast, we observed
that patients with the highest PBMC clonality indices presented the highest percentage of final skin detachment (R2 = 0.4, P = 0.01; Fig. 6C).
Besides, substantial correlations were also found between the
Fig. 5. Frequency and TRBV usage of the highly expanded TCR clonotypes. The leucocytes isolated from the blisters of 15 individuals with TEN and the lesional skin
of 7 individuals with MPE were evaluated using HTS of the TCR. Pie charts illustrate frequencies of the five most expanded TCR clonotypes (measured as percentage of unique CDR3 sequence among all productive rearrangements within a sample). Colors indicate the respective TRBV usage of each TCR clonotype. Gray indicates the remaining clonotypes found in the same sample. Cross-reference for the corresponding anti-V monoclonal antibody (mAb) nomenclature is also provided.
Fig. 6. The percentage of maximal skin detachment in patients with TEN correlates with clonality indices and clonal expansion of skin clones in PBMCs.
Quanti-fication of skin detachment (expressed as percentage of total body area) in 15 patients with TEN was appreciated at their arrival at the hospital (initial) and at the peak of the skin reaction (maximal) (A). The latter was compared with the Shannon entropy–based clonality indices determined in blisters (B) and PBMCs (C). Correlations be-tween clinical severity and the percentages of the top clone (C) or the cumulative percentages of the highly expanded clones (HEC) are also provided (D). Respective correlation factors were calculated using the Pearson correlation method. The coefficient of determination, R2, and statistical significance are indicated for each
centage of final skin detachment, as shown for the top one (R2 = 0.29,
P = 0.04; Fig. 6D) and for the highly expanded clones, i.e., clones
represented at a frequency >0.05% of TRBV repertoire in each pa-tient (R2 = 0.36, P = 0.02; table S3 and Fig. 6E). Combined with the lack of major TCR CDR3 biases found in MPE samples (skin or blood) (Figs. 4 and 5), our results thus demonstrate that the massive expansion of unique clonotypes is a major feature of TEN patholo-gy and that the level of expansion of those unique clonotypes among PBMCs at the acute phase is directly related to clinical severity. V-expanded CD8+ T cells display the polycytotoxic
phenotype overrepresented in TEN samples
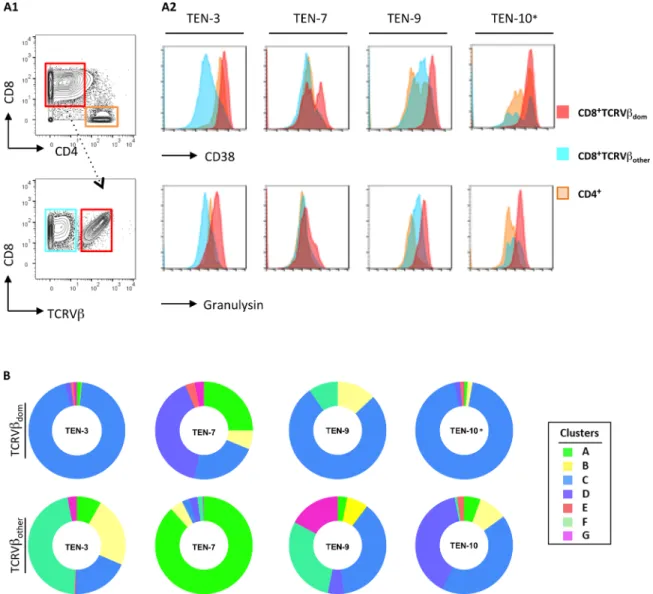
Thereafter, by taking advantage of mass cytometry, we were able to track back highly V-expanded CD8+ T cells in the blisters and blood of patients with TEN to analyze their phenotype. We first demon-strated that CD8+ T cells expressing dominant V chains (FACS analysis) displayed very high levels of granulysin and CD38 markers, when compared to their nondominant CD8+V+ T cell counterparts (Fig. 7A). By superimposing dominant and nondominant TCRV+
markers on our concatenated CD8+ T cell clusters, we next demon-strated that dominant TCRV+ cells mainly expressed the cytotoxic
cluster C phenotype (Fig. 7B). Conversely, the nondominant TCRV+ cells were detected in all the different clusters. This analysis confirms that major V-expanded CD8+ T cells display the polycytotoxic phenotype that is overrepresented in TEN samples.
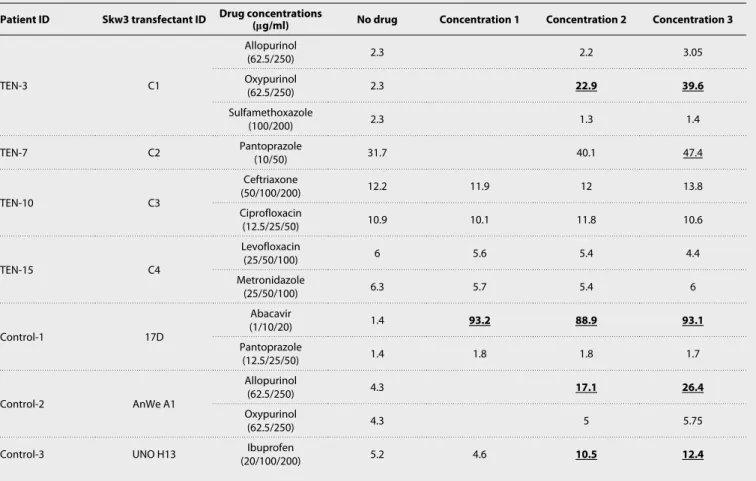
Expanded clones in blisters and blood are drug specific Ultimately, we sought to determine whether highly expanded and activated clones were drug specific. To this end, we FACS-sorted dominant CD8+TCRV+ T cells present in the blister fluids or the blood of four patients with TEN (TEN-3, TEN-7, TEN-10, and TEN-15) and sequenced their TRAV repertoire. For most dominant clones, a productive rearrangement (table S10) encoding a functional TCR chain and a second nonproductive TCR locus rearrangement (ta-ble S11) were identified. Then, the productive rearranged TCR and TCR chains were transduced into Skw3 cells, a TCR-defective lym-phoma line (table S12) (28). After verification of sustained and stable TCR expression (fig. S14), transduced Skw3 cells were stimulated with the culprit (or control) drug in presence of autologous Epstein-Barr virus (EBV)–transformed B cells generated from patient’s PBMCs. The following day, we measured CD69 expression at the surface of Skw3 cells as a marker for TCR stimulation.
Results showed a positive dose response for patient TEN-3 with oxypurinol (the metabolite of allopurinol, the culprit drug for TEN-3) but not with the parent drug or an irrelevant drug (sulfamethoxazole) (Table 2 and fig. S14). A positive response was also found for patient TEN-7 with the culprit pantoprazole (Table 2). In contrast, we failed to detect robust CD69+ expression in transductants generated from patients TEN-10 and TEN-15, stimulated respectively with ceftriax-one and ciprofloxacin or levofloxacin and metronidazole (Table 2).
DISCUSSION
The main objective of our study was to gain further insights into TEN pathophysiology by tracking immune cells that are present in the skin and the blood of patients at disease onset. Our results con-firm that CTLs are the main leukocyte subset found in TEN blisters, followed by a minor infiltration of CD14+ monocytes and NK cells,
phocytes such as NK T, MAIT, or gamma delta T cells. Notably, deep sequencing of the TCR CDR3 repertoire revealed that there was a massive expansion of unique CD8+ T cell clones in patients
with TEN (both in skin and blood), which express an effector mem-ory phenotype and an elevated level of cytotoxic or inflammatmem-ory/ activation markers such as granulysin, granzymes A and B, or CD38. By transducing and chains of the expanded clones into immortalized T cells, we demonstrate that some of these clones were drug specific. T cell repertoire diversity analysis revealed that clonal expansion of blister clones circulating in the blood of patients with TEN at the onset of the disease correlated with the final clinical severity, as defined by the maximal percentage of skin detachment.
The most marked observation of our study is certainly the demon-stration that there is a marked expansion of unique polycytotoxic CD8+ T cell clones in patients with TEN, which largely outnumbers
the frequency of clonotypes expanding in patients with less severe MPE. A few studies have already described oligoclonal expansion in TEN [or in the less severe Stevens-Johnson syndrome (SJS)]. These studies focused on in vitro T cell (re)activation experiments or used samples that were isolated from individuals with restricted HLA genotype, for instance, HLA-B*15.02 (4, 29), and reactive to a limit-ed number of compounds, mainly allopurinol and carbamazepine (4, 29–31). They showed preferential usage of TRBV subtypes, clonal expansion of specific CDR3, and less TCR diversity in comparison to data obtained from healthy or drug-tolerant donors. Similarly, the infiltration of predominant T cell clones has already been re-ported in many benign inflammatory skin diseases such as psoria-sis, atopic dermatitis, and contact dermatitis (and in MPE, as shown in our study; Fig. 5) (32, 33). Here, novelty then resides in the demon-stration that the strength of clonal expansions reached levels, in both blisters and blood, that have only been described in skin neoplasic disorders, such as cutaneous T cell lymphomas (33). In addition, the fact that our results can be generalized to patients expressing highly diverse HLA genotypes and reactive to very different drugs (Table 1) reinforces the idea that a massive clonal bias is a major immunological hallmark of TEN disease. Notably, as expected, we failed to detect any shared TCR sequences in our HLA diverse cohort, except for patients TEN-6 and TEN-10, exposed respectively to norfloxacin and ciprofloxacin quinolones and who both expressed HLA-B*73:03. Unfortunately, because of low sampling, it was not possible to com-pare TCR sequences from patients TEN-1 and TEN-3, harboring the HLA-B*58 risk allele and exposed to allopurinol.
It will be crucial to determine in the future the reasons for such clonal expansion in TEN disease compared to less severe MPE. (i) The massive production of inflammatory mediators noticed in the sera and the blister fluid of patients with TEN (14, 34) certainly par-ticipates to enlarge the proliferation of drug-specific cells, but whether it is a consequence, a cause, or both remains to be clarified. (ii) T regulatory cells (Tregs) are critical regulators of CTLs causing TEN
in mouse models (35). In this context, the reported defective func-tions of TEN circulating Tregs and their decreased ability to infiltrate
the skin (36, 37) may explain the uncontrolled expansion and skin migration of drug-specific CTLs. Our data showed a differing CD4/ CD8 ratio between TEN (ratio, 0.5) and MPE skin (ratio, 2) with MPE having a ratio similar to healthy skin (Fig. 1). This suggests that the skin CD4+ Tregs/CD8+ CTL ratio may be a major parameter
to control CTL activation in situ and, therefore, disease progression in TEN versus MPE. Future studies are needed to confirm the
quantitative and qualitative defects of skin Tregs in TEN compared
to MPE. (iii) Alternatively, it could be hypothesized that patients with TEN have a drug-specific preimmune repertoire that is prone to considerable enlargement. Several preclinical studies have shown that the breadth of immune response strongly depends on the num-ber of specific T cell precursors (38), and a recent study from Pan
et al. (29) showed an expansion of public TCR clonotypes in single
HLA- restricted carbamazepine-allergic patients with SJS/TEN, ques-tioning the possibility that patients with TEN with similar HLA and exposed to the same drug develop/amplify the same pathogenic T cell repertoire. (iv) Another assumption addresses heterologous im-munity and a possible accumulation of pathogenic clones due to cross-reactivity with a reservoir of virus-specific memory T cells (39). (v) Last, it is still completely unknown whether drug accu
mulation [due to defective drug detoxification mechanisms (40)] pre-dominates within TEN, fostering continuous T cell stimulation.
Another important point of the present study is the extended characterization of the expanded clonotypes, which mostly comprise CD8+ T cells endowed with a polycytotoxic phenotype. We observed
that the dominant skin TCRV+ CTLs mainly expressed the cluster C phenotype, which was assigned to TEM cells. As expected (26, 40),
this subset expressed high levels of granzyme A, granzyme B, and espe-cially granulysin markers, and it was the only subset (with cluster D, poorly represented in skin samples) to express the CD38 protein, which is classically associated with T cell activation and/or diapedesis (41). By contrast, it lacked the expression of the senescence marker CD57 (classically assigned to TEMRA subsets), indicating that the expanded
CTL clones correspond to recently activated T cells.
Fig. 7. Immunophenotype of dominant TCRV+ cells. The dominant CD8+TCRV+ cell subset isolated from the blister fluids of four individuals with TEN (TEN-3, TEN-7,
TEN-9, and TEN-10) was analyzed for the expression of CD38 and granulysin by mass cytometry (A). Pictures depict representative gating strategy to select the dominant CD8+TCRV+ cell subset [TCRV21.3+ for TEN-3, TCRV13.2+ for TEN-9 or TEN-7, and see * for TEN-10 (A1)] and histogram overlays of CD38 and granulysin expression,
when compared with nondominant CD8+TCRV (others) or CD4+ T cell counterparts (A2). To characterize the phenotypic identity of respective subsets, CyTOF data were
superimposed on concatenated CD8+ T cell clusters identified in Fig. 2. Donut representations depict the frequency of each cluster in dominant and nondominant
CD8+TCRV+ cell subsets (B). *Notably, as no anti-V3 mAb exists for CyTOF, dominant TCRV3+ cells in patient TEN-10 (which represent 90% of total CD8+ T cells in skin)
By comparison, CD8+ T cells infiltrating the skin of MPE or healthy donors displayed a distinct functional phenotype, as shown both at the total population level (fig. S5) and after multidimensional analysis (Fig. 2). We notably detected less (MPE) or no (healthy do-nors) cluster C subset but more nonactivated TEM cells (cluster B)
and a TEMRA subset (cluster E) endowed with moderate expression
of cytotoxic markers (when compared to other TEMRA subsets). It is
probable that the main differences recorded between TEN and MPE (notably the differing CD4:CD8 ratio; Fig. 1) are due to the strong clonotype expansions and not the different type of tissues that we collected (TEN blisters versus MPE skin) because comparative analysis of adjacent blister skin in patients with TEN exhibited similar V expansion and phenotype (figs. S15 to S17). It will be interesting to determine in future studies whether drug-specific skin MPE T cells are also found in cluster C, as for TEN (20, 26). Besides, it will be important to uncover whether drug-specific T cells from patients with TEN have a unique ability to expand and/or to differentiate into potent killer cells when compared to MPE T cells. This chal-lenging task might become feasible with T cell clones generated
in vitro from precursors collected in patients with TEN and MPE allergic to the same molecules.
A major finding of our study is the antigenic specificity of the highly expanded clones found in patients with TEN. We were able to demonstrate that some of our engineered transductants (produced from TEN-3 and TEN-7) responded to their putative culprit drugs in vitro. Potential drug reactivity was also recorded with transductants, generated from the rearranged pairs of TCR and TCR genes de-tected in the unusual dominant clone found in patient TEN-9, who was exposed to multiple drugs (Table 1). Nevertheless, as no clear culprit drug was identified for this patient, it was not possible to validate the relevance of our findings. In contrast, transductants generated from sequences identified in patients TEN-10 and TEN-15 failed to respond to the tested drugs (ceftriaxone, ciprofloxacin, levofloxacin, and metronidazole; Table 2). Various reasons might explain these TEN-10 and TEN-15 results. The simplest hypothesis is that we did not transfect the appropriate pathogenic TCR sequences. Alternatively, in keeping with the results obtained with TEN-3 trans-ductants, which confirmed that T cells from allopurinol-allergic
Table 2. Drug-induced activation of TCR Skw3 transductants. Skw3 cell lines engineered for the expression of TCRs bearing V and V chains from top
clones found in patients TEN-3, TEN-7, TEN-10, and TEN-15 were stimulated in vitro with EBV-transformed B cells in the presence of graded doses of different drugs or left unpulsed. This depicts the percentage of CD69 expression in CD3+ transductants measured by FACS after 24 hours of stimulation. Results from
control transductants generated from abacavir-allergic (17D), allopurinol-allergic (AnWe A1), or sulfamethoxazole-allergic (UNO H13) donors (7, 52, 54) are also shown. Bold and underlined values indicate >2 or >1.5 CD69 expression fold increase versus unpulsed cultures. Transductant IDs are from table S12. Autologous EBV-transformed B cells were used for all the patients, except for patient TEN-7, for whom we did not have any autologous PBMCs available; hence, we performed the same analysis with heterologous PBMCs from different healthy donors. Heterologous EBV-transformed B cells were also used to stimulate control transductants.
% of CD69 expression in CD3+ transfectants
Patient ID Skw3 transfectant ID Drug concentrations (g/ml) No drug Concentration 1 Concentration 2 Concentration 3
TEN-3 C1 Allopurinol (62.5/250) 2.3 2.2 3.05 Oxypurinol (62.5/250) 2.3 22.9 39.6 Sulfamethoxazole (100/200) 2.3 1.3 1.4 TEN-7 C2 Pantoprazole (10/50) 31.7 40.1 47.4 TEN-10 C3 Ceftriaxone (50/100/200) 12.2 11.9 12 13.8 Ciprofloxacin (12.5/25/50) 10.9 10.1 11.8 10.6 TEN-15 C4 Levofloxacin (25/50/100) 6 5.6 5.4 4.4 Metronidazole (25/50/100) 6.3 5.7 5.4 6 Control-1 17D Abacavir (1/10/20) 1.4 93.2 88.9 93.1 Pantoprazole (12.5/25/50) 1.4 1.8 1.8 1.7 Control-2 AnWe A1 Allopurinol (62.5/250) 4.3 17.1 26.4 Oxypurinol (62.5/250) 4.3 5 5.75
patients are reactive to its metabolite (oxypurinol) but not to the parent molecule (4), it is possible that our in vitro drug exposure conditions did not generate enough metabolites or drug-induced epitopes necessary to activate the transductants. Similarly, we can-not exclude that a specific mode of drug-epitope presentation, using peculiar nonconventional HLA presentation (42), or the involvement of an altered peptide repertoire (12, 13) governs T cell expansion from patient TEN-10 or TEN-15.
The identification of early biomarkers, which predict final severity, is a highly desirable goal to improve clinical management of patients with TEN. Our data confirm and extend the recent study reported by Xiong et al. (31), which compared TCR repertoire diversity in patients suffering from SJS or TEN and showed that TCR repertoire metrics correlate with disease severity. So far, it is still debated wheth-er SJS is an early stage of TEN (SJS is a bullous cADR charactwheth-erized by <10% of skin detachment) or a different pathology, both at the etiological and mechanistic levels. Here, we enrolled patients with progressing but established TEN phenotype only, with 40 to 100% of skin detachment at the peak of disease, except for patient TEN-2 who displayed an SJS/TEN intermediate phenotype with 20% of skin detachment. Despite extensive clonal expansion in TEN blisters at disease onset, we failed to detect any correlation between blister TCR repertoire diversity (or the percentage of top skin clones, R2 = 0.00003,
P = 0.9, and final skin severity; Fig. 6B). However, the same clones
were also highly expanded in blood of patients with TEN, and the degree of their expansion in blood at the early phases of the disease showed significant correlation with the final disease severity (Fig. 6, C to E), thus expanding the findings reported by Xiong et al. (31). This suggests that the progression and severity of the disease is di-rectly linked to the quantity of pathogenic clones that circulate in the blood and are able to be recruited in the epidermis a few hours/ days after. Hence, to track clonal expansions, or TCR repertoire di-versity, at disease onset could prove to be of paramount value for clinicians who want to anticipate the evolution of TEN and develop adequate care measures. However, because of the low number of pa-tients (n = 15) tested in our TCR repertoire study, it will be crucial to validate our results with an extended cohort. Besides, it will be important to understand why there is no correlation with TCR rep-ertoire metrics in the skin. The fact that we conducted this study on a prospective cohort with diverse HLA, reactive to different drugs of different half-lives and different pharmacological properties, suffer-ing from different degrees of liver/kidney dysfunction, transferred for intensive care at different intervals after symptom onset, and with-drawn with culprit drug at different times and treated with different molecules (Table 1) certainly explains the discrepancies between the extent of final skin detachment and clonal expansion in the blisters at the beginning of the disease. It will be therefore crucial to conduct future studies on a more controlled cohort to decipher the reasons for the strong blood but not skin correlation.
In conclusion, our results demonstrate that the quantity and quality of skin-recruited CTLs condition the clinical presentation of cADRs. They open major opportunities for the development of new prognostic markers in TEN.
MATERIALS AND METHODS
Study design
Patients were prospectively recruited by the drug allergy reference center at the Hospices Civils de Lyon (France) between 2014 and
2018. TEN or MPE diagnoses were based on the definition published by the RegiSCAR study group (43, 44). Only patients with a proba-ble or a definite diagnosis of TEN or MPE were enrolled in this study. Culprit drugs in patients with TEN were determined according to the algorithm for drug causality for epidermal necrolysis (ALDEN) (45). For patients with MPE, the main putative drug was also deter-mined. We collected demographic and clinical information, includ-ing sex and age, as well as underlyinclud-ing diseases (i.e., the disease that the culprit drug was prescribed for), comorbidities, duration of drug exposure before TEN/MPE onset, and HLA-A/B genotyping results. HLA-A/B genotypes were determined by reverse polymerase chain reaction sequence-specific oligonucleotide hybridization (LABType SSO, One Lambda, Eurobio-Ingen, Chilly-Mazarin, France). Addi-tional information were also collected for patients with TEN: SCORTEN (score of TEN) at diagnosis, which aims to predict the severity of the disease (46) and percentage of skin detachment as-sessed by the E-Burn smartphone application (Android Play Store, Saint Joseph Saint Luc Hospital, Lyon, France). The latter was de-termined when the patient was first diagnosed with TEN (“initial”) and when maximum involvement was observed (“final”). We enrolled 20 healthy donors as controls.
A local ethical committee approved the study, and written informed consent was obtained from each participant. Given the observation-al nature of the translationobservation-al study, there was no randomization or formal blinding process for the investigators.
Sample collection and processing
Skin samples
Skin samples for TEN consisted of blister fluids and, for three pa-tients, blister fluids and skin biopsies. Supernatant was collected, and cells were repeatedly washed in complete RPMI before subse-quent processing. In cases of MPE and patients TEN-15, TEN-17, and TEN-18, 6-mm2 biopsies were performed directly into lesional erythematous skin. Abdominal skin leftovers, from healthy donors undergoing elective plastic surgery, were used as control biopsies. Skin cells were extracted by mechanical dissociation and enzymatic digestion [2 hours at 37°C in RPMI supplemented with collagenase type 1 (1.25 U/ml; Sigma-Aldrich, Saint Quentin Fallavier, France), deoxyribonuclease (4 kU/ml; Sigma-Aldrich), and Hepes buffer (5%)], before being passed through a 100-m cell strainer (Thermo Fisher Scientific, Courtaboeuf, France) to obtain single-cell suspen-sions. Cell viability was determined by trypan blue exclusion.
Blood samples
PBMCs from healthy donors and patients were isolated from whole-blood samples (in lithium-heparin–coated tubes) using Ficoll Histo-paque (Ficoll-Paque PLUS, Thermo Fisher Scientific) density gradient centrifugation, and cell viability was assessed as described above. Details about sampling days for each patient and corresponding in-vestigations are listed in table S1. Depending on experiments, samples were either frozen in liquid nitrogen according to standard proce-dures or immediately stained for immunophenotyping analysis. Flow cytometry analysis
Flow cytometry was carried out using fluorescently labeled mono-clonal antibodies (mAbs), recognizing human CD3 (7D6; Thermo Fisher Scientific), CD4 (VIT4; Miltenyi Biotec, Bergisch Gladbach, Germany), and CD8 (SK1; BioLegend, San Diego, CA, USA) pro-teins. V chain repertoire expression was assessed using a kit of 24 TCRV mAbs (IOTest Beta Mark, Beckman Coulter, Roissy, France;
domains: TCRV 1, 2, 3, 4, 5.1, 5.2, 5.3, 7.1, 7.2, 8, 9, 11, 12, 13.1, 13.2, 13.6, 14, 16, 17, 18, 20, 21.3, 22, and 23), and viability discrim-ination was performed by incubating cells with live/dead eFluor 506 (eBioscience, San Diego, CA, USA).
Cells were analyzed on a LSRFortessa flow cytometer (BD Bio-sciences, Franklin Lakes, NJ, USA), and data were analyzed using FlowJo software (version 10; FlowJo, Ashland, OR, USA). For TCR sequencing experiments, some dominant CD8+ TCRV+ cells were sorted on a FACSAria IIu device (BD Biosciences).
Mass cytometry analysis
Mass cytometry antibodies were obtained as preconjugated metal- tagged antibodies from Fluidigm (South San Francisco, CA, USA) or generated in-house by conjugating unlabeled purified antibodies (from Miltenyi or Beckman Coulter) to isotope-loaded polymers using Maxpar X8 Multimetal Labeling Kit (Fluidigm). After titration on NanoDrop ND 1000 (Thermo Fisher Scientific), antibodies were diluted in antibody stabilization buffer (CANDOR Biosciences, Wangen im Allgäu, Germany) with 0.5% sodium azide (Sigma-Aldrich). A detailed list of the antibodies used in this study is provided in the Supplementary Materials (table S2). Cell identification was performed using an iridium intercalator (Fluidigm), and viability discrimination was assessed by staining cells with Cisplatin (194Pt, Fluidigm). In some experiments, cells were fixed and permeabilized using Cytofix/ Cytoperm solution (Cytofix/Cytoperm, BD Biosciences, Le Pont-de- Claix, France) and then stained with human anti-granulysin, anti– granzyme A, anti–granzyme B, and anti-perforin mAbs.
Before acquisition on Helios mass cytometer (Fluidigm), cells were resuspended in half-diluted Four Element Calibration Beads (Fluidigm), and the dataset was normalized with CyTOF software using Finck algorithm (47). Flow Cytometry Standard 3.0 files were imported into FlowJo software version 10, and analyses included standard gating to remove beads, aggregates, or dead cells and fur-ther identify main leukocyte subsets (fig. S1).
High-dimensional mass cytometry data analysis
An inverse hyperbolic sine transformation was applied to analyze TCR+ CD8+ T cells [n = 300 per sample; all CyTOF samples were used (table S1), except skin samples from MPE-9 and MPE-12, which were excluded from the analysis because of very low CD8+ T cell number, and TEN-18 samples because of technical problem]. Data were next clustered using FlowSOM algorithm (with FlowSOM R plugin downloaded for FlowJo version 10) (48). A SOM was first trained to gather all cells into 100 distinct nodes based on their sim-ilarities in high-dimensional space (i.e., considering the relative MFI of 16 markers simultaneously: CCR7, CD45RA, CD27, CD38, CD56, CD57, CD107a, CD137, CD226, CD253, CD255, granzyme A, gran-zyme B, granulysin, perforin, and annexin A1 and excluding cell lineage (CD45, CD14, CD19, TCR, TCR, CD8, CD8, CD4, CD38, CD56, NKP46, CD11b, CD11c, TCRV14-J18, and TCRV7.2). SOM nodes were subsequently grouped in different clusters (each representing different CD8+ T cell subsets) using K-parameter and/ or K-Finder R package (https://arxiv.org/pdf/1811.07356.pdf; based on the Tracy-Widom algorithm to approximate “K” in sparse data matrices, K being the number of relevant clusters in a population) (49). FlowSOM clusters were visualized as integrated (i.e., including all samples) or disease phenotype minimal spanning trees, and heatmaps showing the integrated or individual MFI of each marker
chical metaclusterings were performed, using the gplots R package based on the Euclidean distance and Ward linkage (50), to determine the immunophenotype or the frequency of each cluster per samples. DNA isolation and HTS of TCR/ CD3R regions
DNA was isolated from frozen total blister, skin, and PBMC sam-ples using the QIAamp DNA Micro Kit (QIAGEN, Courtaboeuf, France), according to the manufacturer’s instructions. Then, TCR and TCR CDR3 regions were amplified and sequenced using immunoSEQ assay (Adaptive Biotechnologies, Seattle, WA, USA). Briefly, bias-controlled V and J gene primers were used to amplify rearranged V(D)J segments spanning each unique CDR3/, and amplicons were next sequenced (at approximately 20× coverage) using the Illumina HiSeq platform. The assay was performed at sur-vey level (detection sensitivity, 1 cell in 40,000). After correcting se-quencing errors via a clustering algorithm, TCR/ V, D, and J genes were annotated according to the ImMunoGeneTics information sys-tem (IMGT, www.imgt.org).
Sequencing data were analyzed according to the immunoSEQ Analyzer version 3.0 (www.immunoseq.com). Diverse TCR reper-toire metrics were explored: frequency and overlap of highly expanded clones; respective nucleotide or amino acid CDR3 sequences; usage and pairing of TCRB/AV, TCRBD, and TCRB/AJ families; or diver-sity of the TCR repertoire (clonality index based on Shannon’s entropy). Transduction of the V and V chains of the TCR into Skw3 cell lines
Skw3 cell lines (Leibniz Institute DSMZ, Brunswick, Germany) (51) were transduced as described previously (52). Briefly, rearranged human variable TCR and TCR genes identified by TCR sequenc-ing were synthesized by custom gene synthesis (Gene Universal, Newark, DE, USA) and cloned into retroviral pMSCV vector (Takara Bio USA Inc., Mountain View, CA, USA) containing puromycin and neomycin resistance genes, respectively. The resulting retrovi-ruses were used to transduce the TCR-defective Skw3 cell line, which also expresses the human CD8 co-receptor. The TCR-transduced cells outgrowing in selective medium were picked, and the expres-sion of the correct TCR and TCR was further assessed by flow cytometry, using a FACSCanto I device (BD Biosciences, San Jose, CA, USA). The transduced cells with stable TCR expression were selected for assessment of reactivity and specificity, which was measured by TCR-induced CD69 expression.
TCR-transductant stimulation assay
Skw3 cell lines expressing the cognate TCR and TCR chains were cocultured with autologous EBV-transformed B-lymphoblastoid cell lines (53) at 1:2 ratio at 37°C. Tested drugs were added to the cocul-tures with the indicated concentrations. After 24 hours, cells were stained with anti-human CD3 (BioLegend) and anti-human CD69 (BioLegend) and analyzed by flow cytometry. Levels of CD69 ex-pression was monitored in 10,000 CD3+ events. Experiments were
repeated at least two times. Statistical analysis
P values were calculated with two-tailed independent Student’s t tests
or one-way analysis of variance (ANOVA) using GraphPad Prism software (version 8; San Diego, CA, USA). P values <0.05 were con-sidered significant.