HAL Id: hal-03043701
https://hal.archives-ouvertes.fr/hal-03043701
Submitted on 7 Dec 2020HAL is a multi-disciplinary open access archive for the deposit and dissemination of sci-entific research documents, whether they are pub-lished or not. The documents may come from teaching and research institutions in France or abroad, or from public or private research centers.
L’archive ouverte pluridisciplinaire HAL, est destinée au dépôt et à la diffusion de documents scientifiques de niveau recherche, publiés ou non, émanant des établissements d’enseignement et de recherche français ou étrangers, des laboratoires publics ou privés.
Impact of growth velocity on grain structure formation
during directional solidification of a refined
Al-20wt.%Cu alloy
H. Soltani, G. Reinhart, M.C. Benoudia, F. Ngomesse, M. Zahzouh, H.
Nguyen-Thi
To cite this version:
H. Soltani, G. Reinhart, M.C. Benoudia, F. Ngomesse, M. Zahzouh, et al.. Impact of growth velocity on grain structure formation during directional solidification of a refined Al-20wt.%Cu alloy. Journal of Crystal Growth, Elsevier, 2020, 548, pp.125819. �10.1016/j.jcrysgro.2020.125819�. �hal-03043701�
1
Impact of growth velocity on grain structure formation during directional solidification
of a refined Al-20wt.%Cu alloy
H. Soltania,b, G. Reinharta,*, M. C. Benoudiac, F. Ngomessea, M. Zahzouhb, H. Nguyen-Thia
a Aix Marseille Univ, Université de Toulon, CNRS, IM2NP, Marseille, France b Badji Mokhtar University, LMGM, BP 12, 23000, Annaba, Algeria
c Ecole Nationale Supérieure des Mines et de la Métallurgie, L3M, Annaba, Algeria
Abstract
The paper presents detailed analyses of solidification experiments performed on a refined Al-20wt.%Cu alloy using the SFINX (Solidification Furnace with IN situ X-radiography) laboratory facility. Directional solidifications of a sheet-like sample were carried out in a horizontal configuration, with the main surface of the sample parallel to the ground. The sample was solidified for a wide range of cooling rates to obtain various grain structures, from columnar to elongated and equiaxed. The formation of the grain structure was observed in-situ and in real-time by X-radiography, which allows the dynamic of solidification phenomena to be thoroughly analyzed. Based on the radiographs, quantitative measurements were performed to
* Corresponding author at Aix-Marseille University and IM2NP Case 142, Campus St-Jerome, 13397 Marseille
2
accurately describe the solidified grain structure, namely the nucleation position, nucleation rate, grain size, grain elongation factor and growth orientation. The experiments showed that increasing the growth velocity leads to a decrease of both the grain size and grain elongation factor, resulting in a more homogeneous and isotropic grain distribution. The grain characteristic parameters were also sensitive to variations of the temperature gradient in the Field-of-View. The results were discussed by analyzing the impact of the solidification parameters on the constitutionally undercooled liquid zone ahead of the solidification front.
Keywords: A1. Characterization, A1. Dendrites, A1. Directional solidification, A1. Nucleation,
3
1. Introduction
In aluminum or steel industries, equiaxed grains are frequently preferred for many reasons, including improved and more uniform physical properties and benefits in subsequent processing. The mechanical properties of the final products are highly influenced by the size and morphology of the grain structure built in the solid [1]. For this reason, numerous studies have been undertaken to better understand the relationships between grain characteristics and solidification parameters (alloy composition, temperature gradient and growth velocity or cooling rate). The formation of dendritic grains from the melt is complex to analyze and to model due to the great number of dynamical phenomena (nucleation, diffusion, grain interaction, fluid flow, buoyancy forces …) that are simultaneously active and interact, and whose length and time scales are widespread over several order of magnitude. J.D. Hunt historically introduced a criterion to predict when fully equiaxed structures would occur as a function of the growth velocity and the temperature gradient in castings [2]. This approach was later extended to consider solutal interactions between grains by Wang and Beckermann [3] using the concept of grain envelope introduced by Rappaz and Thévoz [4]. The Interdependence Theory was developed by StJohn et al. [5] to capture the impact of the constitutional undercooling in the liquid on the grain refiner efficiency and final grain size. Most of these models tackled the case of grain nucleation and growth in isothermal melt, although this condition is generally very difficult to achieve experimentally [6].
4
specifically to the analyze of the equiaxed grain structure formation in a temperature gradient, although it is the most frequent case in real conditions. Grain refinement of directionally solidified Al–4.15wt.%Mg was studied at various pulling velocity by Vandyoussefi and Greer [7] who reported experimental observations of elongated grains by post-mortem analyses. A systematic study of the impact of cooling rate and temperature gradient on the final grain size was recently performed by Xu et al. [8] by means of X-radiography during horizontal directional solidification of refined Al-20wt.%Cu alloys. Y. Jia et al. also used X-radiography to investigate the downward solidification of Al-15wt.%Cu alloys [9] and highlight the impact of a solute suppressed nucleation zone on the grain nucleation. Upward directional solidifications of refined Al-20wt.%Cu alloys aboard parabolic flights have been performed by Abou-Khalil et al. [10], who reported explosive grain nucleation in the constitutionally undercooled zone following a sudden increase of the gravity level. Few studies have reported systematic measurements of the evolution of the grain shape and morphology [11–13]. These are however crucial parameters needed as criteria in numerical simulations to determine the position of the Columnar-to-Equiaxed Transition in ingot casting [2,14].
One major experimental challenge in solidification studies is the real-time and in-situ observation of the solid phase development, especially for metal alloys that are opaque to visible light. Recently, analog transparent organic materials have been successfully used to study grain growth and grain motion during solidification [15,16], but the behavior of such materials is not completely identical to metal systems due to their low thermal conductivity.
5
Alternatively, X-ray imaging has been established as a method of choice for unveiling the dynamical evolution of the microstructure formation in solidification processing of metallic alloys. There now exists a significant body of works on the study of metal alloys solidification using X-ray imaging at synchrotron sources [17] like X-radiography [18], tomography [19] or Bragg diffraction imaging (also referred as X-ray topography) [20]. Among all those imaging techniques, X-radiography is the most widely used because it is the simplest one to implement, although it only provides a two-dimensional projected image. X-radiography is also highly attractive when information on the solidification microstructure and the composition variations in the liquid phase can be retrieved from the images [21,22].
In the last decade, new opportunities arose with the improvement of compact micro-focus sources and X-ray sensitive detectors. Such devices enable in-situ and time-resolved radiography to be used for the study of aluminum solidification in laboratories with sufficient time and spatial resolutions to distinguish the microstructure features [23], different orientations of the sample with respect to gravity [24], and being compatible with microgravity platforms [25]. Most studies of aluminum alloy solidification using such laboratory devices have been dedicated to the investigation of columnar growth in non-refined alloys [26,27], or equiaxed growth in nearly isothermal conditions in refined materials [28,29].
In this paper, we present a thorough and systematic analysis of the influence of the cooling rate (i.e. growth velocity) on the grain structure formation and the final grain structure during horizontal directional solidification of a refined Al-20wt.%Cu alloy. Quantitative analyses of
6
the nucleation rate, final grain size, grain elongation and growth orientation have been performed based on the in-situ visualization of the solidification front propagation. These data were used to highlight the impact of the growth velocity on the grain structure formation. The observed trends were discussed by analyzing the impact of the solidification parameters on the constitutionally undercooled liquid zone in front of the the solidification front.
2. Experimental procedure
2.1. Solidification experiments
Experiments were carried out in the SFINX (Solidification Furnace with IN situ X-radiography) laboratory device. This device is dedicated to the solidification of aluminum-based alloy with in-situ and real-time observation by X-radiography. It is a duplicate of the devices used during the MASER-12 sounding rocket mission [26] and parabolic flight campaigns [10]. These facilities were developed within the framework of the ESA (European Space Agency) – MAP (Microgravity Application Promotion) named XRMON (In-situ X-ray monitoring of advanced metallurgical processes under microgravity and terrestrial conditions).
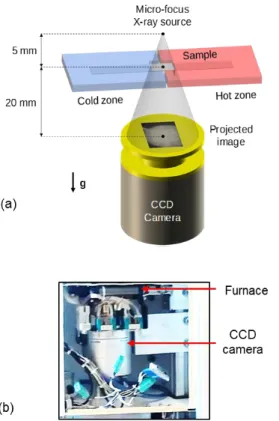
The SFINX furnace (Fig. 1) is composed of two identical heaters, with a square hole of 5 mm 5 mm in the adiabatic gap defining the Field-of-View (FoV) and allowing the X-rays to pass through the sample with a minimum of attenuation. A detailed description of the furnace design can be found in [26]. This furnace enables to perform directional solidification of aluminum-based samples with applied temperature gradients within the range of 2.5 to 15
7
K/mm and cooling rates R within the range of 0.01 to 1.5 K/s.
Fig. 1: (a) Sketch of the SFINX furnace and X-radiography system for horizontal solidification experiments. (b) Picture of a part of the SFINX facility showing the furnace and the detector.
In the present study, an Al-20wt.%Cu alloy refined with 0.1wt.%Al-Ti-B has been prepared for in-situ X-radiography experiments. The sample has a sheet-like geometry, with a thickness of about 200 µm and a main rectangular surface of 50 mm 5 mm. The sample was placed in the middle of stainless-steel spacers sandwiched between two flexible glassy carbon sheets sewn together with a silica thread [25]. The crucible is encased inside the furnace, having a direct contact with both heaters to achieve a temperature gradient along the sample. The two heaters are regulated by two K-type thermocouples that are positioned 13.5 mm apart from each other. The hot and cold heater were set to a temperature of 988 K and 838 K respectively fully
8
melt the alloy sample. From these temperature values and the distance between the thermocouples, we defined an applied temperature gradient Gapp. In the present paper, a
constant applied temperature gradient Gapp = 11.1 K/mm was imposed for all experiments. It is
worth noticing that the actual temperature gradient inside the sample was different from the applied temperature gradient, as will be discussed later in section 4.2.
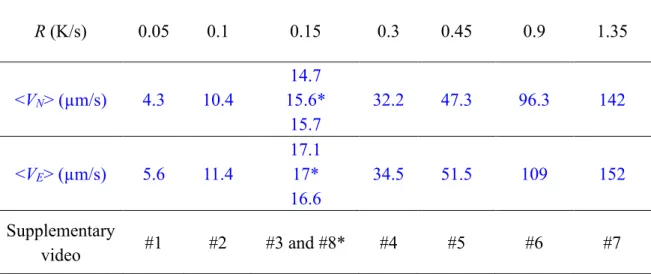
The sample was solidified using the power-down method, which consists of applying the same cooling rate R on both furnace heaters, keeping constant the applied temperature gradient Gapp during the solidification phase. A series of nine experiments was carried out on the same sample, which was solidified and remelted several times, with seven different cooling rates (Table 1 and Supplementary Videos 1 to 7) to obtain grain shapes ranging from fully columnar to equiaxed. A typical homogenization time of 15 minutes was applied before starting a new solidification phase. This short homogenization period was long enough to achieve a melt with a homogeneous composition (i.e. uniform gray level), but also short enough to avoid a strong deformation of the sample in this horizontal position.
To ensure the repeatability of the experiments, the cooling rate R = 0.15 K/s was repeated three times: as the first, the fifth and the last solidification experiment. The comparison between those experiments did not show marked differences in terms of grain size, elongation factor and growth orientation.
9 Solidification parameters R (K/s) 0.05 0.1 0.15 0.3 0.45 0.9 1.35 <VN> (µm/s) 4.3 10.4 14.7 15.6* 15.7 32.2 47.3 96.3 142 <VE> (µm/s) 5.6 11.4 17.1 17* 16.6 34.5 51.5 109 152 Supplementary video #1 #2 #3 and #8* #4 #5 #6 #7
Table 1. Cooling rates and corresponding average nucleation front velocities <VN> and average
eutectic front velocities <VE> of the directional solidification experiments carried out on a
refined Al-20wt.%Cu sample. Applied temperature gradient Gapp = 11.1 K/mm. The
corresponding supplementary videos are also indicated. Video #3 and #8 corresponds to the experiment with an average nucleation front velocity of <VN> = 15.6 µm/s.
The X-radiography system included a micro-focus X-ray source with a molybdenum target (3 μm focal spot) that provided a photon flux with two peaks of energy at 17.4 keV and 19.6 keV. The camera system incorporated a digital camera that is adapted for X-ray usage by the integration of a thick optical fiber plate that protects the sensor from radiation. A scintillator plate placed in front of the optical fiber converted X-ray radiation to visible spectrum light. Due to the X-ray beam divergence, a geometric magnification of the object was observed at the detector position, which is the ratio of the source-detector by source-sample distances (Fig.1a). In this work a magnification of 5 was used. The effective pixel size was 4 μm 4 μm and the acquisition rate was set to 2 frames per second.
10
raw images. The grey level variations in the raw images were related to the attenuation coefficient of each different parts of the sample. Image legibility was enhanced by applying “flat-field” processing, which consists in dividing each frame by a reference image recorded just before the cooling was triggered. This procedure reduced the noise and the defects linked to the detector and crucible [21]. In the processed images, the bright regions corresponded to Al-grains whereas the dark regions were the Cu-rich liquid regions.
2.2. Grain structure characterization
It is well known that mechanical properties of materials are strongly related to the grain characteristics, namely the average grain size [30–32] and the grain morphology. The determination of the relationship between grain structure characteristics and solidification parameters is crucial to tailor the final materials properties. Based on the X-ray images recorded during the solidification process, we were able to determine the distributions of the grain size, the grain elongation and the growth orientation with respect to the temperature gradient by using a semi-automatic macro script implemented in the ImageJ software [33]. This macro required firstly the manual contouring of all grains, which could be performed unambiguously using the in-situ and real-time observation by X-radiography. Although tedious to perform manually, the grain contouring step allowed the accurate determination of the grain boundaries in spite of the blurring effect due to coarsening [34] or Temperature Gradient Zone Melting (TGZM) [35]. Then, the implemented macro script automatically determined the grain size,
11 elongation factor and growth orientation:
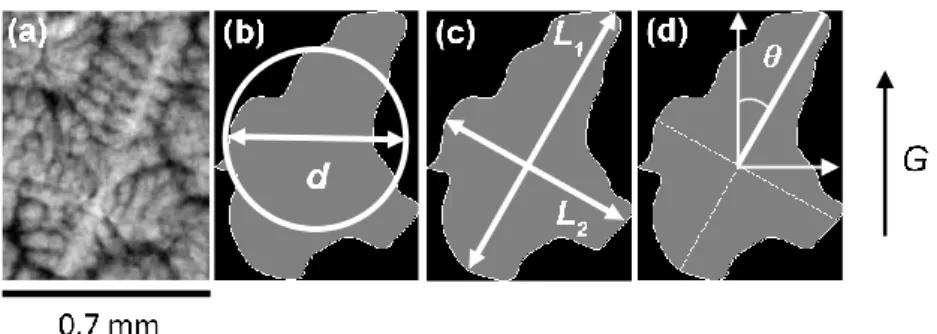
• The grain surface area was easily retrievable since it was given by the ImageJ software in pixels and then converted into µm2. Then, the distribution of the diameter d of the
equivalent disk (white circle in Fig. 2b) was deduced. Let us recall that equivalent disk means the disk with the same surface area as the grain. The grain size is a very important parameter, but it gives no information about the grain morphology and must be completed by other measurements.
• The grain elongation factor ϕ was defined as ϕ = L1/L2, the ratio between the length L1
of the main axis of the grain (the longest axis contained exclusively in the grains) and the length L2 of the second axis of the grain (the longest axis perpendicular to the main
axis and included in the grain) as shown in Fig. 2c. Both L1 and L2 were automatically
obtained by using a macro in ImageJ. With this definition, the elongation factor varies in our paper from unity (for a fully equiaxed grain) to larger values (up to ten) for elongated grains. Care must be taken that this definition is the inverse of the one used by Biscuola and Martorano [36] in their paper discussing the position of the CET depending on the grain shapes in numerical simulations of directional solidification. • The growth orientation of each grain was characterized by , the angle between the main
axis of the grain (the longest axis contained exclusively in the grains) and the temperature gradient direction (Fig. 2d). This third parameter is important to assess the impact of the temperature gradient on the growth direction. For equiaxed growth, a wide
12 distribution with a zero average value is expected.
Fig. 2: (a) Radiograph of an isolated grain; (b) the diameter d of the equivalent disk of the manually contoured grain; (c) the main axis of length L1 and second axis of length L2 of the
grain; (d) the tilt angle θ of the grain main axis with respect to the temperature gradient G.
3. Results
3.1. Solidification front propagation
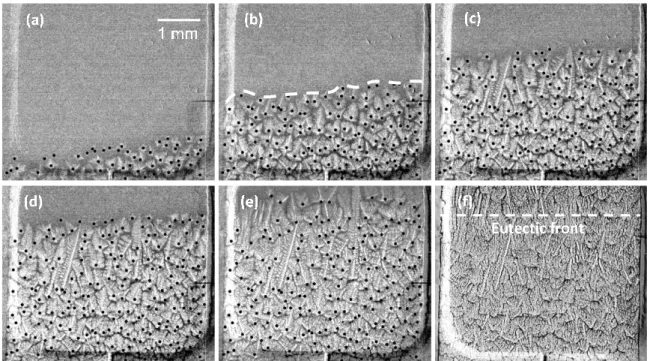
The solidification experiments started with a fully melted sample. The application of the same cooling rates on both heaters lead to the formation of grains in the cold zone of the furnace as illustrated in Fig. 3a for a cooling rate R = 0.3 K/s. The solidification front was observed passing through the FoV (Supplementary Video 8), in a similar way to the in-situ observations reported by Nguyen-Thi et al. [37] for the upward directional solidification of refined Al-3.5wt% Ni alloys, by Prasad et al. [38] for the growth of refined Al-Si alloys, or by Xu et al. [8] and Jia
et al. [9] both for refined Al-Cu alloys. After nucleation, the grains formed a compact microstructure for which it was possible to define an effective front that separated the upper limit of the developing grain structure and the liquid phase (dashed white line in Fig. 3b). This
13
effective front was slightly tilted, which suggested the presence of a weak transversal temperature gradient from the right to the left side of the sample, or an inhomogeneity of the initial concentration field in the liquid. As the cooling of the sample continued, new layers of grains nucleated in the liquid zone ahead of the effective front. The new grains blocked the progression of the grains at the top of the effective front and were eventually incorporated into the latter. This mechanism was repeated over time, which lead to the propagation of the effective front through the FoV (Fig. 3e). No grain sedimentation was observed since the experiments were performed in a horizontal configuration. However, some grains in the upper part of the mushy zone were observed to drift slowly towards the cold zone. This behavior was attributed to shrinkage-induced flow that can transport the grains when buoyancy effects are minimized as reported by Salloum-Abou-Jaoude et al. [39] and Murphy et al. [40]. The remaining intra- and inter-dendritic liquid areas solidified at a later stage, with the propagation of a eutectic front from the bottom to the top of the FoV (dashed white line in Fig. 3f and darker region visible after 20 seconds in Supplementary Video 8). It is worth noting that the solid-liquid interface of the eutectic front was visible as an almost flat horizontal line, indicating that the thermal field in the FoV at the end of solidification consisted of nearly flat isotherms.
14
Fig. 3: Sequence of radiographs showing the solidification front propagation of a refined Al-20wt.% Cu solidified with R = 0.3 K/s (<VN> = 32.2 µm/s) and Gapp = 11.1 K/mm. (a) t = 68s;
(b) t = 104s; (c) t = 137s; (d) t = 155s; (e) t = 186s and (f) t = 349s. The black dots indicate the nucleation positions, when the grains are visible for the first time in the radiographs.
The position of each grain in the FoV was marked manually as soon as they became visible (diameter ≥ 10-20 µm) (black dots in fig. 3 and Supplementary Video 8). This position,
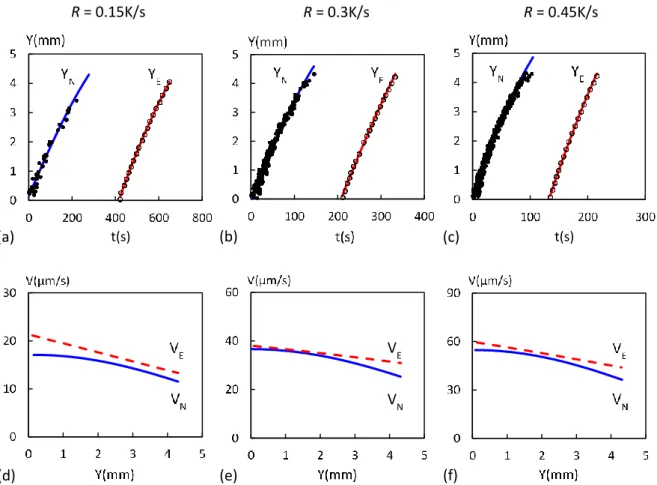
subsequently referred as the nucleation position, and its corresponding time were recorded to further characterize the effective front propagation. This manual detection was possible for experiments #1 to #5. For experiments #6 and #7 with high cooling rates (R = 0.9 K/s and R = 1.35 K/s) the time resolution did not allow us to accurately mark the grain nucleation position. Consequently, a line was drawn above the effective front to determine its position with time. The positions of the nucleation events are plotted as a function of time for three cooling rates (0.15 K/s, 0.3 K/s and 0.45 K/s) in Fig. 4a (black dots) with the Y-axis parallel to and oriented
15
in the same direction as the temperature gradient direction. The position of the eutectic front in the FoV is also reported as a function of time (black circles). The variations of both nucleation front and eutectic front positions are not perfectly linear, in particular at the top of the FoV.The plots were fitted using an arctangent function (blue line for the nucleation front and red line for the eutectic front), as it is a function that is representative of the thermal profile of Bridgman furnaces. The nucleation front velocity VN and the eutectic front velocity VE in the FoV were directly deduced from the fits and are shown in Fig.4b. Both velocities decreased progressively in the FoV for each experiment, which indicates a variation of the solidification conditions that could be attributed to a variation of the temperature gradient as explained in section 4.2. Interestingly, the growth velocity of the eutectic front was always slightly higher than the growth velocity of the nucleation front. This is due to the higher solid fraction of the mushy zone when the eutectic front solidifies. A high solid fraction induces a smaller temperature gradient due the higher thermal conductivity of the solid phase with respect to the liquid phase. Therefore, a faster growth velocity is expected assuming that the cooling rate R = G.V is constant in the sample. The average growth velocities of the nucleation front <VN> and of the eutectic front <VE> were then deduced from these graphs and are reported in Table 1. Hereafter, the average growth velocity of the nucleation front <VN> will be used to compare the different
16
Fig. 4: (a) to (c) Graphs showing the nucleation front and eutectic front positions as a function of time for cooling rates R = 0.15 K/s, 0.3 K/s and 0.45 K/s, respectively. (d) to (f) Graphs showing the nucleation front and eutectic front velocity in the FoV for cooling rates R = 0.15 K/s, 0.3 K/s and 0.45 K/s, respectively. The applied temperature gradient value is Gapp = 11.1 K/mm.
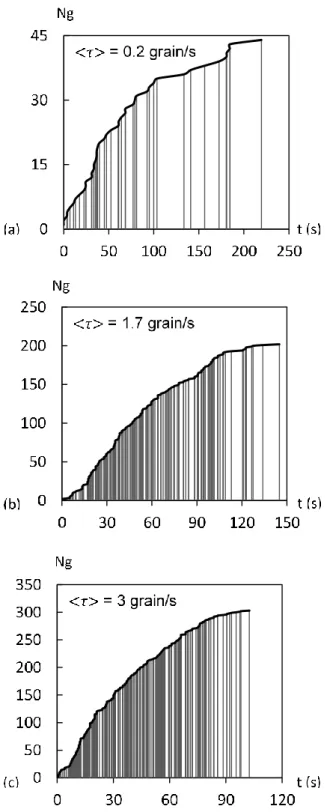
The determination of the position of the nucleation events as a function of time also allowed the evolution of the cumulative grain number Ng to be determined. Ng was defined as the number
of grains in the FoV as a function of time. The average nucleation rate < > was calculated from the slope of the curve. Fig. 5 depicts the variations of Ng for three intermediate growth
velocities, with vertical lines indicating the occurrence of a nucleation event. Firstly, these curves emphasized the fact that nucleation did not occur in a continuous manner but in a
wave-t(s) (a) (b) (c) (d) VN VE t(s) (e) (f) R = 0.15K/s R = 0.3K/s R = 0.45K/s
17
like type as reported by many authors [8,9,37,38,41] and in agreement with predictions of the interdependence theory [5]. Indeed, one can see that the nucleation phases (vertical lines) were separated by no-nucleation periods during which only grain growth occurred. The time length of the no-nucleation periods decreased as growth velocity increased, yielding to a significant increase of the nucleation rate (from 0.2 grains/s to 3 grains/s) and then an increase in the final number of grains, as can be seen in Fig. 5. Another feature is that the nucleation rate is lower in the top part than in the bottom part of the FoV, which indicates a variation of the solidification conditions as already mentioned. The variation of the nucleation rate in the FoV could be attributed to the variation of the temperature gradient as explained in section 4.2.
18
Fig. 5: Graphs showing the variation of the cumulative number of grains in the experiments carried out with an applied temperature gradient Gapp = 11.1 K/mm and for increasing growth
19
3.2. Analysis of the grain final characteristics for an experiment at intermediate velocity
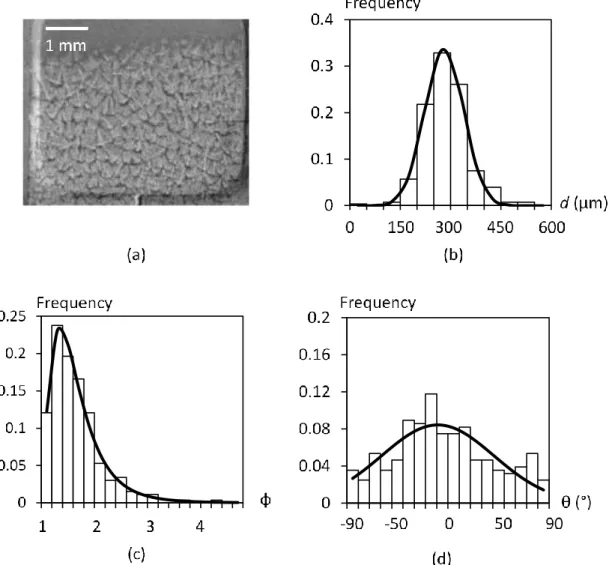
The grain characteristics (diameter, elongation factor and growth orientation) are depicted in Fig.6, for an experiment carried out with an intermediate nucleation front velocity <VN> = 47.3 µm/s. This experiment is the most interesting to analyze, as the grain structure (Fig.6a) exhibits a combination of both elongated and equiaxed grains.
The distribution of the grain diameter was of gaussian-type (Fig.6b), meaning that an average grain size given by the maximum of the distribution dmax 280 µm was selected. The
diameter dispersion 70 µm was related to the nucleation undercooling distribution that depend on the refiner size, which will be discussed in more details in section 4.1, as well as interactions with close neighboring grains. For this intermediate experiment at <VN> = 47.3 µm/s, the elongation factor distribution was well fitted by a log-normal curve, which pointed out an asymmetry of this parameter (Fig.6c). Most grains had an elongation factor ranging from unity (fully equiaxed grains) to two (short elongated grains), while a minority of grains had an elongation factor larger than two. This type of grain structure with ϕ lower than 2 could be considered as “equiaxed” according to Hunt’s criterion [2], although it was formed in a temperature gradient.
Finally, the growth orientation distribution was described by a wide gaussian curve, with a maximum value around 0° like for columnar growth although the growth was of equiaxed type (Fig.6d). This means that grain growth still occurred in average in the same direction as the temperature gradient. In fact, the dendrite arms that grew perpendicular to the temperature
20
gradient rapidly impinged with the dendrite arms of neighboring grains that nucleated roughly at the same time and at the same level in the sample. The same impingement was observed for dendrite arms that grew anti-parallel to the temperature gradient, toward the grain layer that had nucleated just before [42]. Accordingly, only the dendrite arms that grew in the direction of the temperature gradient could develop until a new layer of grains nucleated.
Fig. 6: Directional solidification of a refined Al-20wt%Cu alloy carried out at <VN> = 47.3 µm/s with an applied temperature gradient Gapp = 11.1 K/mm. (a) Radiograph showing the grain
structure; (b) distribution of the grain diameter; (c) distribution of the elongation factor; (d) distribution of the growth orientation.
21
3.3. Evolution the final grain structure with the solidification velocity
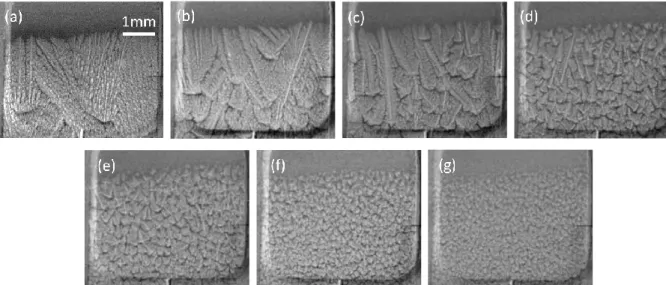
The impact of increasing solidification velocities on the final grain structure is illustrated in Fig. 7, showing the grain structures of all experiments when the solidification front reached the top of the FoV. For the lowest solidification velocity (<VN> = 4.3 µm/s) the microstructure
was fully columnar despite the addition of Al-Ti-B refiners, so that this experiment will not be considered in the scope of this paper. For <VN> = 10.4 µm/s and <VN> = 15.6 µm/s, the
microstructure was composed of a few large and long columnar grains that developed and crossed in rare cases the whole FoV (Fig. 7a and Fig. 7b). Such long columnar grains crossing through the other grains were also observed during the solidification of Al-7wt%Si in cylindrical samples under microgravity conditions on board of the ISS (International Space Station) [43]. This behavior was attributed to the better alignment of the columnar dendrite axis with the temperature gradient, that favored its development with respect to the less well oriented equiaxed grains. An important coarsening of the dendritic structures was also observed (readers are encouraged to see Supplementary Videos), mainly due to TGZM (Temperature Gradient Zone Melting). TGZM causes the motion of liquid inclusions toward the hot part of the sample, through the solid [35,42,44]. The migration velocity of the liquid inclusions is given by the relation:
𝑉𝑚𝑖𝑔 = −𝐺𝑑.𝐷𝐿
22
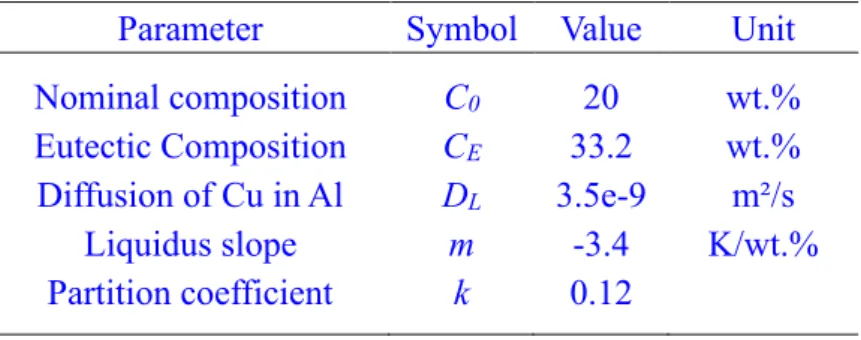
With Gd the temperature gradient in the liquid inclusion, DL the solute diffusivity in the liquid, m the liquidus slope, k the partition coefficient and CL the average composition of the liquid inclusion. Values for these parameters are listed in Table 2. For the discussed experiment, the TGZM migration velocity is between 0.4 and 0.6 µm/s, by taking Gd = Gapp and CL = C0 or CL = CE, respectively. For experiments lasting of few minutes, the typical distance travelled by the liquid inclusions is thus about 100 µm. This value is of the same order of magnitude as the secondary dendrite arm spacing, indicating that TGZM can bring significant changes to the dendritic grain morphology before solidification of the eutectic.
Parameter Symbol Value Unit
Nominal composition C0 20 wt.%
Eutectic Composition CE 33.2 wt.%
Diffusion of Cu in Al DL 3.5e-9 m²/s
Liquidus slope m -3.4 K/wt.%
Partition coefficient k 0.12
Table 2. List of physical parameters
The higher the solidification velocity, the higher the number of grains. Consequently, the grains became smaller and smaller, and concomitantly the grain shape gradually changed from elongated (Fig. 7c, Fig. 7d and Fig. 7e) to almost equiaxed (Fig. 7f and Fig. 7g).
23
Fig. 7: Radiographs showing the almost final grain structure during directional solidification of a refined Al-20wt%Cu alloy in an applied temperature gradient Gapp = 11.1 K/mm with
increasing growth velocity: (a) <VN> = 4.3 µm/s; (b) <VN> = 10.4 µm/s; (c) <VN> = 15.6 µm/s; (d) <VN> = 32.2 µm/s; (e) <VN> = 47.3 µm/s; (f) <VN> = 96.3 µm/s; (g) <VN> = 142.4 µm/s.
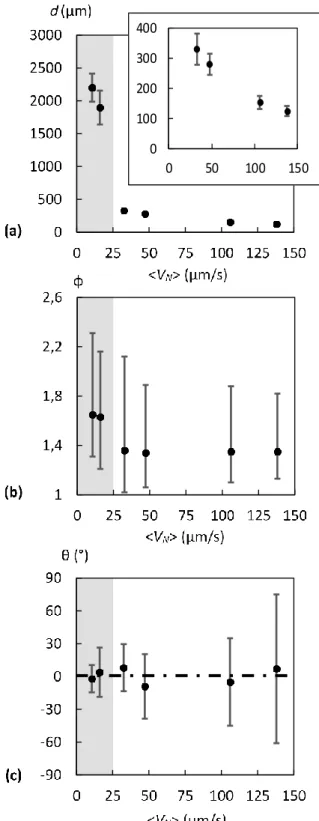
The grain characteristics (diameter, elongation factor and growth orientation) were determined quantitatively for all experiments having a non-fully columnar grain structure by the “manual contouring” procedure explained in section 2.2, and the results are summarized in Fig. 8. For <VN> = 10.4 µm/s and <VN> = 15.6 µm/s, the characteristic parameters of the
columnar grains that are longer than the FoV could not be determined and their contribution was thus not included in the measurements (grey areas in Fig. 8).
Fig.8a illustrates the variation of the grain diameter as a function of growth velocity. The grain diameter values were obtained from the fitted gaussian distribution and the error bars (i.e. diameter dispersion) deduced from the width at half maximum of the same gaussian curves. The data corresponding to the highest velocities are also reported in the insert in Fig.8a to better distinguish the error bars.
24
The grain diameter firstly decreased rapidly for low solidification velocities, from d = 2 200 µm and d = 1800 µm for <VN> = 10.4 µm/s and <VN> = 15.6 µm/s respectively to 400 µm for <VN> = 32.2 µm/s. The wide error bars for the two lowest velocities are the signs of the coexistence of long and short grains. For the four highest velocities (close-up in Fig.8a), the grain size slowly diminished towards an asymptotic value (about 140 µm). Concomitantly, the dispersion decreased significantly, indicating that the grain structure became more and more homogenous in size, as also visible in Fig.7.
Fig.8b gives the variation of the elongation factor as the growth velocity increases. The bottom error bars correspond to left-hand side width and right-hand side width at half maximum of the log-normal curves. This convention was chosen as it directly shows the asymmetry of the distribution in the plot of the elongation factor evolution. Fig.8b depicts that the grain elongation factor also decreased with the increase of the solidification velocity, with the grains becoming less and less elongated (Fig. 8b). The elongation factor value decreased towards an asymptotic value close to 1.3 with almost equiaxed grains (with elongation factors close to 1) and short elongated grains (with elongation factors up to 2). Interestingly, even for the highest velocity, the elongation factor never reached the value of unity, which means that a weak influence of the temperature gradient remained in the experiment.
Finally, Fig.8c shows the variation of the angle between the grain main axis and the temperature gradient for increasing growth velocities. The error bars correspond to the width at half maximum of the same gaussian curves. It can be noted that the average growth orientation
25
maximum was always close to 0°, due to the grain interaction with neighboring grains as explained in section 3.2. In addition, the interesting issue here is the size of the error bars, which became increasingly wide for high solidification velocity. For the two highest growth velocities, the angle distributions were almost flat, because the grains are more and more randomly oriented. This result agrees with the formation of equiaxed structures, whose development is independent of the temperature gradient orientation.
26
Fig. 8: Variation as a function of growth velocity of: (a) The average grain diameter; (b) The elongation factor; (c) The angle between the grain principal axis and the temperature gradient (grain orientation). For the two lowest growth velocity (grey area), measurements of columnar grains that are longer than the field of view are not considered.
0 100 200 300 400 0 50 100 150
27
4. Discussion
4.1. Impact of solidification velocity on the grain structure formation
Extensive investigations of the impact of the solidification velocity on the grain size during directional solidification of refined aluminum alloys have been previously carried out either post-mortem or in-situ. It is well-established that the propagation of the solidification front occurs due to the formation of new grains in the constitutional undercooling zone located in front of already growing dendrites (visible for the slowest growth velocity in Fig. 6a), where heterogeneous nucleation of grains on refining particles can occur as described for instance by the interdependence theory [5]. In the case of a solidification in a constant temperature gradient, the constitutional undercooling variation in the liquid depends on the solidification velocity as illustrated on Fig. 9. T(z) is the linear temperature profile in front of a dendrite tip parallel to the temperature gradient, Teq(z) is the equilibrium temperature profile and is deduced from the
concentration profile that was calculated analytically by using the model proposed by Kurz et
al. [45] based on the hemispherical model approximation to the dendrite tip and the parameters of table 2. An increase of the solidification velocity induces an increase of both Tmax the
maximum constitutional undercooling intensity and ls the length of the undercooled zone, which
yield to an increase of the of nucleation events ahead of dendrite tips according to the free growth model proposed by Greer et al. [46]. This explains in our experiments on a refined alloy the transition from a fully columnar growth (no nucleation event) at very low cooling rate to an equiaxed grain structure (great number of nucleation) for the highest growth velocities.
28
Moreover, when only the largest refining particles gave rise to grain nucleation, grains had enough time to grow until reaching millimetric sizes. When increasing the solidification velocity, the activation of smaller refiners (mainly due to the increase of Tmax) provoked a
significant increase of the grain number. In that case, grains growth was rapidly stopped by impingement with neighboring grains, which limits their size down to micrometer sizes. This trend is in good agreement with previous post-mortem [7] and recent in-situ studies [8]. For a sake of completeness, the increase of the solutal length with the cooling rate could also make the new grains nucleate farther. However, preliminary attempts at measuring the nucleation distance defined as the distance between a new grain and the closest dendrite tip did not show any obvious trend.
Only a few experimental studies have been focused on the characterization of the grain morphology and the changes induced by an increase of the growth velocity or cooling rate. These grain morphology modifications are a direct consequence of the increasing number of new grains that reduced the grain growth duration. At very low solidification velocity (Fig. 7a), no nucleation occurred ahead of the dendrite tip and all grains could develop for a long time in the direction of the temperature gradient, forming a fully columnar grain structure. Increasing the cooling rate enabled a limited number of refining particles to become active that still could develop for a long time in the direction of the temperature gradient, forming a structure of elongated grains ( ). However, their growth could be blocked by nucleation grains ahead of the dendrite tip, forming “short columnar dendritic grains” using the definition proposed by
29
J.D Hunt [2] and by M. Vandyoussefi and Greer [7]. Interestingly, the nucleation of new grains could also take place slightly on the side of the growing dendrites as pointed out by Badillo and Beckermann using phase-field simulations [47]. In that case, the grains could continue to develop by passing between the new grains and then could cross the FoV, as reported in the paper of Li et al. [43], which contribute toward making the distribution of the elongation factor asymmetric.
Fig. 9: Variation of the undercooled liquid zone in front of an isolated dendritic tip according to the hemispherical model for a refined Al-20wt.%Cu alloy and a temperature gradient of G = 11.1 K/mm. (a) V = 32.2 µm/s and ΔTmax ≈ 0.7 K; (b) V = 96.3 µm/s and ΔTmax ≈ 1.6 K.
T (K)
∆Tmax
Teq (z) T(z)
30
For higher solidification velocities, the increase in grain number augments the grain impingement process. As explained in section 3.2, grains became more and more equiaxed ( → ), due to the dendrite arm interaction with (i) first the grains that nucleated before and at the same time and then (ii) the new grains that nucleated ahead. Consequently, the grain orientation distributions show a maximum around 0° but becomes more random. The mixed distribution of both equiaxed and elongated grains was reported in previous experiments on Al-3.5wt.%Ni alloys [12], but its origin was attributed to sedimentation leading to the early entrapment of grains by the effective front.
Finally, it is worth noting that the image sequences showed that the impingement of the grains is mainly due to solutal interactions at low solidification velocity. However, as solidification velocity increases, mechanical blocking is increasingly observed due to grain motion toward the cold side of the sample. In this case, the grains are transported by fluid flow induced by solidification shrinkage as recently reported for solidification experiment carried out during the MASER-12 and MASER-13 sounding rocket experiments in microgravity [39,40,48].
4.2. Impact of temperature gradient variation in the field of view
The non-linear behaviors of both the nucleation front and eutectic front position variations with time were observed for all experiments (Fig.4). They reveal that both the nucleation front velocity and the eutectic front velocity decreased progressively from the bottom to the top of the FoV, which indicates that the solidification conditions evolved during the growth process.
31
Since the applied cooling rate R and temperature gradient Gapp were maintained constant during
the whole experiment, the velocity decrease can be attributed to a variation of the temperature gradient from the bottom to the top of the FoV. The actual temperature gradient in the sample G could be estimated at a given position in the FoV by the relation G = R/V, with V the velocity of the front at this position as shown in Fig. 4b. The variation of temperature gradient G is shown in Fig. 10 for the experiments where an equiaxed front developed. The variations are identical for all experiments, with a progressive increase in the FoV, from 8.4 ± 0.5 K/mm in the lower part to 11.7 ± 0.5 K/mm in the upper part.
Fig. 10: Variation of the temperature gradient G in the FoV deduced from measurements of the nucleation front velocity (color available online).
These values are close to the temperature gradient applied between the heaters Gapp = 11.1
K/mm, which was measured from the regulating thermocouple values. The discrepancy can be attributed to the difference in thermal diffusivity between the sample, the crucible and the
32
furnace as well as the asymmetry of the sample holder design [26]. Further numerical simulations of the experimental device need to be considered to get a better understanding of the observed temperature gradient profile and will be the subject of future publications.
This variation of the temperature gradient through the FoV was at the origin of the significant decrease of the nucleation rate observed in Fig.5. Indeed, an increase of the temperature gradient corresponds to an increase of the slope of T(z) the temperature profile in front of a dendrite tip Fig.9, which results in a decrease of the liquid phase undercooling, preventing small refining particles to become nucleation sites. The less grains nucleate, the less impingement happens. As a result, the grains will be larger and more elongated in the upper part of the FoV. Such features are clearly visible in the microstructure of Fig.7c where several grains nucleated in the bottom part of the FoV and then formed long columnar grains since almost no new nucleation occurred in the top part of the field of view. Concomitantly, the variation of temperature gradient in the FoV also induced a larger width of the grain size and elongation factor distributions and also contribute toward making the distribution of the elongation factor asymmetric. These trends show that it would be interesting to investigate in a more systematic manner the impact of the temperature gradient on the grain size, but also on the grain shape and orientation by carrying out dedicated experiments. Such investigations are currently in progress and will be the subject of a future publication.
33
5. Conclusion
The directional solidification of a refined Al-20wt.%Cu sample was studied by using X-radiography to analyze the impact of the growth velocity on the grain structure formation during directional solidification. Quantitative information on the propagation of the solidification front and on the nucleation rate, as well as the final grain size, shape and orientation distributions were obtained. The results showed that the average grain size decreases and nucleation rate increases when increasing the growth velocity. Grains also became less and less elongated and no preferential growth orientation was observed for the highest growth velocities. These trends are attributed to the change in constitutional undercooling in the liquid phase in front of the growing dendrites. Increasing the growth velocity increases the constitutional undercooling intensity and leads to the activation of more refining particles, increasing the grain impingement frequency. Despite a significant decrease of the average grain size, grains with large elongation factors are always observed. Their formation is attributed to the growth competition between grains of different orientation, with the development of those having their axis well oriented with respect to the temperature gradient being favored. In addition, variations of the grain features in the FoV was linked to the variation of the longitudinal temperature gradient. The higher temperature gradient in the top part of the FoV induced a smaller constitutional undercooling in the liquid and consequently less grain nucleation and the formation of larger and more elongated grains in this region. Measurements also show that the impact of temperature gradient variation has a significant impact on the nucleation rate and further
34
experiments are planned to investigate this feature in more details. The present quantitative analysis of the solidification front propagation and of the final grain structure characteristic can be used as benchmark data for future comparisons with numerical models of the solidification process, such as phase-field models and the more recently developed DNN (Dendrite Needle Network) model.
Acknowledgements
This study was partly supported by the XRMON project (AO-2004-046) of the MAP program of the European Space Agency (ESA) n°AO-2004-046, the French National Space Agency (CNES),and the French-Algerian doctoral fellowship program PROFAS B+.
Appendix A. Supplementary data
Supplementary data related to this article can be found at (link to supplementary material)
References
[1] D.G. McCartney, Grain refining of aluminium and its alloys using inoculants, Int. Mater. Rev. 34 (1989) 247–260. https://doi.org/10.1179/imr.1989.34.1.247.
[2] J.D. Hunt, Steady state columnar and equiaxed growth of dendrites and eutectic, Mater. Sci. Eng. 65 (1984) 75–83. https://doi.org/10.1016/0025-5416(84)90201-5.
[3] C.Y. Wang, C. Beckermann, Prediction of Columnar to Equiaxed Transition during Diffusion-Controlled Dendritic Alloy Solidification, Metall. Mater. Trans. A. 25 (1994) 1081–1093. https://doi.org/10.1007/BF02652282.
[4] M. Rappaz, PH. Thévoz, Solute diffusion model for equiaxed dendritic growth, Acta Metall. 35 (1987) 1487–1497. https://doi.org/10.1016/0001-6160(87)90094-0.
35
between grain formation and nucleant selection, Acta Mater. 59 (2011) 4907–4921. https://doi.org/10.1016/j.actamat.2011.04.035.
[6] A.G. Murphy, R.H. Mathiesen, Y. Houltz, J. Li, C. Lockowandt, K. Henriksson, G. Zimmermann, N. Melville, D.J. Browne, XRMON-SOL: Isothermal equiaxed solidification of a grain refined Al–20 wt%Cu alloy, J. Cryst. Growth. 440 (2016) 38–46. https://doi.org/10.1016/j.jcrysgro.2016.01.032.
[7] M. Vandyoussefi, A.L. Greer, Application of cellular automaton–finite element model to the grain refinement of directionally solidified Al–4.15 wt% Mg alloys, Acta Mater. 50 (2002) 1693–1705. https://doi.org/10.1016/S1359-6454(02)00015-0.
[8] Y. Xu, D. Casari, R.H. Mathiesen, Y. Li, Revealing the heterogeneous nucleation behavior of equiaxed grains of inoculated Al alloys during directional solidification, Acta Mater. 149 (2018) 312–325. https://doi.org/10.1016/jactamat.2018.02.058.
[9] Y. Jia, H. Huang, Y. Fu, G. Zhu, D. Shu, B. Sun, D.H. StJohn, An in situ investigation of the solute suppressed nucleation zone in an Al-15 wt% Cu alloy inoculated by Al-Ti-B, Scr. Mater. 167 (2019) 6–10. https://doi.org/10.1016/j.scriptamat.2019.03.032.
[10] L. Abou-Khalil, G. Salloum-Abou-Jaoude, G. Reinhart, C. Pickmann, G. Zimmermann, H. Nguyen-Thi, Influence of gravity level on Columnar-to-Equiaxed Transition during directional solidification of Al – 20 wt.% Cu alloys, Acta Mater. 110 (2016) 44–52. https://doi.org/10.1016/j.actamat.2016.03.007.
[11] Ø. Nielsen, A. Mo, B. Appolaire, H. Combeau, Measurements and modeling of the microstructural morphology during equiaxed solidification of Al-Cu alloys, Metall. Mater. Trans. A. 32 (2001) 2049–2060. https://doi.org/10.1007/s11661-001-0017-x.
[12] G. Reinhart, H. Nguyen-Thi, N. Mangelinck-Noël, B. Billia, T. Schenk, J. Baruchel, CET during the solidification of refined Al-3.5wt%Ni alloys and characterization of the subsequent grain structure, IOP Conf. Ser. Mater. Sci. Eng. 27 (2012) 012011. https://doi.org/10.1088/1757-899X/27/1/012011.
[13] M. Gennesson, J. Zollinger, D. Daloz, B. Rouat, J. Demurger, H. Combeau, Three Dimensional Methodology to Characterize Large Dendritic Equiaxed Grains in Industrial Steel Ingots, Materials. 11 (2018) 1007. https://doi.org/10.3390/ma11061007.
[14] M. Ahmadein, M. Wu, G. Reinhart, H. Nguyen-Thi, A. Ludwig, Modelling Al-4wt.%Cu as-cast structure using equiaxed morphological parameters deduced from in-situ synchrotron X-ray radiography, IOP Conf. Ser. Mater. Sci. Eng. 117 (2016) 012010. https://doi.org/10.1088/1757-899X/117/1/012010.
[15] S. McFadden, R.P. Mooney, L. Sturz, G. Zimmermann, A Nucleation Progenitor Function approach to polycrystalline equiaxed solidification modelling with application to a microgravity transparent alloy experiment observed in-situ, Acta Mater. 148 (2018) 289– 299. https://doi.org/10.1016/j.actamat.2018.02.012.
[16] G. Zimmermann, M. Hamacher, L. Sturz, Effect of zero, normal and hyper-gravity on columnar dendritic solidification and the columnar-to-equiaxed transition in Neopentylglycol-(D)Camphor alloy, J. Cryst. Growth. 512 (2019) 47–60. https://doi.org/10.1016/j.jcrysgro.2019.01.043.
36
[17] R.H. Mathiesen, L. Arnberg, H. Nguyen-Thi, B. Billia, In Situ X-Ray Video Microscopy as a Tool in Solidification Science, JOM. 64 (2012) 76–82. https://doi.org/10.1007/s11837-011-0213-0.
[18] R.H. Mathiesen, L. Arnberg, K. Ramsøskar, T.W.P.D. Student, C. Rau, A. Snigirev, Time-resolved x-ray imaging of aluminum alloy solidification processes, Metall. Mater. Trans. B. 33 (2002) 613–623. https://doi.org/10.1007/s11663-002-0041-2.
[19] O. Ludwig, M. Dimichiel, L. Salvo, M. Suéry, P. Falus, In-situ three-dimensional microstructural investigation of solidification of an Al-Cu alloy by ultrafast x-ray microtomography, Metall. Mater. Trans. A. 36 (2005) 1515–1523. https://doi.org/10.1007/s11661-005-0243-8.
[20] G. Reinhart, A. Buffet, H. Nguyen-Thi, B. Billia, H. Jung, N. Mangelinck-Noël, N. Bergeon, T. Schenk, J. Härtwig, J. Baruchel, In-Situ and Real-Time Analysis of the Formation of Strains and Microstructure Defects during Solidification of Al-3.5 Wt Pct Ni Alloys, Metall. Mater. Trans. A. 39 (2008) 865–874. https://doi.org/10.1007/s11661-007-9449-2.
[21] A. Buffet, H. Nguyen-Thi, A. Bogno, T. Schenk, N. Mangelinck-Noël, G. Reinhart, N. Bergeon, B. Billia, J. Baruchel, Measurement of Solute Profiles by Means of Synchrotron X-Ray Radiography during Directional Solidification of Al-4 wt% Cu Alloys, Mater. Sci. Forum. 649 (2010) 331–336. https://doi.org/10.4028/www.scientific.net/MSF.649.331. [22]W.U. Mirihanage, K.V. Falch, I. Snigireva, A. Snigirev, Y.J. Li, L. Arnberg, R.H. Mathiesen,
Retrieval of three-dimensional spatial information from fast in situ two-dimensional synchrotron radiography of solidification microstructure evolution, Acta Mater. 81 (2014) 241–247. https://doi.org/10.1016/j.actamat.2014.08.016.
[23]C. Rakete, C. Baumbach, A. Goldschmidt, D. Samberg, C.G. Schroer, F. Breede, C. Stenzel, G. Zimmermann, C. Pickmann, Y. Houltz, C. Lockowandt, O. Svenonius, P. Wiklund, R.H. Mathiesen, Compact x-ray microradiograph for in situ imaging of solidification processes: Bringing in situ x-ray micro-imaging from the synchrotron to the laboratory, Rev. Sci. Instrum. 82 (2011) 105108. https://doi.org/10.1063/1.3650468.
[24] S. Klein, D. Braeuer, M. Becker, A. Knipstein, S. Meckel, E. Sondermann, F. Kargl, X-RISE - A Multifunctional X-ray Radiography Device for Parabolic Flights and Laboratory Use, Int. J. Microgravity Sci. Appl. 33 (2016) 330405. https://doi.org/10.15011/jasma.33.330405.
[25] H. Nguyen-Thi, G. Reinhart, G. Salloum-Abou-Jaoude, D.J. Browne, A.G. Murphy, Y. Houltz, J. Li, D. Voss, A. Verga, R.H. Mathiesen, G. Zimmermann, XRMON-GF Experiments Devoted to the in Situ X-ray Radiographic Observation of Growth Process in Microgravity Conditions, Microgravity Sci. Technol. 26 (2014) 37–50. https://doi.org/10.1007/s12217-014-9370-4.
[26] H. Nguyen-Thi, G. Reinhart, G. Salloum Abou Jaoude, R.H. Mathiesen, G. Zimmermann, Y. Houltz, D. Voss, A. Verga, D.J. Browne, A.G. Murphy, XRMON-GF: A novel facility for solidification of metallic alloys with in situ and time-resolved X-ray radiographic
37
characterization in microgravity conditions, J. Cryst. Growth. 374 (2013) 23–30. https://doi.org/10.1016/j.jcrysgro.2013.03.032.
[27] A.G. Murphy, G. Reinhart, H. Nguyen-Thi, G. Salloum Abou Jaoude, D.J. Browne, Meso-scale modelling of directional solidification and comparison with in situ X-ray radiographic observations made during the MASER-12 XRMON microgravity experiment, J. Alloys Compd. 573 (2013) 170–176. https://doi.org/10.1016/j.jallcom.2013.04.027.
[28] A.G. Murphy, W.U. Mirihanage, D.J. Browne, R.H. Mathiesen, Equiaxed dendritic solidification and grain refiner potency characterised through in situ X-radiography, Acta Mater. 95 (2015) 83–89. https://doi.org/10.1016/j.actamat.2015.04.060.
[29] M. Becker, S. Klein, F. Kargl, In-situ solute measurements with a laboratory polychromatic microfocus X-ray source during equiaxed solidification of an Al-Ge alloy, Scr. Mater. 124 (2016) 34–37. https://doi.org/10.1016/j.scriptamat.2016.06.032.
[30]E.O. Hall, The Deformation and Ageing of Mild Steel: III Discussion of Results, Proc. Phys. Soc. Sect. B. 64 (1951) 747–753. https://doi.org/10.1088/0370-1301/64/9/303.
[31] N.J. Petch, The cleavage strength of polycrystals., J Iron Steel Inst. 174 (1953) 25. [32] N. Hansen, Hall–Petch relation and boundary strengthening, Scr. Mater. 51 (2004) 801–
806. https://doi.org/10.1016/j.scriptamat.2004.06.002.
[33] M.D. Abramoff, P.J. Magalhães, S.J. Ram, Image processing with ImageJ, Biophotonics Int. 11 (2004) 36–42.
[34] D. Ruvalcaba, R.H. Mathiesen, D.G. Eskin, L. Arnberg, L. Katgerman, In-Situ Analysis of Coarsening during Directional Solidification Experiments in High-Solute Aluminum Alloys, Metall. Mater. Trans. B. 40 (2009) 312–316. https://doi.org/10.1007/s11663-008-9166-2.
[35] H. Nguyen Thi, G. Reinhart, A. Buffet, T. Schenk, N. Mangelinck-Noël, H. Jung, N. Bergeon, B. Billia, J. Härtwig, J. Baruchel, In situ and real-time analysis of TGZM phenomena by synchrotron X-ray radiography, J. Cryst. Growth. 310 (2008) 2906–2914. https://doi.org/10.1016/j.jcrysgro.2008.01.041.
[36] V.B. Biscuola, M.A. Martorano, Mechanical Blocking Mechanism for the Columnar to Equiaxed Transition, Metall. Mater. Trans. A. 39 (2008) 2885–2895. https://doi.org/10.1007/s11661-008-9643-x.
[37]H. Nguyen-Thi, G. Reinhart, N. Mangelinck-Noël, H. Jung, B. Billia, T. Schenk, J. Gastaldi, J. Härtwig, J. Baruchel, In-Situ and Real-Time Investigation of Columnar-to-Equiaxed Transition in Metallic Alloy, Metall. Mater. Trans. A. 38 (2007) 1458–1464. https://doi.org/10.1007/s11661-007-9170-1.
[38] A. Prasad, S.D. McDonald, H. Yasuda, K. Nogita, D.H. StJohn, A real-time synchrotron X-ray study of primary phase nucleation and formation in hypoeutectic Al–Si alloys, J. Cryst. Growth. 430 (2015) 122–137. https://doi.org/10.1016/j.jcrysgro.2015.06.024.
[39] G. Salloum-Abou-Jaoude, H. Nguyen-Thi, G. Reinhart, R.H. Mathiesen, G. Zimmermann, D. Voss, Characterization of Motion of Dendrite Fragment by X-Ray Radiography on Earth and under Microgravity Environment, Mater. Sci. Forum. (2014). https://doi.org/10.4028/www.scientific.net/MSF.790-791.311.
38
[40]A.G. Murphy, R.H. Mathiesen, Y. Houltz, J. Li, C. Lockowandt, K. Henriksson, N. Melville, D.J. Browne, Direct observation of spatially isothermal equiaxed solidification of an Al– Cu alloy in microgravity on board the MASER 13 sounding rocket, J. Cryst. Growth. 454 (2016) 96–104. https://doi.org/10.1016/j.jcrysgro.2016.08.054.
[41] E. Liotti, C. Arteta, A. Zisserman, A. Lui, V. Lempitsky, P.S. Grant, Crystal nucleation in metallic alloys using x-ray radiography and machine learning, Sci. Adv. 4 (2018) eaar4004. https://doi.org/10.1126/sciadv.aar4004.
[42] G. Reinhart, H. Nguyen-Thi, B. Sarpi, A.A. Bogno, B. Billia, In Situ Investigation of Grain Migration by TGZM during Solidification in a Temperature Gradient, Mater. Sci. Forum. 790–791 (2014) 323–328. https://doi.org/10.4028/www.scientific.net/MSF.790-791.323. [43] Y.Z. Li, N. Mangelinck-Noël, G. Zimmermann, L. Sturz, H. Nguyen-Thi, Comparative
study of directional solidification of Al-7 wt% Si alloys in Space and on Earth: Effects of gravity on dendrite growth and Columnar-to-equiaxed transition, J. Cryst. Growth. 513 (2019) 20–29. https://doi.org/10.1016/j.jcrysgro.2019.02.050.
[44] G. Salloum Abou Jaoudé, G. Reinhart, H. Nguyen-Thi, H. Combeau, M. Založnik, T. Schenk, T. Lafford, In situ experimental observation of the time evolution of a dendritic mushy zone in a fixed temperature gradient, Comptes Rendus Mécanique. 341 (2013) 421– 428. https://doi.org/10.1016/j.crme.2013.01.013.
[45] W. Kurz, D.J. Fisher, Fundamentals of solidification, Trans Tech Publications, 1986. [46] A.L. Greer, A.M. Bunn, A. Tronche, P.V. Evans, D.J. Bristow, Modelling of inoculation of
metallic melts: application to grain refinement of aluminium by Al–Ti–B, Acta Mater. 48 (2000) 2823–2835. https://doi.org/10.1016/S1359-6454(00)00094-X.
[47] A. Badillo, C. Beckermann, Phase-field simulation of the columnar-to-equiaxed transition in alloy solidification, Acta Mater. 54 (2006) 2015–2026. https://doi.org/10.1016/j.actamat.2005.12.025.
[48] D.J. Browne, F. Garcia-Moreno, H. Nguyen-Thi, G. Zimmermann, F. Kargl, R.H. Mathiesen, A. Griesche, O. Minster, Overview of In Situ X-Ray Studies of Light Alloy Solidification in Microgravity, in: K.N. Solanki, D. Orlov, A. Singh, N.R. Neelameggham (Eds.), Magnes. Technol. 2017, Springer International Publishing Ag, Cham, 2017: pp. 581–590.
