HAL Id: tel-01835289
https://tel.archives-ouvertes.fr/tel-01835289
Submitted on 11 Jul 2018
HAL is a multi-disciplinary open access
archive for the deposit and dissemination of sci-entific research documents, whether they are pub-lished or not. The documents may come from teaching and research institutions in France or abroad, or from public or private research centers.
L’archive ouverte pluridisciplinaire HAL, est destinée au dépôt et à la diffusion de documents scientifiques de niveau recherche, publiés ou non, émanant des établissements d’enseignement et de recherche français ou étrangers, des laboratoires publics ou privés.
Quantitative models of establishments location choices :
spatial effects and strategic interactions
Sabina Buczkowska
To cite this version:
Sabina Buczkowska. Quantitative models of establishments location choices : spatial effects and strategic interactions. Economics and Finance. Université Paris-Est, 2017. English. �NNT : 2017PESC0052�. �tel-01835289�
”L’Ecole doctorale des Organisations, Marchés, Institutions de l’Université Paris-Est Créteil ne donne ni approbation ni improbation aux opinions exprimées dans cette thèse. Ces opin-ions sont considérées comme propres w leur auteure”.
T T C
Acknowledgments
You know how it s. You pick up a book,
flip to the dedication, and find that, once again, the author hs dedicated a book to someone else and not to you. Not ths time.
...- N. Gaiman, ”Anansi Boys”
I K U library in the year 2008 when the light bulb moment
struck. The Anselin’s book on spatial analysis came into my hands and its contents stayed in my mind until today. The day of completing the last chapter. The day of bringing the thesis to an end.
It never crossed my mind that I’d go live in another country. But as unlikely as it was, once I went, I never looked back. After living and studying in Poland, Sweden, and Germany, it was France which conquered my heart. Yet, our love was laborious, demanding, and grueling. Exactly seven years now living in Paris. That journey, from a mute new expat/immigrant to an eventually quite fluent (or let’s use with impunity a word ”O.K.”) French speaker, from knowing nobody to saying Hi! to all the ”boulangers” and butchers on my street, from wolf-ing down donuts to relishwolf-ing the French Pytisserie with a capital letter, from bewolf-ing airy-fairy to becoming a serious mother.
That journey would not be the same without a couple of people met on my way. To Prof. André de Palma. Oh! I have already struck without even sending a warning signal. So yes, the first ”Thank you” goes to this distinct, yet very particular professor for being demanding the way he is and for giving me the chance to stay in Paris after my master program ended up and my adult life began; Next, I send all my gratitude to all the Seventh EU Framework Program SustainCity Project members, mentioning Saif in particular, with whom I shared the desk at the ENS Cachan office and without whom playing music at 7 P.M. while taking a break from work would not be fun otherwise.
No thesis would be accomplished without the following smaller and bigger personæ. I am indebted to:
My international family: the Erasmus Mundus Program students who not only substituted vii
my family but also perfectly complemented it, notably Alice for sending me nicely strong Karma coffee from the Laos mountains and lemongrass tea from Thailand to wind down from the coffee effect, Esfandiar, Yan, my Kabutar Mina for million ”miss you, miss you” words!, my awe-inspiring friend Tara, and my little Chinese sister Guodi. This one’s for you. You probably know why.
My second international family for sharing the floor in the American Fondation: my danc-ing Rida for her never-faildanc-ing optimism, my American Polish brother Mark Zaborowski, mul-titalented Baidy, and to Tierra for her writing talent who helped me scrape through my very first scientific paper.
Ana, the real fighter and the Taekwondo Master for all the <3s and accepting me as I am; Gordon Bowker, Jerry Baldwin, Zev Siegl for founding Starbucks, so that we could find there a secondary office with Ana; Meno, Vadim, godfather Marouene, Adams - the tektonic spe-cialist and the best uncle, exceptional Paola, Hamza number one and Hamza number two, the rockets builder Heric, and finally the most talented and probably the youngest Senior Researcher from the Statistics Finland, Henri. Hi Henri.
Friends from IFSTTAR and the DEST Laboratory: Benoît for showing me how cool French people can be; ”Irritating” David who kept on reminding me not to take myself too seriously; Katia, Christine, and Hoai-Thu, the Ifsttar super mothers; and the most original and the best coiffé Kevin from the Ifsttar cafeteria for providing the strong enough coffee.
Prof. Michel Bierlaire who let me join his team at the École Polytechnique Fédérale de Lausanne for a couple of months during my thesis and who gave me the chance to answer correctly maybe two out of his hundred super challenging questions; and all the members of his team: always in trouble Yousef, Shadi, Marija, the genius Iliya, eating porridge at 4 P.M. Flurin, Antonin, running fast Tomxs̆, Evantia, strong Riccardo, Anna, and Stefan.
My heroes: Prof. Anselin who I never met in my life but who is responsible for my love to spatial analysis and whose work in many ways motivated this project; My idol, Prof. LeSage who I had a tremendous honor to meet and to talk to about my research, whose comments helped clarify my own thinking, and who almost convinced me that Bayesian analysis is the remedy to all the World’s problems; Prof. Krzysztof Malaga, a definition of hard work and a great example to students.
Slowly heading to an end of dedication, I will definitely not forget to thank: Nicolas, with whom looking for new ideas and writing articles was an unspeakable joy of creation, for stay-ing attentive after not closstay-ing an eye durstay-ing a couple of nights. It is not an easy task to be a multi-task young father-researcher;
Matthieu de Lapparent, the thesis advisor, to whom I have a huge respect for not only being a great professional mentor, but especially a great human, who over the years has taught me more than anyone;
Jean-Loup Madre, the thesis director, whose encouragement and supreme support of all viii
my projects were essential;
and all the Ph.D. Committee Members for your time and patience while reading this thesis. Finally, I am most deeply thankful to the closest ones: My father, the best advice-giver and the fantastic professor, who installed within me a love of science, who encouraged me to change my study field from finance and banking to econometrics. Thank you for being stub-born enough at that moment of my life; My father (the same one) to whom I promised that I will never ever go for a Ph.D. He waited for a moment and said... ”Oh yes, darling, you will”; My mom for her never-ever-ending support (literally), for these thousand Whatsapp, Face-book, phone... messages per day. Dziekuje; My grandma, the most energetic grandmother on Earth, I guess; My older (and of course more clever) sister Kamila for being an inspiration in all the life domains; The best-est Marta. A word ”best” would not be enough in her case. Adel, the biggest Cyril Lignac eater, the worst swimmer and bike rider I’ve got to know, the most dedicated father, and the best husband. You are perfect to me.
... and to Camil who decided to cheerfully teethe when I was trying to finish my thesis. To Camil, without whose unvarying emotional realm of love and a constant smile this thesis would have been completed in half the time.
After these couple of words before the story even begins... 3,5 year that this thesis was in the making, here’re six chapters. Nearly everything I intended is in it, and still the thesis is not full. Good and bad ideas are in it along with only a little bit of despondency and enormous pleasure of discovering. Here’re six chapters through which I tried to briefly and gracefully communicate a number of things. Each chapter tells one story. All the stories create an image which I could definitely keep on painting further. But let’s close it for now and let’s raise the curtains.
Pars, February 7, 2017
Sabina Buczkowska
Quantitative models of establishment location choices: Spatial
effects and strategic interactions
A
This thesis is breathing new life into the location choice models of establishments. The need for methodological advances in order to more realistically model the complexity of es-tablishment decision-making processes, such as their optimal location choices, is the key mo-tivation of this thesis.
First, location choice models use geo-referenced data, for which choice sets have an explicit spatial component. It is thus critical to understand how to represent spatial aspect in location choice models. The final decision of an establishment seems to be related to the surrounding economic landscape. When accounting for the linkage between neighboring observations, the decision on the spatial weight matrix specification must be made. Yet, researchers over-whelmingly apply the Euclidean metric without realizing its underlying assumptions and its alternatives. This representation has been originally proposed due to scarce data and low com-puting power, rather than because of its universality. In areas, such as the Paris region, where high congestion or uncrossable physical barriers problems clearly arise, distances purely based on topography may not be the most appropriate for the study of intra-urban location. There are insights to be gained by mindfully reconsidering and measuring distance depending on a problem being analyzed. Rather than locking researchers into a restrictive structure of the weight matrix, this thesis proposes a flexible approach to intimate which distance metric is more likely to correctly account for the nearby markets depending on the sector considered. In addition to the standard Euclidean distance, six alternative metrics are tested: travel times by car (for the peak and off-peak periods) and by public transit, and the corresponding net-work distances.
Second, what makes these location choices particularly interesting and challenging to ana-lyze is that decisions of a particular establishment are interrelated with choices of other play-ers. These thorny problems posed by the interdependence of decisions generally cannot be assumed away, without altering the authenticity of the model of establishment decision mak-ing. The conventional approaches to location selection fail by providing only a set of system-atic steps for problem-solving without considering strategic interactions between the estab-lishments in the market. One of the goals of the present thesis is to explore how to correctly
adapt location choice models to study establishment discrete choices when they are interre-lated.
Finally, a firm can open a number of units and serve the market from multiple locations. Once again, traditional theory and methods may not be suitable to situations wherein indi-vidual establishments, instead of locating independently from each other, form a large orga-nization, such as a chain facing a fierce competition from other chains. There is a necessity to incorporate interactions between units within the same and competing firms. In addi-tion, the need to state a clear difference between the daytime and nighttime population has been emphasized. Demand is represented by pedestrian and car flows, the crowd of poten-tial clients passing through the commercial centers, train and subways stations, airports, and highly touristic sites. The Global Survey of Transport (EGT 2010), among others, is of service to reach this objective.
More realistically designed location choice models accounting for spatial spillovers, strate-gic interaction, and with a more appropriate definition of distance and demand can become a powerful and flexible tool to assist in finding a befitting site. An appropriately chosen location in turn can make an implicative difference for the newly-created business. The contents of this thesis provide some useful recommendations for city planners, plan developers, business owners, and shopping center investors. We asked a number of burning questions through this thesis and attempted to open the door to possible answers or to stimulate further reflection on location choice models.
Keywords: location choice, count data model, discrete choice model, hurdle model,
ex-cess zero problem, Tobit model, spatial spillovers, Euclidean distance, travel time, congestion, physical barriers, strategic interactions, Bayesian Nash, discrete game, interdependence of sec-tors, within- and inter-industry interactions, daytime population, demand, multi-store firms, nearest neighbor distance, rival- and same-chain stores, Paris region
Modèles quantitatifs de choix de localisation des établissements :
effets spatiaux et interactions stratégiques
R ́ ́
Dans un contexte de carence méthodologique, cette thèse vise w apporter un nouveau souf-fle aux modèles de choix de localisation jusqu’ici incapables d’appréhender de manière réaliste la complexité des processus décisionnels des établissements tels que leurs choix de localisation optimale.
Les modéles de choix de localisation utilisent des données géoréférencées, pour lesquelles les ensembles de choix ont une composante spatiale explicite. Il est donc essentiel de com-prendre comment représenter l’aspect spatial dans les modèles de choix de localisation. La décision finale d’un établissement semble être liée au paysage économique environnant. La quantification du lien entre les observations voisines implique une prise de décision sur la spécification de la matrice spatiale. Pourtant, la grande majorit des chercheurs appliquent la métrique euclidienne sans considérer de les hypothèses sous-jacentes et ses alternatives. Cette démarche a été initialement proposée en raison de données et de puissance informatique lim-itées plutt que de son universalité. Dans les régions comme la région parisienne, oû la conges-tion ainsi que les problèmes de barrières physiques non traversables apparaissent clairement, les distances purement basées sur la topographie peuvent ne pas être les plus appropriées pour l’étude de la localisation intra-urbaine. Il est possible d’acquérir des connaissances en recon-sidérant et en mesurant la distance en fonction du problème analysé. Plutôt que d’enfermer les chercheurs dans une structure restrictive de la matrice de pondération, cette thèse propose une approche souple pour identifier la métrique de distance la plus susceptible de prendre en compte correctement les marchés voisins selon le secteur considéré. En plus de la distance eu-clidienne standard, six autres mesures sont testées : les temps de déplacement en voiture (pour les périodes de pointe et hors pointe) et en transport en commun, ainsi que les distances de réseau correspondantes.
Par ailleurs, les décisions d’un établissement particulier sont interdépendantes des choix d’autres acteurs, ce qui rend les choix de localisation particulièrement intéressants et diffi-ciles w analyser. Ces problèmes épineux posés par l’interdépendance des décisions ne peuvent généralement être négligés sans altérer l’authenticité du modèle de décision d’établissement. Les approches classiques de la sélection de localisation échouent en ne fournissant qu’un
semble d’étapes systématiques pour la résolution de problèmes sans tenir compte des inter-actions stratégiques entre les établissements sur le marché. L’un des objectifs de la présente thèse est d’explorer comment adapter correctement les modèles de choix de localisation pour étudier les choix discrets d’établissement lorsqu’ils sont interdépendants.
En outre, une entreprise peut ouvrir un certain nombre d’unités et servir le marché w par-tir de plusieurs localisations. Encore une fois, la théorie et les méthodes traditionnelles peu-vent ne pas convenir aux situations dans lesquelles les établissements individuels, au lieu de se situer indépendamment les uns des autres, forment une grande organisation, telle qu’une chaîne confrontée w une concurrence féroce d’autres chaînes. Le modèle prend en compte non seulement les interactions intra-chaînes mais aussi inter-chaînes. Aussi, la nécessité d’indiquer une nette différence entre la population de jour et de nuit a été soulignée. La demande est représentée par les flux de piétons et de voitures, la foule de clients potentiels passant par les centres commerciaux, les stations de trains et de métros, les aéroports et les sites touristiques. L’Enquête Globale Transport 2010 (EGT 2010), entre autres, est utile pour atteindre cet ob-jectif.
Des modèles de choix de localisation plus réalistes conçus pour expliquer les débordements spatiaux, des interactions stratégiques et qui appliquent une définition plus appropriée de la distance et de la demande peuvent devenir un outil puissant et flexible pour aider w trouver un site adapté. Un lieu convenablement choisi peut également constituer un avantage pour les nouveaux établissements. Le contenu de cette thèse fournit des recommandations utiles pour les urbanistes, les promoteurs immobiliers, les propriétaires d’entreprises et les investisseurs de centres commerciaux.
En somme, nous posons dans cette thèse un certain nombre de questions brûlantes w travers lesquelles nous tentons d’ouvrir la porte w des questions possibles ou de stimuler la réflexion sur les modèles de choix de localisation.
Mots-cls : choix de localisation, modèle de comptage, modèle de choix discret,
déborde-ments spatiaux, distance euclidienne, temps de déplacement, congestion, barrières physiques, interactions stratégiques, interdépendance des secteurs, interactions interindustrielles, popu-lation de jour, entreprises multi-magasins, ele-de-France
N : Department for Planning, Mobility and Environment - AME
Laboratory Economic and Social Dynamics of Transport - DEST
French Institute of Science and Technology for Transport, Development and Networks -IFSTTAR
14-20 Boulevard Newton
Cité Descartes, Champs sur Marne, F-77447 Marne la Vallée Cedex 2 France
www.ifsttar.fr
I ́ : Département Aménagement, Mobilités et Environnement - AME
Laboratoire Dynamiques Economiques et Sociales des Transports - DEST
Institut Français des Sciences et Technologies des Transports, de l’Aménagement et des Réseaux - IFSTTAR
14-20 Boulevard Newton
Cité Descartes, Champs sur Marne, F-77447 Marne la Vallée Cedex 2 France
www.ifsttar.fr
Contents
1 G 1
1.1 Location choice models of establishments . . . 1
1.2 Key questions . . . 2 1.3 Relevance of research . . . 3 1.4 Literature . . . 7 2 L - : S 11 2.1 Introduction . . . 12
2.2 Review of empirical literature . . . 13
2.3 Study area . . . 18 2.4 Data . . . 19 2.5 Descriptive statistics . . . 23 2.6 Parametric models . . . 32 2.7 Results . . . 37 2.8 Conclusions . . . 42 3 E : A - -51 3.1 Introduction . . . 52 3.2 Literature review . . . 56 3.3 Data . . . 59 3.4 Model . . . 65 3.5 Results . . . 69 3.6 Conclusions . . . 81 4 L : I 93 4.1 Introduction . . . 94
4.2 Within-industry and inter-industry interactions . . . 97
4.3 Why bother about strategic interactions? . . . 98 xix
4.4 Push and pull factors . . . 98
4.5 Data . . . 100
4.6 Model . . . 107
4.7 Results . . . 116
4.8 Conclusions and possible applications . . . 125
5 L - : A 131 5.1 Introduction . . . 132
5.2 Literature review . . . 135
5.3 Data . . . 145
5.4 Market description . . . 149
5.5 Nearest neighbor distance . . . 152
5.6 Model: Reduced-form profit function . . . 159
5.7 Empirical results . . . 161
5.8 Conclusions . . . 180
6 C 187 6.1 Main findings . . . 189
6.2 Practical recommendations . . . 192
6.3 Future research directions . . . 193
Listing of figures
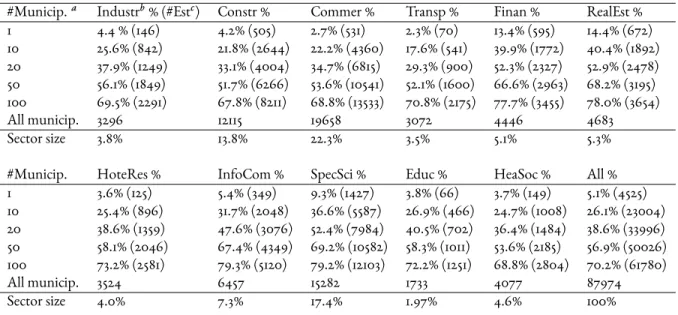
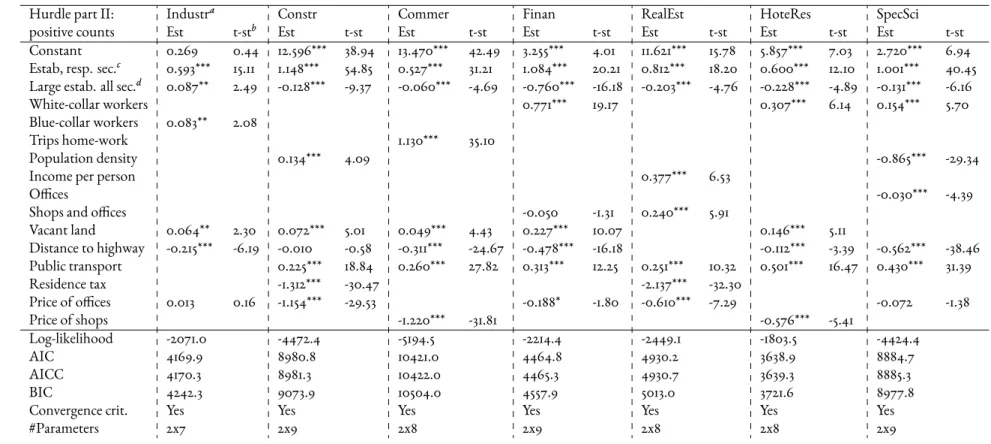
2.1 Newly-created establishments in 2007 - rankings based on the market share- focus on Paris and the inner ring. . . 26 3.1 Road network (upper figure) and public transit network (lower figure) in
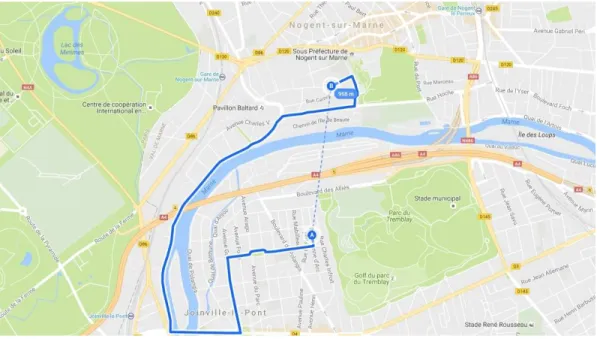
the Paris region . . . 62 3.2 Example 1. Google map image: Possible barriers which require to make
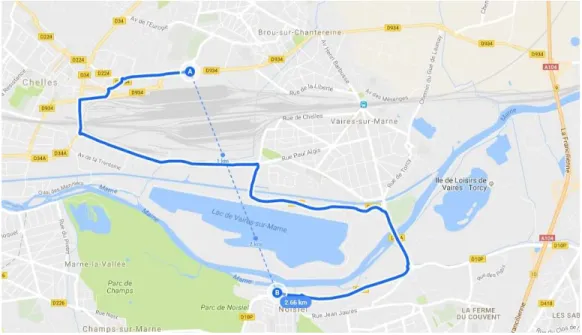
de-tours: a river, islands, a lake, parks, a golf course, stadiums, highways, a na-tional road, departmental roads, train routes. Euclidean (958 m) versus real distance (4.0 km and 12 min) from point A to B in the area of Boullereaux-Champigny, the Paris region. Source: Google My Maps . . . 69 3.3 Example 2. Google map image: Possible barriers which require to make
tours: a river, lakes, an attraction island theme park, parks, a highway, de-partmental roads, train routes, electric and thermic centers, cemetery. Eu-clidean (2.66 km) versus real distance (8.2 km and 13 min) from point A to B in the area of Champs-sur-Marne, the Paris region. Source: Google My Maps 70 3.4 Selected example of the estimates of the truncated-at-zero Poisson parts of
the mixture models for the construction sector. Comparison of two cases for models that use two classes. . . 90 3.5 Posterior probabilities of belonging to class #1 (ED) as opposed to class #2
(TtVhMph) at the municipality level (each municipality can be treaten as an alternative in the decision-making process of an establishment): construc-tion sector (upper figure), special, scientific and technical activities (central figure), and real estate sector (lower figure) . . . 91 4.1 109 EGT zones of the Paris region . . . 102 5.1 Example of data representation: Zones’ characteristics. Various data sources;
The most touristic sites in the Paris region with over 1 million and 0.5 mil-lion tourists each year in 2012; Locations of train stations. Source: Ministry of Crafts, Commerce and Tourism, ”Memento du tourisme 2013”, General Directorate for Competitiveness, Industry and Services . . . 147
5.2 Monthly turnover index value in million euros for the fast-food and tradi-tional restaurants over time. Situation for the metropolitan France from Jan-uary 1995 until August 2015. Reference period: 2010. Source: INSEE, DGFiP 149 5.3 How the best performing fast-food chains in the Paris region share the
mar-ket between each other over time. Accumulated monthly number of newly opened stores in the Paris region between 2001 and 2015, including the stock of stores registered before January 2001. Source: Calculations based on the SIRENE/INSEE database . . . 150 5.4 Attractiveness of the Paris region for the best performing chains: The global
situation which considers the total accumulated number of all pre-existing stores of these chains in 2015. Source: Calculations based on the SIRENE/INSEE database verified and extended using the addresses provided through the of-ficial websites of all the analyzed fast-food chains . . . 152 5.5 The change of location strategy over time: The change of the attractiveness
level of Paris, the closer and outer suburbs for the best performing chains. Focus on the situation between 2001 and 2015. Source: Calculations based on the SIRENE/INSEE database verified and extended using the addresses provided through the official websites of all the analyzed fast-food chains . . 169 5.6 Examples of location strategies of McDonald’s versus Pomme and
McDon-ald’s versus Pomme and Paul in the central part of Paris in 2015 using Google My Maps. Source: SIRENE/INSEE database verified and extended using the addresses provided through the official websites of all the analyzed fast-food chains . . . 170 5.7 Examples of location strategies of McDonald’s versus Quick and
McDon-ald’s versus KFC in the central part of Paris in 2015 using Google My Maps. Source: SIRENE/INSEE database verified and extended using the addresses provided through the official websites of all the analyzed fast-food chains . . 171 5.8 Examples of location strategies of establishments of McDonald’s, KFC, Quick,
Paul, and Pomme de Pain in Paris, the closer suburbs, and the outer sub-urbs in 2015 using Google My Maps. The same scale has been kept through Fig. 5.6 - 5.8, so that the between store distances can be compared. Source: SIRENE/INSEE database verified and extended using the addresses provided through the official websites of all the analyzed fast-food chains . . . 172 5.9 Locations of establishments of McDonald’s, Quick, KFC, Paul, and Pomme
de Pain in the Paris region (pictures on the left) and in 80 districts of Paris (pictures on the right) at the individual establishment level. Situation in 2015. Source: SIRENE/INSEE database verified and extended using the addresses provided through the official websites of all the analyzed fast-food chains . . 173
Listing of tables
2.1 Description of potential explanatory variables. . . 21 2.2 Market share of top 1, 10, 20, 50, 100 municipalities in 2007. . . 25 2.3 Ranking of top 10 municipalities based on the market share (#newly-createdestablishments to total #establishments in municipality) . . . 27 2.4 Structure of newly-created establishments and existing establishments in each
département in 2007; Comparison with 2003 and 2005 . . . 29
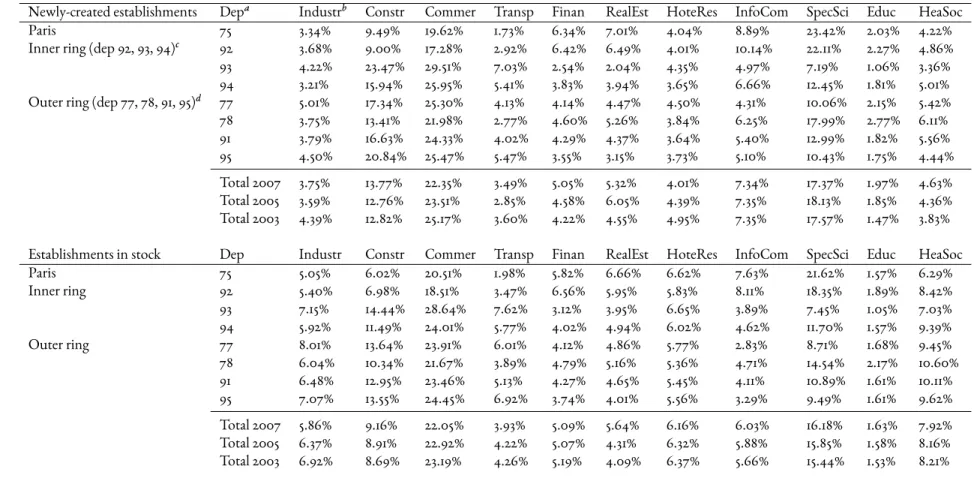
2.5 Structure of newly-created and pre-existing establishments by size category. 31 2.6 Hurdle model with distance matrix: explanatory variables represent density
of existing establishments in the respective sector, density of large pre-existing establishments, and various municipality characteristics. . . 49 2.7 Hurdle model with distance matrix: explanatory variables represent density
of existing establishments in the respective sector, density of large pre-existing establishments, and various municipality characteristics (continua-tion). . . 50 3.1 Description of explanatory variables used in the final models. . . 64 3.2 Pair correlations between Euclidean distance and transport distances. . . 72 3.3 Correlations between Euclidean distance and transport distances by
increas-ing range intervals (in km). . . 73 3.4 Probabilistic mixture of hurdle-Poisson models for the construction sector
that uses two latent classes, case #1: ED (class #1) and TtVhMph (class #2) versus two ”mono-distance” models using first ED and then TtVhMph. . . 77 3.5 Estimated posterior probability of belonging to class #1 (Pi): Comparison
across cases and sectors. . . 80 3.6 Probabilistic mixture of hurdle-Poisson models for spec., scien., tech. and
real estate activities using two latent classes for case #1: ED (class #1) with TtVhMph (class #2). Hurdle and truncated-at-zero Poisson parts reported. . 89 4.1 Selected types of newly-created establishments . . . 101 4.2 Structure of pre-existing establishments by activity sector in the beginning
of 2007 . . . 103 4.3 Structure of pre-existing establishments by size category in the beginning of
2007 . . . 103 xxiii
4.4 Pre-existing establishments’ location across the Paris region in the beginning of 2007 . . . 104 4.5 Final list of variables used in the models (EGT zones characteristics dictionary) 106 4.6 Models estimates: Seven location choice models run simultaneously . . . . 120 4.7 Strategic interactions matrix: How the decision of one establishment type
affects the decision of other establishment types. . . 123 4.8 Variance-covariance matrix of residuals. . . 124 5.1 The pairwise ANN index. Case #1: Paris . . . 154 5.2 The pairwise ANN index. Case #2: Paris and its closer suburbs . . . 155 5.3 The pairwise ANN index. Case #3: The Paris region . . . 156 5.4 Location choices of McDonald’s: Focus on market characteristics . . . 165 5.5 Location choices of Quick: Focus on market characteristics . . . 166 5.6 Location choices of KFC: Focus on market characteristics . . . 166 5.7 Location choices of Paul: Focus on market characteristics . . . 167 5.8 Location choices of Pomme: Focus on market characteristics . . . 167 5.9 Number of newly-created and existing stores . . . 167 5.10 Location choices of McDonald’s: Focus on market structure (cLogit) . . . . 174 5.11 Location choices of all chains: Focus on new market and nearby markets
variables (cLogit) . . . 177 5.12 Location choices of all chain stores: Focus on same- and inter-chain effects
(cLogit) . . . 179 6.1 Explanation of French classification of activities (NAF nomenclature - Rev. 2) 208
1
General introduction
1.1 LT into the location choice models of establishments.
The need for methodological advances in order to more realistically model the complexity of establishment decision-making processes, such as their optimal location choices is the key motivation of this thesis. A clear distinction between an establishment and a firm should be made in the first place. An establishment is defined as a distinct economic unit that produces goods or services at a single physical location. In contrast, a firm is a legal entity that consists of one or more establishments or plants under common ownership and control (van Wissen, 2000).
This thesis is comprised of six chapters and is written in a form of essays. The general in-troduction and the overall conclusion encompass four scientific papers entitled: (1) Location choices of newly-created establishments: Spatial patterns at the aggregate level, (2) Euclidean versus network distances: A mixture model of the intra-metropolitan location choice of es-tablishments, (3) Location choices under strategic interactions: Interdependence of establish-ment types, and (4) Locational strategies of multi-store firms: A daytime population. The first paper has been published in the ”Regional Science and Urban Economics Journal”. The
second paper is under the second review at the ”Networks and Spatial Economics Journal”. Matthieu de Lapparent contributed to Chapter 2, 3, and 4. Nicolas Coulombel contributed to Chapter 3 and 5.
The approach being proposed in this thesis is mostly computational. Techniques explored in this thesis embody the models which use aggregate data and account for the presence of ex-cess zeros, namely count data models, such as zero-inflated or hurdle models, or Tobit model which controls for the excess of zeros problem by means of an additional sample selection equation. Discrete choice models have been applied to study the establishment location choices at the individual level.
1.2 K q
A number of questions will be addressed within this thesis. First, location choice models use geo-referenced data, for which choice sets have an explicit spatial component. It is thus critical to understand how to represent spatial aspects in location choice models. Second, there are insights to be gained by further reconsidering and measuring distance depending on the problem being analyzed. To account for the linkage between neighboring observa-tions, we will examine which distance metric is the most likely to correctly capture spatial spillovers. Third, what makes these location choices particularly interesting and challenging to analyze is that decisions of a particular establishment are interrelated with choices of the others. These thorny problems posed by the interdependence of decisions generally cannot be assumed away, without altering the authenticity of the model of establishment decision making. The conventional approaches to location selection fail by providing only a set of systematic steps for problem-solving without considering strategic interactions between the establishments in the market. One of the goals of this thesis is to explore how to correctly adapt location choice models to study establishments’ discrete choices when they are interre-lated. Fourth, a firm can open a number of units and serve the market from multiple loca-tions. Once again traditional theory and methods may not be suitable to situations wherein individual establishments instead of locating independently from each other, form a large or-ganization, such as a chain facing a fierce competition from other chains. There is a necessity to incorporate interactions between units within the same and competing firms. Illustrative questions that can be answered are: What is the nature and degree of competition for each
analyzed chain? How does a situation of a firm change if there are already rivals established in a particular market versus if a firm faces no local competition? How does a firm perceive a rival store located in a direct vicinity and how if it is located farther away? Can it happen that a chain concentrates its investment efforts in a particular geographical area and uses another type of strategy in other places? How to more appropriately proxy the demand in decisions of revenue-oriented sectors? An intensified research effort along the lines of location choices is still desirable to provide answers to many such questions.
1.3 R
1.3.1 C 2 (P 1)
In this thesis, we concentrate our research on the Paris region, which exemplifies an appeal-ing terrain to address for several reasons. The Paris region is a vibrant and innovative site with over 5.6 million jobs, 37 percent of national executives, and 40 percent of national workforce in research and development. It is the leading research and development hub in Europe and the third worldwide. Over 19 percent of the country’s population, 11.7 million people, reside in the area which occupies only 2.2 percent of the surface of France. The GDP of the region amounts to 29 percent of total French GDP (IAU IdF, 2014). The Paris region is the third world touristic destination (in 2013) (Global Destination Cities Index 2015) with 16 millions of visitors from abroad.
Yet, the Paris region’s economy is spatially unbalanced (Combes et al., 2011). The region is highly heterogeneous, especially regarding economic activity. While a few municipalities host a large number of newly-formed establishments, others struggle to be chosen, and a large group of municipalities is left with no new creation of establishments. When the observed data display a higher fraction of zeros than would be typically explained by the standard count data models, two types of models can be suggested: the hurdle (Mullahy, 1986) or the zero-inflated model (Lambert, 1992). The hurdle model reflects a two-part decision making pro-cess. It relaxes the assumption that the zero observations and the positive observations come from the same data generating process.
Although much work has been done in the domain of location choice models, several is-sues arise when analyzing involved phenomena, which scholars have yet to fully appreciate: (1) addressing the excess of zeros problem in the location choice model in highly
neous geographic areas and (2) determining an appropriate way to accommodate spatial ef-fects in location decisions. In the second chapter of this thesis (Paper 1) we respond to the com-plaint voiced by Bhat et al. (2014) and Liviano-Solís and Arauzo-Carod (2013) that heretofore the hurdle model technique has not been well investigated when analyzing location patterns. These are the first challenges that we face in the second chapter of this thesis.
1.3.2 C 3 (P 2)
The third chapter extends the research on the hurdle model and the study presented in the first part of this thesis. The final decision of an establishment seems to be related to the surrounding economic landscape. When accounting for the linkage between neighboring ob-servations, the decision on the spatial weight matrix specification should be made. Yet, since there exists no solitary claims on the concept of space, the form of the weight matrix is largely debated. One of the problems hides in the definition of distance usually based on the straight-line segment connecting two locations. Euclidean distance is typically used in the empirical literature and has also been utilized in the second chapter of this thesis to account for spatial spillovers in location choice model. However, Euclidean distance is believed to be only one simplistic possibility out of an infinite number of shortest path relations. Other alternative distance metrics may be proposed when building the spatial distance weight matrices.
Geographic factors, such as terrain, land cover, infrastructure, and traffic congestion may cause agents not to adhere to pure Euclidean relations. The Euclidean distance might thus not always be the most relevant depending on the given problem. Interest in this question dates at least to the 1960s and research on network models in geography (Haggett, 1967). There are insights to be gained by mindfully reconsidering and measuring distance. The third chapter investigates establishment location decisions in the Paris region where high congestion, speed limits, or physical uncrossable barriers, such as rivers or industrial corridors can diminish or completely eliminate the linkage between neighboring areas. Rather than imposing a restric-tive structure on the weight matrix, this research proposes a flexible toolkit to identify which distance metric is more appropriate to correctly account for the surrounding economic land-scape. A probabilistic mixture of two ”mono-distance” hurdle-Poisson models is developed. Each model’s latent class uses a different distance representation to incorporate spillover ef-fects in location choices of establishments from several activity sectors. In addition to the standard Euclidean distance, six alternative metrics are considered: travel times by car (for the
peak and off-peak periods) and by public transit, and the corresponding network distances. This methodology allows one to capture the diversity of agents’ behavior,i.e., to distinguish
which establishments are more time- or more distance-oriented, given their location.
1.3.3 C 4 (P 3)
In the fourth chapter we further enhance the literature on the location choices, this time incorporating strategic interactions among establishments. We shed light on strategic interac-tions, fundamental in establishments’ location choices, which is still largely unheeded in the empirical literature. If establishments acted in isolation, it would be a relatively simple task to adapt existing discrete-choice models. Yet, being non-strategic means that an establishment ignores other players’ decisions. Less is known about how to correctly adapt location choice models to study establishments’ discrete choices when they are interrelated. In very sparse em-pirical applications, when locational choice models are developed for several activity sectors, each model is typically run independently.
What makes these discrete choices particularly interesting and challenging to analyze is that decisions of a particular establishment are interrelated with choices of the others because an establishment accounts for the actions of other agents when making its own decisions (Dra-ganska et al., 2008). These thorny problems posed by the interdependence of decisions gener-ally cannot be assumed away, without altering the authenticity of the model of establishment decision making (Berry and Reiss, 2007). The conventional approaches to location selection,
i.e., traditional theory and methods, fail (Thill, 1997) by providing only a set of systematic
steps for problem-solving without considering strategic interactions between the establish-ments in the market. An appropriately specified model of simultaneous entry or location decisions needs to recognize this interdependence of profits (Berry and Reiss, 2007).
There is a need for more realistic studies of complex establishments’ decision-making pro-cesses. Even though the computational burden imposed by these models considering strategic interactions is relatively high, it seems that the costs imposed are more than offset by the ben-efits being accumulated (Draganska et al., 2008).
Strategic interactions have been largely unsung in the empirical analyses since the year 1929 when Hotelling (1929) brought the discussion in the industrial organization literature. Most of the papers are less than a decade old (Bajari et al., 2013). This literature is in its infancy,
in part, due to the complexity of expressions for the probabilities used in the models which increases along with the number of locations and establishment types (Draganska et al., 2008). We estimate a static discrete game of incomplete information to obtain a Bayesian Nash equilibrium at the group level using data at the aggregate level. We permit asymmetries across establishment types in the impact of interaction effects and exogenous market characteristics. We develop one location choice model which embraces seven individual models for seven es-tablishment types run simultaneously to account for interactions from all the types on each other.
1.3.4 C 5 (P 4)
The motivation of the last chapter comes from the fact that most previous discussion on locational decisions has one common feature of making unrealistic and restrictive assump-tions and perceives the industry in terms of an independent store. The analysis of multi-store competition has started already with the trailblazing work of Teitz (1968) who introduced the idea that a firm can open multiple facilities in the context of Hotelling’s linear city model and serves the market from a number of locations. Yet, the subject of location of competing firms with multiple component units seems to have been largely unsung in the spatial location lit-erature (Peng and Tabuchi, 2007). This gap is surprising for the systems which dominate in the market (Karamychev and van Reeven, 2009; Iida and Matsubayashi, 2011; Janssen et al., 2005; Pal and Sarkar, 2002; Peng and Tabuchi, 2007). The conventional single-store location theory may not apply to situations wherein individual stores are part of larger organizations under common strategy, intuition, and control, and where centralization is applied to reach global goals and consider the interest of a firm as a whole (Thill, 1997). Conceptually, a firm selects a distribution of locations instead of choosing a point location (Chu and Lu, 1998).
We do not attempt for the innovative solution or an intricate model. Instead, we focus on rectifying several misconceptions made in the existing papers. The proposed approach is computational. First, we consider five asymmetric fast-food chains. Second, we incorporate interactions between stores within the same firm and stores that belong to different chains. Third, since firms search for the large sources of demand trying to attract the greatest number of potential customers, we reconsider the list of variables usually used to capture the demand level in a market. It is particularly important to carefully define market segments and to select potential customer groups by observing their characteristics, their mobility patterns and the
purpose of their activities during the day and the week. We signal a clear difference between a daytime and nighttime population. A combination of these elements can secure a more realistic model of locational strategies.
1.4 L
1.4.1 C 2 (P 1)
Chapter 2 introduces the reader to the location choice models. The list of the key fac-tors that potentially influence the locational decisions has been created based on the research of Maoh (2005), Strotmann (2007), Liviano-Solís and Arauzo-Carod (2014), Rocha (2008), Maoh and Kanaroglou (2005, 2007), Bondomi and Greenbaum (2007), Bodenmann (2011), Duvereux et al. (2007), Neumark and Kolko (2010), De Bok (2004), Bodenmann and Ax-hausen (2012, 2010), and the review of Arauzo-Carod et al. (2010). Chapter 2 also provides a discussion of the first attempts to incorporate spatial effects into location choice models starting with Bhat and Guo (2004) on modeling spatial dependence in residential locations using a mixed Logit. Sener et al. (2011) propose the generalized spatially correlated Logit and Miyamoto et al. (2004) the mixed Logit with the error autocorrelation and an autocorrelated deterministic component of utility to model the residential behavior. Garrido and Mahmas-sani (2000) discuss a multinomial probit with spatially and temporally correlated error struc-ture to analyze and forecast the distribution of freight flows.
Nguyen et al. (2012) discuss a three-stage firm relocation model wherein spatial correlation between zones has been implemented in the error term and spatial interactions among firms in the deterministic part. Klier and McMillen (2008) provide a description of the generalized method of moments spatial Logit to model the clustering of the auto supplier establishments.
1.4.2 C 3 (P 2)
Chapter 3 continues with a discussion on further attempts to incorporate spatial effects into establishments location choice models. It highlights the fact that, whenever a distance metric has been used to implement a spatial aspect into the establishments location models (see the research of Dubé et al., 2016; Bhat et al., 2014; Liviano-Solís and Arauzo-Carod, 2013; Lambert et al., 2010; and Klier and McMillen, 2008), the Euclidean distance is employed. The debate in
this chapter demonstrates that there are insights to be gained by mindfully reconsidering and measuring distance depending on a given problem, such as a high congestion, speed limits, or physical uncrossable barriers which can diminish or totally eliminate the linkage between neighboring areas. Alternative distance metrices can be proposed and tested. Several articles, including the ones by Miller (2004, 2003) and the sudies by Combes and Lafourcade (2005), Graham (2007), Duran-Fernandez and Santos (2014), Weisbrod (2008), Faber (2014), Kwon (2002), Boscoe et al. (2012), Chalasani et al. (2005), or Rietveld et al. (1999) encourage the use of realistic distance metric based on the transport network over geographical distance metrics.
1.4.3 C 4 (P 3)
Most of the analyses on establishments location choices presented in two previous chap-ters treat only one selected activity sector at a time, typically industrial or retail activities. Very few empirical studies,e.g., Chatman et al. (2016) or Buczkowska and Lapparent (2014)
de-velop models for a number of various sectors, still, these models are analyzed independently, without considering strategic interactions between the sectors. Literature revised in Chapter 4, especially works of Ellickson and Misra (2011, 2012), Aguirregabiria and Mira (2007), Zhu and Singh (2009), Jia (2008), Seim (2006), Berry (1992), Bresnahan and Reiss (1991a), Dra-ganska et al. (2008) help understand why it is worth considering within- and inter-industry interactions. An excellent review of Draganska et al. (2008) gives a classification of possible modeling choices along plural dimensions, in the informational, temporal contexts, consider-ing the timconsider-ing of moves, and the discrete, continuous, or mixed decisions of establishments.
Our context is a static discrete game of incomplete information. An establishment’s payoff from choosing a particular location depends on its expectation of the optimal location choices of its competitors and exogenous market characteristics (Zhu and Singh, 2009). Based on the expected distribution of other agents across market locations, each establishment selects the location that maximizes its payoff given its own type (Seim, 2006).
1.4.4 C 5 (P 4)
The literature of Chapter 5 starts with the work of Teitz (1968) who introduces the idea that a firm can serve the market from multiple locations in the context of Hotelling’s linear city model. Since then other researchers, such as Thill (1997), Chu and Lu (1998), Pal and Sarkar
(2002), Janssen et al. (2005), Karamychev and van Reeven (2009), Iida and Matsubayashi (2011), Takaki and Matsubayashi (2013), Neven (1987), Peng and Tabuchi (2007), Granot et al. (2010), or Nishida (2015) have been proposing multi-store firms location models.
The light is then shed on the research by: Yang (2015) and Igami and Yang (2015), who study Canada’s fast-food hamburger industry comprised of five substitutable chains; Toivanen and Waterson (2005), who analyze fast-food restaurants in the UK; and Thomadsen (2005), who focuses on two fast-food chains in California. For comparison, three other studies are men-tioned in Chapter 5: Nishida (2015) on convenience-store chains in Japan, Schiraldi et al. (2013) and Holmes (2011) on the UK supermarket industry.
Chapter 5 pronounces the fact that store-location models typically do not consider compet-ing rival-chain stores and the strategic interactions between stores within the same chain. The profitability is a function of playeri’s entire network and the competitors’ networks (Nishida,
2015). The literature on business stealing and learning effects, cannibalization effects and economies of scale described in Chapter 5 (see,e.g., Toivanen and Waterson, 2005;
Aquirre-gabiria and Suzuki, 2015) is not consistent in specifying which of these effects has a prevailing influence on location decisions and depends on the store type. In addition, Nishida (2015) and Toivanen and Waterson (2005) incorporate some form of spatial competition, demonstrating that the store’s profitability is influenced by stores in the same location and by those in the adjacent locations, incorporating the interdependence of markets.
2
Location choices of newly-created
establishments: Spatial patterns at the
aggregate level
A This paper explores the problems associated with the location choice of newly-created establishments at the aggregate level. Although much work has been done in this domain, several issues arise when analyzing involved phenomena, which scholars have yet to fully explore: (1) addressing the excess of zeros problem in the location choice model in highly heterogeneous geographic areas and (2) determining an appropriate way to accommo-date spatial effects for location decisions. We tested models that include both stocks of pre-existing establishments and variables that represent measures of accessibility to the workforce and population, proximity to shops, services, transport infrastructure, availability of land, as well as prices and tax levels. We concluded that an establishment does not act in isolation dur-ing its decision-makdur-ing processes and that it is likely to be influenced by other establishments located nearby. When selecting the appropriate location in which to set up in the market, an establishment may consider not only the characteristics of a particular area, but also the
characteristics of neighboring zones. Having estimated 84 nested and non-nested count data models, we found that the hurdle models are preferred for taking into account the presence of excess zeros. Hurdle models offer greater flexibility in modeling zero outcomes and relax the assumption that the zero observations and the positive observations come from the same data generating process. In addition, the paper finds that the models tested with the distance matrix indicate that the incorporation of spatial spillovers leads to an enhancement in the models’ performance.
Keywords: location choice model, count data model, hurdle model, spatial spillovers
JEL Classification: C35, D21, R12 2.1 I
The present paper explores the problems associated with the location choice of newly-created establishments at the aggregate level within the Paris metropolitan area in the year 2007. Applications of disaggregate discrete choice modeling to analysis of birth, death, evo-lution, and location of establishments in the Paris region have been carried out by de Palma et al. (2008) and Motamedi (2008). We also refer the reader to the European SustainCity Project1. Much work has been done in this domain. However, several issues arise when
ana-lyzing involved phenomena, which scholars have yet to fully explore, most notably the excess of zeros problem in the location choice model in highly heterogeneous geographic areas and determining an appropriate way to incorporate spatial effects into the model. For example, spatial effects can be divided into two categories: the first considers the interactions between establishments that do not act in isolation and are thus likely to be influenced by the decisions of other players in the market, while the second looks at correlations across alternative choices. Inspired by spatial econometrics techniques,e.g., Anselin (1988), Lambert et al. (2010), Klier
and McMillen (2008), we seek solutions to these and related problems.
The proposed approach is descriptive, aggregate. For the purposes of the present research, all data are gathered at the municipality level. In the first step, we estimate standard non-spatial nested and non-nested count data models. In the second step, we run these count data models that accommodate spatial spillovers for location decisions. We compare all the obtained results and choose the best performing hurdle-Poisson model, after which a more
1See http://www.sustaincity.org/publications.
thorough interpretation of its results is undertaken.
The need to specify the model becomes apparent when dealing with various types of lo-cation choice models, which range from those focusing on employment lolo-cation estimated at the job level to those which focus on establishment or firm location and the associated decision-making processes. Implementing the latter form of location choice models, we ac-knowledge that the decision to open a new unit is made at the establishment or firm level. We define an establishment as a distinct economic unit that produces goods or services at a single physical location. In contrast, a firm is a legal entity that consists of one or more establish-ments under common ownership and control (van Wissen, 2000). Thus, it is a newly-created establishment that offers job opportunities to members of a given population provided they possess the appropriate skills and desired characteristics. For this reason, the unit of analysis on which we focus is that of the establishment.
The rest of the paper is organized as follows. In Section 2.2, we review the literature on both location choice models and the initial attempts to incorporate spatial effects into such models. In Section 2.3, we characterize the area of study, which is the Paris region. In Section 2.4, we detail our data along with their statistical sources and their harmonization in order to carry out the empirical application. Descriptive statistics are presented in Section 2.5. We give a brief overview of the count data models and develop our parametric statistical model in Section 2.6, starting from the Logit-Poisson model, a type of hurdle-Poisson model, and discuss how to extend it in order to meet the needs of the present research. In Section 2.7, the results from our research are discussed. In the final section, we conclude and elaborate on extensions of the proposed approach.
2.2 R 2.2.1 L
A number of empirical studies suggest variables that play a significant role in influencing the establishment’s location choice. We briefly describe those which are most relevant. Ac-cording to Arauzo-Carod (2005) and Maoh (2005), an establishment will decide to enter a market if it detects a potential business opportunity and if the capital and human resources are available. An establishment must choose a type of activity that reflects both its techno-logical and organizational level and its minimum size. With these parameters in mind, the
tablishment makes a decision as to where to locate. Since choosing a particular area in which to locate is critical to the establishment’s success or failure (Strotmann, 2007), the main task of the establishment is to identify the places which offer the highest possible potential profit. Local economic climate in terms of its ability to attract new entrants, as well as the structure of establishments at the local level are other factors that can influence the decision (Liviano-Solís and Arauzo-Carod, 2014). Locations with lower input costs are also more likely to experience a higher number of births of new establishments (Rocha, 2008).
Sutton (2007) notices that ranking sectors according to the degree of (entry-exit) turbu-lence appears to offer similar results across countries, suggesting that there are some sector-specific factors at work in molding this pattern. Rocha (2008) and Liviano-Solís and Arauzo-Carod (2014) concur, finding that local employment density attracts new entrants in related sectors and has a positive impact on the establishment’s productivity. However, when this density is too high, the effect becomes negative due to congestion costs, including for ex-ample, high land prices and costly commuting. This results in an inverted U-shape profile between the effect of concentration of economic activity and site attractiveness. The rela-tionship is initially positive, but becomes negative after a certain threshold is crossed. Maoh and Kanaroglou (2005, 2007) state that agglomeration effects tend to be more significant in particular activity sectors, such as retail and services.
Local authorities try to offer different incentives in a bid to attract establishments to less de-veloped areas and accelerate the development of the whole region. These include, but are not limited to, supply of infrastructure, designation of new building zones, and tax reductions. Empirical results from various studies undertaken in different countries worldwide demon-strate that these policies may have positive, negative, or neutral effects on the location choice and activity distribution.
Special local fiscal arrangements are common practice for attracting establishments and have received considerable attention from economists (e.g., BondonioandGreenbaum, 2007).
Offers of subsidies and tax reductions are popular yet controversial tools. Low taxes are an-other common instrument to attract establishments. Tax reductions show positive effects on activity development. Switzerland is a prime example (Bodenmann, 2011). Devereux et al. (2007) show that in the UK the impact of subsidies is rather small on the location choice but they are more effective in dense areas when a large number of establishments is already present. Bondonio and Greenbaum (2007) show that in the US enterprise zone programs
(EZ thereafter), which hope to convince establishments to locate in less developed zones by offering them subsidies, have a significant positive impact on the creation of new establish-ments. However, they also show that EZ policies tend to increase business closures. Neumark and Kolko (2010) show that the overall impact of the EZ program in California is ineffective and causes no positive impact on the number of jobs.
Providing special infrastructure is an effective but costly way to raise the attractiveness of a region. De Bok (2004) shows that accessibility has a positive effect on business services. Bo-denmann and Axhausen (2012) claim that this also holds for other sectors and demonstrate that interventions regarding transport infrastructure have a larger impact in the densely pop-ulated areas of Switzerland. Devereux et al. (2007) show that the effects of transport infras-tructure projects are unequally distributed spatially. All actions have larger impacts in denser regions. Siebert (2000) states that increasing accessibility has a relatively small effect on re-gional development.
Bodenmann and Axhausen (2010) summarize how the significance of location factors has changed over time. In the 1990s, the most critical location factors were human capital, agglom-eration effects, and accessibility. Currently, a positive economic climate and direct costs (earn-ing levels, tax burdens, etc.) play larger roles. More curious readers are encouraged to acquaint themselves with the referenced literature and the work of Arauzo-Carod et al. (2010). They provide a review of over fifty papers on location choice modeling with a focus on the analyses of location decisions of new industrial establishments or firms using appropriate econometric models. They describe the establishment/firm location determinants, the econometric meth-ods used in these investigations, and their principal results2.
2The most commonly used establishment/firm location determinants and the signs of their estimates used
in both discrete choice and count data models according to the review of Arauzo-Carod et al. (2010) are: agglom-eration economies (+,-: positive or negative effect), previous entries in the own sector (+), existing plants (+), own-industry employment (+), sectoral diversity (+,-), sectoral specialization (+,-), market size (+), establish-ment/firm size (+), productivity (+), unemployment (+,-), industrial employment share (+), services employ-ment share (+), business services (+), share of employees in R&D (+), human capital (+,-), knowledge spillovers (+), skilled workforce (+), education (-), schooling (+), existence of high schools (+), overall R&D investment (+), R&D facilities (+), high-ranking hotels (+), population density (+,-), distance to urban areas (-), land area ), land costs (-), entry costs (-), taxes (-), corporate tax rate ), taxes on labor (-), labor costs ), wages (+,-), income per capita (+(+,-), purchasing power per inhabitant (+(+,-), GDP (+(+,-), poverty (-(+,-), local demand (+(+,-), supplier accessibility (+), government spendings (+), promotional subsidies (+), labor and capital subsidies (+), economic promotion (+), investment climate (+), infrastructure (+), transportation infrastructure (+), road infrastructure (+), distance to highway (-), rail infrastructure (-), airports facilities (+), travel time to airport (-), energy costs (+,-), and environmental regulation (-).
2.2.2 F
-As underscored by Nguyen et al. (2012), an establishment does not act in isolation dur-ing its decision-makdur-ing process and is likely to be influenced by other establishments located nearby. When choosing an appropriate place in which to set up in the market, an establish-ment can take into account not only the characteristics of a particular area but also those of its surroundings. The reason for doing so is the spatial dependence of neighboring areas. In addition, the degree of spatial correlations is expected to be greater among choice alternatives (the options available to the decision-maker) that are close to one another. Jayet (2001) proves the existence of interactions among units located in space and demonstrates that their inten-sity decreases with distance. Thus, two types of spatial effects may be considered: (1) interac-tions between establishments and (2) dependencies among alternatives. Spatial effects can be incorporated in location choice models when modeling the observable explanatory variables and the unobservable components. However, most often, these spatial effects are either not properly treated or are completely ignored in the analysis of the establishment’s location. An example of the former can be seen in Bhat and Guo (2004) who model the spatial dependence using the mixed Logit model, with an arbitrary spatial allocation instead of basing these spa-tial effects on a systematic specification. Furthermore, even if spaspa-tial effects are present they are not incorporated in traditional discrete choice models. For instance, multinomial Logit models (MNL) are commonly used in location choice processes, yet they are based on several simplifying assumptions, such as independent and identical Gumbel distribution (i.i.d.) of random components of the utilities and the absence of heterogeneity and autocorrelation in the model. These simplifying assumptions limit the ability of the model to represent the true structure of the choice process (Mohammadian et al., 2005).
Traditional discrete choice modeling methods are often based on the assumption of inde-pendence among choice alternatives, which according to Sener et al. (2011) is not appropriate. Furthermore, Sener et al. (2011) claim that the estimations of the parameters of the standard Logit models are biased and inconsistent. Instead, they suggest using the generalized spatially correlated Logit (GSCL) to model the residential location choice behavior and they incorpo-rate the correlations between the alternatives. Their model can be enhanced to accommodate random taste variations across decision-makers. The authors compare the results obtained
with their GSCL model against those obtained using the standard multinomial Logit and the spatially correlated Logit (for which only correlations between the adjacent alternatives are considered). Moreover, they do not limit themselves to a few choice alternatives since GSCL models eliminate the need for any kind of simulation and can be estimated by direct maxi-mum likelihood techniques. They criticize prior studies that were carried out with a limited number of alternatives in the choice set. Miyamoto et al. (2004) estimate a mixed Logit model with the error autocorrelation and an autocorrelated deterministic component of utility us-ing residential location choice data for only four zones in the city of Sendai in Japan. Garrido and Mahmassani (2000) recommend using a multinomial probit (MNP) model with spatially and temporally correlated error structure to model (analyze and forecast) the distribution of freight flows over space and time at the operational or tactical levels of planning. They use Monte-Carlo simulation with a choice set of 31-41 location alternatives.
It is worth mentioning here the 2010 paper by Smirnov (2010), which develops a new spatial random utility framework where individual decision-makers are spatially dependent in their preferences. In addition, pseudo maximum likelihood estimator is consistent and computa-tionally feasible for large datasets. The author discusses recent developments of spatial discrete choice models and classifies them by the type of spatial effect and the way it is incorporated in the model.
The literature is scarce on previous attempts to incorporate spatial effects in an establish-ment’s or firm’s (re-)location decision process. Vichiensan et al. (2005) confirm that discrete choice models are applied mainly in the field of transport choice analysis and have been con-tinuously developed for years. However, less attention has been put into the research and development of location choice models. Location choice models differ substantially from transport choice models given that they use geo-referenced data, for which choice sets have an explicit spatial component. For this reason, it is important to understand and represent spatial correlation in location choice models. Nguyen et al. (2012) offer a three-stage firm relocation process: a firm first takes a decision on whether to stay in its actual location or to move, it then chooses the region and, finally, chooses the zone in which to relocate. The authors incorpo-rate spatial interactions among firms in the deterministic part and spatial correlation between zones in the error term (the generalized autoregressive term is used to explain the spatial corre-lation between the zones). Nevertheless, certain aspects of their research paper can be further improved: for instance, the accessibility of the region used in the analysis is estimated,
lowing Allen et al. (1993), as a linear function whereas a non-linear function could have been proposed instead. Klier and McMillen (2008) use a GMM spatial Logit model that can be applied to the large samples to account for the clustering of auto supplier establishments in the US.
Thus, in spite of recognizing the importance of incorporating spatial interactions in loca-tion choice models (and establishment localoca-tion choice models in particular), research is insuf-ficient on this topic due to lack of data at the micro level, to numerous alternatives in location choice processes, and to difficulties in defining and representing the spatial effects and in mea-suring spatial dimensions (Sener et al., 2011). Inspired by spatial econometrics techniques (e.g.,
Jayet, 2001 and Anselin, 1988, 2003) and drawing from a rich database, we try to find some so-lutions to the above-stated problems and present our ideas in this paper. We wish to combine the methods used to produce location choice models with spatial econometric techniques by examining the role of space in in these models. This is a new and challenging field of research. 2.3 S
In this paper, we concentrate our research on the Paris region, also known as ele-de-France. ele-de-France is a vibrant and innovative region with over 5,6 million jobs, 37% of French ex-ecutives, and 40% of national workforce in research and development3. Yet, the Paris region’s
economy is also spatially unbalanced (Combes et al., 2011). ele-de-France is divided into eight
départements - French administrative units consisting of 1300 municipalities that cover the
city of Paris and its suburbs4. While the Paris region represents only 2.2% of the surface of
France, over 19% of the country’s population reside in this area (11.7 million)5. The GDP of
the region amounts to 29% of total French GDP (IAU IdF, 2014). Large differences in pop-ulation and employment densities are to be found between Paris and its outer periphery. As illustrated during the 2011 OECD Meeting, many issues continue to stand in the way of im-proving the situation in the suburbs (de Palma, 2011), such as poor access to public services and infrastructure.
3See
http://www.iau-idf.fr/lile-de-france/un-portrait-par-les-chiffres/lile-de-france-capitale-de-rang-mondial.html.
4The Paris region consists of the Paris City, the inner ring withdépartements 92, 93, 94, and the outer ring
withdépartements 77, 78, 91, and 95.
5See http://www.iau-idf.fr/lile-de-france/un-portrait-par-les-chiffres/population.html. Data are for the
year 2009.
The Grand Paris is a development project for the whole of the Paris metropolitan area. It is designed to improve residents’ quality of life, address regional inequalities, and build a sustainable city6. This project aims to link major territorial development contracts raising
the attractiveness of the entire Paris metropolitan region. Estimates are that it will attract 1.5 million people, create or relocate 1 million jobs by 2030 and cost around 32.4 billion euros. Urban planners are likely to connect economically promising areas; yet, they could also use transport infrastructure to link the physically deteriorated, poorly planned areas in a bid to stimulate their development.
2.4 D
Many different data sources were compiled for the present study, drawn primarily from the Census survey of establishments for the years 2003-20117. Changes in nomenclature and
definitions, as well as availability of data, meant that the year 2007 was used to run the models and generate the descriptive statistics. Data are pooled across activity sectors and additional data are drawn from other sources to build the final sample we used for estimation.
Local population and workforce are described by various characteristics, such as socio-professional class and education level. These data were gathered by the General Census and provided by the French National Institute of Statistics and Economic Studies (INSEE) for the years 2006-2009. French National Census of Population (RGP) provides us with infor-mation on the total number of trips made between work and home for the years 2006-2009. The Public Finances General Directorate provided information on income imputation and tax levels for 1998-2008. We also collected data on the rate of business and residence taxes for the years 2002-2010. Data on business taxes were only available for about half of the analyzed municipalities and the missing 563 out of 1300 values could not be implemented. For this rea-son, information on business taxes was not used to run the models. On the other hand, data on residence taxes paid per municipality were available for all the municipalities.
The Callon database enabled us to gather detailed information on the average price and rent levels per square meter for new, renovated, and pre-existing non-renovated offices, for first class shops (the most exclusive shops), for second and third class shops (the least exclusive
6See https://www.societedugrandparis.fr.
7The Census survey was carried out yearly until the year 2011 by the French National Institute of Statistics
and and Economic Studies.