RESEARCH OUTPUTS / RÉSULTATS DE RECHERCHE
Author(s) - Auteur(s) :
Publication date - Date de publication :
Permanent link - Permalien :
Rights / License - Licence de droit d’auteur :
Bibliothèque Universitaire Moretus Plantin
Dépôt Institutionnel - Portail de la Recherche
researchportal.unamur.be
University of Namur
A NAD-dependent glutamate dehydrogenase coordinates metabolism with cell division
in Caulobacter crescentus
Beaufay, François; Coppine, Jérôme; Mayard, Aurélie; Laloux, Géraldine; De Bolle, Xavier;
Hallez, Régis
Published in:
The EMBO journal
DOI:
10.15252/embj.201490730
Publication date:
2015
Document Version
Publisher's PDF, also known as Version of record
Link to publication
Citation for pulished version (HARVARD):
Beaufay, F, Coppine, J, Mayard, A, Laloux, G, De Bolle, X & Hallez, R 2015, 'A NAD-dependent glutamate
dehydrogenase coordinates metabolism with cell division in Caulobacter crescentus', The EMBO journal, vol. 34,
no. 13, pp. 1786-1800. https://doi.org/10.15252/embj.201490730
General rights
Copyright and moral rights for the publications made accessible in the public portal are retained by the authors and/or other copyright owners and it is a condition of accessing publications that users recognise and abide by the legal requirements associated with these rights. • Users may download and print one copy of any publication from the public portal for the purpose of private study or research. • You may not further distribute the material or use it for any profit-making activity or commercial gain
• You may freely distribute the URL identifying the publication in the public portal ?
Take down policy
If you believe that this document breaches copyright please contact us providing details, and we will remove access to the work immediately and investigate your claim.
A NAD-dependent glutamate dehydrogenase
coordinates metabolism with cell division in
Caulobacter crescentus
François Beaufay
1, Jérôme Coppine
1, Aurélie Mayard
1, Géraldine Laloux
2, Xavier De Bolle
1&
Régis Hallez
1,*Abstract
Coupling cell cycle with nutrient availability is a crucial process for all living cells. But how bacteria control cell division according to metabolic supplies remains poorly understood. Here, we describe a molecular mechanism that coordinates central metabolism with cell division in the a-proteobacterium Caulobacter crescentus. This mechanism involves the NAD-dependent glutamate dehydrogenase GdhZ and the oxidoreductase-like KidO. While enzymatically active GdhZ directly interferes with FtsZ polymerization by stimulating its GTPase activity, KidO bound to NADH destabilizes lateral inter-actions between FtsZ protofilaments. Both GdhZ and KidO share the same regulatory network to concomitantly stimulate the rapid disassembly of the Z-ring, necessary for the subsequent release of progeny cells. Thus, this mechanism illustrates how proteins initi-ally dedicated to metabolism coordinate cell cycle progression with nutrient availability.
Keywords cell division; cytokinesis; FtsZ; GdhZ; glutamate dehydrogenase Subject Categories Metabolism; Cell Cycle; Microbiology, Virology & Host Pathogen Interaction
DOI 10.15252/embj.201490730 | Received 5 December 2014 | Revised 14 April 2015 | Accepted 21 April 2015
Introduction
Cell division is a key process to ensure survival, development, and spreading of all living beings. At the heart of this mechanism, self-assembly proteins play a crucial role (Margolin, 2000; Osteryoung, 2001). In eukaryotes, actin and myosin drive cell constriction, whereas microtubules form the mitotic spindle. In prokaryotes, the actin-like ATPase MreB and the tubulin-like GTPase FtsZ control cell growth and cytokinesis (Karsenti & Vernos, 2001; Margolin, 2009; Laporte et al, 2010). Accordingly, self-assembly proteins are targeted by checkpoints all along the cell cycle. For instance,
cyclin-dependent kinases trigger the assembly of the mitotic spindle upon completion of DNA replication (Li & Zheng, 2004; Yokoyama & Gruss, 2013), while the nucleoid occlusion system inhibits FtsZ poly-merization over the replicating chromosome and thereby prevents genome bisection (Wu & Errington, 2004; Bernhardt & de Boer, 2005). In vitro, FtsZ self-assembles in a GTP-dependent manner into protofilaments, which in turn associate through lateral interactions into structures of higher complexity (Mukherjee & Lutkenhaus, 1994; Erickson & Stoffler, 1996; Gonzalez et al, 2003). In vivo, FtsZ assembles at the division site into a dynamic ring-like structure, called the Z-ring, where it acts as a scaffold for the recruitment of cell division proteins and plays an active role in cytokinesis (Goehring & Beckwith, 2005; Li et al, 2007; Goley et al, 2011). Although the exact molecular mechanism by which the Z-ring disassembly drives cell constriction in vivo is still under intense debate, GTPase activity and lateral interactions play a crucial role in this process (Monahan et al, 2009; Dajkovic et al, 2010; Erickson et al, 2010; Osawa & Erickson, 2011). A recent study showed that the Z-ring is very likely continu-ous, composed of either overlapping shorter filaments or a single filament rolled up on itself (Szwedziak et al, 2014). Most impor-tantly, the authors proposed that cell constriction requires the fila-ments to slide along each other (Szwedziak et al, 2014). Although lateral interactions between FtsZ filaments would play a direct role in this process, the GTPase activity might be crucial in vivo to initiate Z-ring disassembly as well as to maintain the dynamic state of the Z-ring, essentially by stimulating filament shrinkage (Stricker et al, 2002; Osawa & Erickson, 2011; Szwedziak et al, 2014).
The a-proteobacterium Caulobacter crescentus is a powerful
model to study cell division control since it divides asymmetrically to give rise to two different daughter cells, a small swarmer cell and a large stalked cell. The sessile stalked cell initiates DNA replication (S phase) shortly after the previous cytokinesis, whereas the motile swarmer cell first enters in a non-replicative G1 phase (Fig 1A). The swarmer cell then differentiates into a stalked cell by ejecting the polar flagellum, retracting the polar pili, and synthesizing a stalk at the same pole. This swarmer-to-stalked cell transition coincides with the initiation of DNA replication (G1-to-S transition). Although
1 Bacterial Cell Cycle & Development (BCcD), URBM, University of Namur, Namur, Belgium 2 de Duve Institute, Université catholique de Louvain, Brussels, Belgium
the Z-ring is built up at the onset of the S phase, cell constriction only starts at the early predivisional stage (late S phase) and is followed by a rapid contraction of the Z-ring in late predivisional stage (G2 phase) (Degnen & Newton, 1972; Osley & Newton, 1980; Holden et al, 2014).
Among the regulators of FtsZ identified so far, only few have been described to coordinate cell division with metabolism (Kirkpatrick & Viollier, 2011). The glucosyltransferases, UgtP in Bacillus subtilis and OpgH in Escherichia coli, interfere with FtsZ dynamics to delay cell division, allowing cells to adapt their size according to nutrient availability (Weart et al, 2007; Hill et al, 2013). In contrast to E. coli or B. subtilis, C. crescentus does not vary its cell length in response to changes in nutrient availability (Campos et al, 2014). Nevertheless, the small NAD(H)-binding protein KidO has been proposed to coordinate cell division with the metabolic state of the cell (Radhakrishnan et al, 2010). KidO prevents premature Z-ring formation during G1 phase and promotes Z-ring disassembly in G2 phase, but cannot interfere with FtsZ during S phase since it is degraded by the ClpXP protease at the G1-to-S transition (Radhakrishnan et al, 2010). However, the exact mechanism used by KidO to modulate FtsZ dynamics remains unknown.
Here, we identified a conserved bifunctional NAD-dependent glutamate dehydrogenase (GDH) that controls Z-ring disassembly. A
GDH catalyzes the interconversion of glutamate intoa-ketoglutarate
and ammonia by using NAD(P)H as a cofactor, thereby bridging Krebs and nitrogen cycles (Fig 1B) (Minambres et al, 2000). We
show that GdhZ (for glutamate dehydrogenase interacting with FtsZ) stimulates cell constriction during cytokinesis by directly interfering with Z-ring stability and that GDH activity is essential to mediate this effect. In addition, we found that GdhZ and KidO use different molecular mechanisms to stimulate depolymerization of FtsZ, but share the same regulatory network to synergistically prevent premature Z-ring formation in G1 swarmer cells and to trig-ger Z-ring disassembly in G2 predivisional cells. This mechanism illustrates how bacteria can adapt their cell cycle according to nutri-ent availability.
Results
A NAD-dependent glutamate dehydrogenase interacts with FtsZ To find additional regulators of FtsZ, a yeast two-hybrid screen was performed using a prey library of random genomic DNA fragments of C. crescentus (see details in Supplementary Materials and Methods). We fished out a fragment encompassing the uncharacterized CCNA_00086 gene (here referred to as gdhZ), coding for a NAD-dependent GDH. To provide biochemical evidence that GdhZ and FtsZ are part of the same complex, lysates from strains in which gdhZ was replaced by either 3FLAG-gdhZ or gdhZ-3FLAG were subjected to
immunoprecipitation with a-FLAG antibodies. These experiments
showed that FtsZ was co-purified with both GdhZ fusions, further supporting the interaction between GdhZ and FtsZ (Fig 1C).
gdhZ deletion leads to a severe cell division defect
By interacting with FtsZ, GdhZ might regulate cell division. To address this question, we first generated an in-frame deletion of gdhZ (DgdhZ) and found that DgdhZ cells displayed a large cell size heter-ogeneity with a high proportion of tiny and filamentous cells (Fig 2A
and B). TheDgdhZ mutant also exhibited a serious growth defect,
with a doubling time of ~165 min in complex media (PYE) compared
2 G S
1 G
Motile swarmer cell Sessile stalked cell Predivisional cell
FtsZ MreB
A
B
α-ketoglutarate Glutamate Glutamate Glutamine ADP+Pi ATP acetyl-CoA NAD+ NADH+H+ Xylose Histidine Proline Arginine NH4+ Nitrogen cycle Glucose NH4+ oxaloacetate Fumarate α-ketoglutarate TCA GdhZC
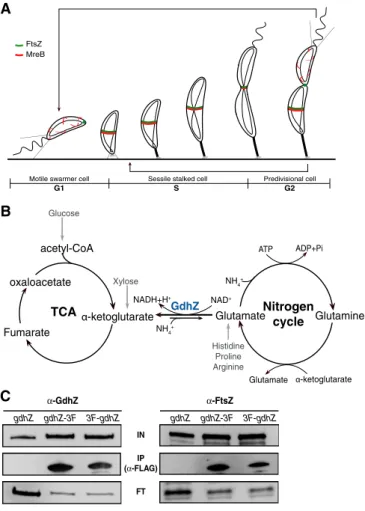
α-GdhZ IP (α-FLAG) IN gdhZ-3F gdhZ 3F-gdhZ gdhZ gdhZ-3F 3F-gdhZ α-FtsZ FTFigure 1. The NAD-dependent glutamate dehydrogenase GdhZ interacts with FtsZ in Caulobacter crescentus.
A Caulobacter crescentus cell cycle. During the G1 phase, the growth of the swarmer cell is controlled by the actin-like protein MreB (Aaron et al, 2007) and FtsZ is localized at the new pole. Upon initiation of DNA replication (G1-to-S transition) and differentiation (swarmer-to-stalked transition), FtsZ polymerizes at midcell where it recruits MreB and all the other cell division proteins. Once DNA replication is complete, constriction starts at the end of the S phase to finally lead to septation (G2 phase) and the release of a small swarmer cell and a large stalked cell.
B GdhZ is a NAD-dependent glutamate dehydrogenase (GDH), which catalyzes the interconversion of glutamate into a-ketoglutarate and ammonia, bridging the tricarboxylic acid cycle (TCA) with the nitrogen cycle. GdhZ is essential in vivo for the catabolism of histidine, proline, arginine, glutamine, and glutamate, since it constitutes the only entry point into the TCA.
C Co-immunoprecipitation (Co-IP) experiments showing that GdhZ can pull down FtsZ. Co-IP were performed on protein extracts of wild-type (RH50), gdhZ-3FLAG (RH728), and 3FLAG-gdhZ (RH743) strains. GdhZ and FtsZ were detected by Western blotting using respectively anti-GdhZ and anti-FtsZ antibodies before (IN) and after immunoprecipitation (IP) with anti-FLAG antibodies. Proteins not immunoprecipitated were detected in flow-through (FT) fractions.
> wt (2.64 +/- 0.6 µm) ∆gdhZ (2.53 +/-1.3 µm)
A
i size (µm) cells (%) Zst f K9 7 E gdhZB
∆gdhZ ∆gdhZ ∆gdhZ wt ∆gdhZ 0 hr 1 hr P vanA ::ftsZ-yfp 3 hrsC
α-FtsZ α-MreB wtD
Zst fE
∆gdhZ P xylX ::venus-gdhZi
ii
0 hr 3.0 ± 0.8 µm 3.1 ± 2.1 µm 3 hrs PxylX::venus-gdhZ α-GdhZ α-MreB gdhZ-gfp 0 hr 1 hr 3 hrs 12 hrsTime post-xylose induction
F
12 hrs
3.6 ± 5.5 µm Figure 2. Inactivation of gdhZ leads to a severe cell division defect.
A Cell size distribution of wild-type (RH50) and DgdhZ (RH534) strains grown in complex PYE media. The cell length was measured by using MicrobeTracker software (Sliusarenko et al, 2011). The mean cell size ! standard deviation (in lm) of the different strains is indicated in brackets.
B Phase contrast imaging of wild-type (RH50), DgdhZ (RH534), ftsZE79K(NR6102), and ftsZE79KDgdhZ (RH1329) strains, showing that combination of ftsZE79Kwith DgdhZ leads to a conspicuous filamentation. Scale bar, 5 lm.
C Expression of ftsZ-yfp suppresses DgdhZ cell division defect over time. Wild-type (RH53) and DgdhZ (RH853) cells bearing an additional copy of ftsZ fused to yfp at the vanA locus (PvanA::ftsZ-yfp) were grown in PYE and imaged at different timepoints following induction of ftsZ-yfp expression with 0.5 mM vanillate. Scale bar, 5 lm. D Immunoblot of FtsZ and MreB steady-state levels in wild-type and DgdhZ cell lysates showing that both strains have similar amount of FtsZ proteins. Protein
extracts were prepared from wild-type (RH50) and DgdhZ (RH534) strains, and twofold serial dilutions of cell lysates were separated on SDS–PAGE. The relative abundance of FtsZ and MreB intensities was quantified using ImageJ software, normalized according to the dilution factor. FtsZ levels were finally normalized according to MreB (FtsZ/MreB 100% in wild-type versus 103% in DgdhZ).
E Overexpression of gdhZ leads to cell filamentation. DgdhZ cells expressing a venus-gdhZ fusion from PxylXat the xylX locus (RH740) were grown in PYE and imaged at different timepoints following induction of venus-gdhZ expression with 0.1% xylose. Scale bar, 5 lm.
F Immunoblot of GdhZ and MreB showing levels of Venus-GdhZ increased over time in cells overexpressing venus-gdhZ. Proteins extracts were prepared from DgdhZ PxylX::venus-gdhZ (RH740) strain at the indicated timepoints after xylose induction and separated on SDS–PAGE. The level of GdhZ-GFP in strain RH602 was used as a control.
to ~85 min for the wild-type strain (Supplementary Fig S1). In addition, the proportion of late predivisional (constricting) cells, that is, predivisional cells with a visible ongoing constriction, was
signifi-cantly (P < 0.001) higher in DgdhZ (~25%) than in wild-type
(~10%). Surprisingly, DgdhZ phenotypes were rescued when
glucose, xylose, or alanine was added to PYE or used as the sole carbon source in synthetic media (Supplementary Fig S1 and data not shown). None of these carbon sources does require GDH activity to be catabolized in vivo. In contrast, amino acids feeding the Krebs cycle thanks to GdhZ activity (i.e. glutamate, histidine, proline, arginine, and glutamine; Fig 1B) did suppress neither growth nor cell
division defects ofDgdhZ (data not shown). These results indicate
that GdhZ might regulate cell division according to the carbon source used and that GDH activity might be essential for this regulation.
As the proportion of late predivisional cells was abnormally high
in theDgdhZ strain, we asked whether the deletion of gdhZ could
specifically affect the G2 phase of the cell cycle. Flow cytometry analyses of the DNA content over the cell cycle showed that G1 and
S phases were similar in both wild-type andDgdhZ strains
(Supple-mentary Fig S2). Likewise, the timing of localization of the G1-to-S transition markers MipZ-CFP (Thanbichler & Shapiro, 2006) and
StpX-GFP (Hughes et al, 2010, 2013) was not affected in theDgdhZ
cells, supporting that GdhZ does regulate neither the G1 phase nor the transition to the S phase (Supplementary Fig S2). In contrast, the time spent at the division site by the late cell division marker TipN-GFP (Huitema et al, 2006; Lam et al, 2006; Goley et al, 2011)
was prolonged inDgdhZ cells (~60 min) in comparison with
wild-type cells (~15 min). These observations are consistent with the high number of predivisional (constricting) cells observed in a DgdhZ population and further support a role for GdhZ in cell
divi-sion. In the same line, combination ofDgdhZ with ftsZE79Kresulted
in an exacerbated filamentation (Fig 2B). Initially isolated as a
mutant that tolerates kidO overexpression, ftsZE79Kis still able to
sustain cell division despite a twofold reduced GTPase activity (Radhakrishnan et al, 2010). On the contrary, expression of a second
copy of ftsZ fused to yfp from an inducible promoter (PvanA
::ftsZ-yfp) suppressed the cell size heterogeneity (Fig 2C and
Supplemen-tary Fig S3A), but not the growth defect ofDgdhZ (Supplementary
Fig S3B). Indeed, after 3 h of induction with vanillate, the average
cell size ofDgdhZ cells varied from 2.0 ! 1.5 lm to 2.5 ! 0.8 lm,
a distribution similar to a wild-type population grown in the same conditions (2.7 ! 0.7 lm). This result prompted us to check whether intracellular level of FtsZ decreased in the absence of gdhZ. Quantification of immunoblot analyses revealed that FtsZ levels in DgdhZ cells corresponded to 103% of wild-type FtsZ levels (Fig 2D), suggesting that GdhZ does not control FtsZ levels but rather its dynamics. Finally, overexpression of gdhZ fused to venus from the inducible PxylXpromoter (PxylX::venus-gdhZ) gave rise to cell fila-mentation upon addition of xylose (Fig 2E and F), without seriously interfering with cell growth (Supplementary Fig S1E and F).
Altogether these results suggest that GdhZ is a metabolic regula-tor controlling late steps of cell division according to the carbon source catabolized by C. crescentus.
GdhZ regulates FtsZ dynamics in vivo
Since gdhZ is required for efficient cell division, we tested whether GdhZ controls FtsZ dynamics in vivo by monitoring the distribution
of FtsZ-YFP in wild-type and DgdhZ cells (Fig 3A). By plotting
FtsZ-YFP intensity profile along the cell length, we did not detect
any FtsZ misplacement in DgdhZ cells (Fig 3A). In contrast, we
found that the proportion of cells with a detectable medial Z-ring
was significantly (P < 0.001) higher in DgdhZ (87.5 ! 1.8%;
n = 672) than in the wild-type strain (70.4 ! 5.4%; n = 716). Simi-lar observations were made with MreB, which is recruited very early at the Z-ring (Goley et al, 2011), since 90.0 ! 2.6% (n = 937) of DgdhZ cells displayed a midcell localization for GFP-MreB versus 76.3 ! 3.5% (n = 635) for wild-type cells (P < 0.001). These results suggest that FtsZ could be prematurely recruited at the midcell in small G1 swarmer cells in the absence of gdhZ. To test that, we
determined the localization of FtsZ-YFP in wild-type and DgdhZ
small G1 swarmer cells (≤ 2lm). As expected, FtsZ-YFP was mostly
observed at a pole (75.7%, n = 70) and occasionally at midcell
(7.1%, n = 70) of wild-type cells ≤ 2lm. In DgdhZ cells ≤ 2 lm,
FtsZ-YFP localized more often at a midcell position (24.7%, n = 121), and less frequently at a pole (38.8%, n = 121). Thus, FtsZ
is prematurely assembled as a Z-ring inDgdhZ G1 swarmer cells. As
the expression of ftsZ-yfp suppresses DgdhZ cell division defects
(Fig 2C), we sought to use a strain expressing gfp-fzlC from the inducible xylX promoter (PxylX::gfp-fzlC) to monitor FtsZ localization throughout the cell cycle. Indeed, GFP-FzlC not only mirrors FtsZ localization (Goley et al, 2011), but most of all, its expression does
not mitigateDgdhZ phenotypes (data not shown). Time-lapse
exper-iments revealed that GFP-FzlC failed to disappear from the contract-ing Z-rcontract-ing in late predivisional cells, but also relocalized at the midcell of future daughter cells prior to the completion of cell
divi-sion inDgdhZ cells (Fig 3B).
These data indicate that GdhZ inhibits the formation and/or stability of the Z-ring, presumably in G2 phase to stimulate its disas-sembly and in G1 phase to prevent the asdisas-sembly of a new Z-ring before the constricting one is disassembled.
GdhZ colocalizes with FtsZ at midcell
To further characterize the role of GdhZ in cell division control, we determined its subcellular localization in strains expressing either gdhZ-gfp at the native gdhZ locus or venus-gdhZ from the inducible
PxylX promoter. Both GdhZ-GFP and Venus-GdhZ fusions
accumu-lated at a medial position (Fig 3C). Interestingly, GdhZ-GFP no longer localized at midcell when glucose or xylose was added to the culture medium (data not shown). Let’s remind that these two carbon
sources suppressed cell growth and division defects ofDgdhZ cells
(Supplementary Fig S1 and data not shown). Coexpressing gdhZ-gfp
and ftsZ-mcherry from the inducible PxylX promoter confirmed that
GdhZ-GFP fluorescence signal was enriched at or near the Z-ring (i.e. where FtsZ-mCherry localized) in more than 70% (n = 437) of cells displaying a GdhZ-GFP signal (Fig 3D). Similar results were obtained with GdhZ-GFP and mCherry-FzlC, since both proteins colocalized in ~65% of cells (Supplementary Fig S4A). In addition, demographic representations of GdhZ-GFP and FtsZ-mCherry signals allowed us to monitor the dynamic localization of both proteins along the cell cycle from a heterogeneous population. As expected, FtsZ-mCherry was found at one pole of small G1 swarmer cells before being relocated at a medial position in larger cells (Figs 1A and 3E). In contrast, GdhZ-GFP was not localized at one pole in small G1 swarmer cells (Fig 3E), but started to accumulate at midcell in larger cells, slightly
after the Z-ring was assembled at the division site (Fig 3E). This result suggests that GdhZ could be recruited at midcell directly by FtsZ. To test that, the localization of GdhZ-Venus and mCherry-FzlC was assessed in a strain where the only copy of ftsZ was under the control of the inducible PxylXpromoter. After 3 h of xylose depletion,
GdhZ-Venus still displayed a discrete localization (≤ 1 focus per cell), while mCherry-FzlC was mostly diffuse in the cytoplasm (Supple-mentary Fig S4B and C). However, GdhZ-Venus no longer concen-trated at midcell (Supplementary Fig S4D), suggesting that GdhZ midcell recruitment relies on FtsZ.
A
C
D
B
E
Figure 3. GdhZ regulates Z-ring dynamics in vivo.
A Localization of FtsZ-YFP determined by phase contrast and fluorescence microscopy of wild-type (RH53) and DgdhZ (RH853) cells expressing ftsZ-yfp from PvanAat the vanA locus. Expression of ftsZ-yfp was induced by adding 0.5 mM vanillate to the cultures 1 h before imaging. Scale bar, 5 lm. FtsZ-YFP signal from wild-type and DgdhZ cells was plotted according to the cell length. “0” and “1” correspond to the poles, and “0.5” to the midcell position.
B Time-lapse fluorescence microscopy of wild-type (RH1733) and DgdhZ (RH1734) cells harboring PxylX::gfp-fzlC, showing the dynamic localization of GFP-FzlC throughout the cell cycle. Cells were grown in PYE, and xylose was added 1 h before spotting cells on PYE agarose pad. Each picture was taken every 35 min. Arrows point to premature recruitment of GFP-FzlC at future division sites in daughter cells prior to the completion of cell division.
C Localization of GdhZ-GFP or Venus-GdhZ, determined by phase contrast and fluorescence microscopy of gdhZ-gfp (RH602) or DgdhZ PxylX::venus-gdhZ (RH740). Expression of venus-gdhZ induced by adding 0.05% xylose was added to the cultures 30 min before imaging. Scale bar, 5 lm.
D Colocalization of GdhZ-GFP with FtsZ-mCherry, determined by phase contrast and fluorescence microscopy of gdhZ-gfp PxylX::ftsZ-mcherry (RH967). The expression of ftsZ-mcherry was induced by adding 0.1% xylose to the cultures 30 min before imaging. Scale bar, 5 lm. GdhZ-GFP (green) and FtsZ-mCherry (red) signals from gdhZ-gfp PxylX::ftsZ-mcherry cells were plotted according to the cell length. “0” and “1” correspond to the poles, and “0.5” to the midcell position.
E Demographic representation of FtsZ-mCherry and GdhZ-GFP fluorescent patterns (n = 957). The signal intensity in each cell is represented by a color code, from dark blue (low intensity) to red (high intensity). “0” corresponds to the midcell position.
These observations suggest that GdhZ accumulates at the divi-sion site in a FtsZ-dependent manner very likely to stimulate Z-ring disassembly in late predivisional cells.
GdhZ modulates FtsZ dynamics in vitro
Our observations so far implicate GdhZ as a negative regulator of the Z-ring. We thus tested the ability of GdhZ to modulate FtsZ dynamics in vitro. For this purpose, we purified native GdhZ and monitored its activity (oxidative deamination) by following NADH production at 340 nm. The reaction was defined as a function of the
concentration of NAD+or glutamate (Supplementary Fig S5). The
NAD+saturation curve followed a Michaelis–Menten kinetics,
yield-ing a Kmvalue of 0.038 mM (Supplementary Fig S5A). In contrast,
the glutamate saturation curve was sigmoidal, and a Hill plot
established a S0.5 of 42.5 mM with an interaction coefficient (n)
of 1.6, indicating a positive cooperativity in glutamate binding (Supplementary Fig S5B).
Since purified GdhZ was active in vitro, we then measured the intrinsic GTPase activity of FtsZ and visualized the formation of FtsZ ordered structures (protofilaments and bundles) by negative-stain electron microscopy (EM), in the presence or absence of GdhZ. First, the addition of increasing concentration of GdhZ did not substantially affect the GTPase activity of FtsZ, with only a slight increase (~30%) in GTP hydrolysis at a 2:1 GdhZ:FtsZ molar ratio (Fig 4A). In contrast, the addition of GdhZ together with its
substrates (NAD+and glutamate) strongly stimulated the GTPase
activity of FtsZ in a dose-dependent manner (Fig 4B) (~4.5-fold increase at 2:1 GdhZ:FtsZ ratios). Interestingly, the presence of only
one of the substrates (NAD+or glutamate) was sufficient for GdhZ
to stimulate the GTPase activity of FtsZ (Supplementary Fig S6A), suggesting that a conformational change of GdhZ induced by substrate binding allows GdhZ to interfere with FtsZ dynamics in vitro. Then, we examined the effect of GdhZ on FtsZ ultrastructures by EM. In agreement with earlier studies, in the presence of GTP, FtsZ assembled into straight protofilaments that can associate into bundles (Fig 4C). Consistent with the above results, FtsZ structures were still visible in the presence of GdhZ alone (Fig 4D), but barely detectable when GdhZ and its substrates were included in the reac-tions, with only a few short protofilaments observed at a 1:1 GdhZ: FtsZ ratio (Fig 4E). Note that GdhZ also self-assembles into higher ordered structures in a concentration-dependent manner (F. Beaufay and R. Hallez, unpublished results), which affected the negative-staining contrast. Importantly, neither substrates nor products of
GDH reaction (NAD(H), glutamate, ammonium, ora-ketoglutarate)
did, on themselves, neither stimulate the GTPase activity nor influ-ence the polymeric structures of FtsZ in the tested conditions (Fig 4B and data not shown). Likewise, the dynamics of FtsZ was not affected by the unrelated bovine L-glutamic dehydrogenase GdhA with its substrates (Supplementary Fig S6B and E). Finally,
we found that FtsZE79K, which displays a twofold reduced GTPase
activity compared to wild-type FtsZ, was still fully sensitive to active GdhZ (Supplementary Fig S6C and F). The GTPase activity of
FtsZE79Kwas indeed strongly stimulated by active GdhZ (~ninefold
at 2:1 GdhZ:FtsZE79Kratio).
On the basis of these in vitro data, we propose that catalytically active GdhZ very likely disassembles FtsZ polymers by triggering the GTPase activity of FtsZ.
GdhZ activity is required to control the cell division process The fact that GdhZ substrates are required in vitro for GdhZ to stimu-late the GTPase activity of FtsZ prompted us to investigate the effect
of a catalytically inactive mutant of GdhZ (GdhZK837A) on cell
divi-sion. GdhZK837Awas stable in vivo and purified GdhZK837Adisplayed
no detectable GDH activity in vitro in contrast to wild-type GdhZ
(Supplementary Fig S7A). We found that gdhZK837A phenocopied
DgdhZ in terms of (i) growth and cell division defects
(Supplemen-tary Figs S1, S7B and S7C), (ii) synthetic interaction with ftsZE79K
(Supplementary Fig S7C), and (iii) premature GFP-FzlC recruitment at midcell (Supplementary Fig S7D and data not shown). In addition,
GdhZK837Adid not affect FtsZ dynamics (Supplementary Fig S6D and
E), even if it could still pull down FtsZ (Supplementary Fig S7E). These results further support the idea that GDH activity is strictly required for GdhZ to control cell division but not to mediate interac-tion with FtsZ.
GdhZ abundance oscillates over the cell cycle
The abundance of FtsZ and several of its regulators (FtsA, FzlA, FtsQ, or KidO) was previously shown to oscillate during the cell cycle in order to coordinate cell division events (Kelly et al, 1998; Martin et al, 2004; Goley et al, 2010; Radhakrishnan et al, 2010). To determine whether GdhZ is also cell-cycle-regulated, we moni-tored GdhZ abundance over the cell cycle in a synchronized popula-tion of Caulobacter cells in which the native copy of gdhZ was replaced by a functional 3FLAG-gdhZ fusion. As illustrated in Fig 5A, 3FLAG-GdhZ oscillated throughout the cell cycle, reaching the highest level in swarmer and late predivisional cells and the lowest level in stalked cells. This cell cycle fluctuation was also observed in the wild-type strain using polyclonal GdhZ anti-bodies (Fig 5B). Thus, GdhZ starts to disappear in differentiating stalked cells (i.e. when the Z-ring is built up) and reappears in late predivisional cells (i.e. when the Z-ring starts to be disassembled) (Fig 5A and Supplementary Fig S8A).
Several evidence support that GdhZ might be subjected to a cell cycle-dependent proteolysis. First, adding a 3FLAG tag or GFP at GdhZ C-terminus (GdhZ-3FLAG or GdhZ-GFP) or substituting the
last two alanine residues by two aspartate residues (GdhZAA::DD)
completely abrogated oscillation (Fig 5C and Supplementary Fig S8B and data not shown). This is reminiscent of that seen for other cell-cycle-regulated proteins degraded by the ClpXP protease (Domian et al, 1997; Radhakrishnan et al, 2010; Abel et al, 2011). Indeed, GdhZ has a C-terminal end homologous to the proteolytic SsrA peptide tag (Fig 5D) known to deliver substrates to ClpXP. Masking or mutating this conserved motif could block proteolysis as it is the case for CtrA or KidO (Domian et al, 1997; Radhakrishnan et al, 2010; Abel et al, 2011). Second, the steady-state level of GdhZ increased in the absence of the ClpP peptidase subunits (Fig 5E). Third, 3FLAG-GdhZ did not oscillate anymore in mutants (DcpdR, DrcdA, and DpopA) unable to degrade ClpXP-dependent substrates (Supplementary Fig S8C) (Iniesta et al, 2006; McGrath et al, 2006; Duerig et al, 2009). Together these results suggest that, similar to KidO, GdhZ undergoes a ClpXP-dependent degradation throughout the cell cycle.
The reappearance of GdhZ in late predivisional cells could be due to the transcriptional activation of gdhZ by the response
regulator CtrA, as described for KidO (Radhakrishnan et al, 2010). Indeed, CtrA, known to modulate the transcription of cell-cycle-regulated genes (Laub et al, 2000), has recently been shown to
tightly bind the promoter region of gdhZ (PgdhZ) (Fumeaux et al,
2014). To test this hypothesis, the transcription of gdhZ was
moni-tored with a PgdhZ::lacZ transcriptional fusion in strains in which
CtrA is either underactivated (DpleC) or overactivated (DdivJ or
divKcs) (Supplementary Fig S9A). We found that PgdhZactivity was
reduced by ~25% inDpleC cells and increased by ~25% in DdivJ or
divKcscells in comparison with wild-type cells (Supplementary Fig
S9B). Accordingly, the steady-state level of GdhZ was increased in
divKcscells and decreased in a strain expressing a thermosensitive
loss-of-function mutant of ctrA (Supplementary Fig S9C). These results strongly suggest that CtrA~P directly activates the transcrip-tion of gdhZ.
Overall, we propose that GdhZ uses the same regulatory network as KidO to oscillate throughout the cell cycle, very likely to limit its abundance during the S phase of the cell cycle, that is, when the Z-ring has to be built up. Taken this into consideration, the localiza-tion of GdhZ-GFP at the midcell during S phase (stalked and early
predivisional cells), depicted on Fig 3E, very likely resulted from the stabilization of the fusion protein. Therefore, we can postulate that GdhZ is recruited to the division site in late predivisional cells, very likely to trigger Z-ring disassembly.
KidO inhibits lateral interactions between FtsZ protofilaments By inhibiting Z-ring formation in swarmer cells (G1) and stimulating Z-ring disassembly in late predivisional cells (G2), GdhZ would play a role similar to the one already proposed for KidO (Radhakrishnan et al, 2010). However, the exact mechanism by which KidO, once bound to NAD(H), interferes with FtsZ remains unknown. To address this question, KidO was purified and its effect on the poly-merization of FtsZ was measured in vitro. In contrast to GdhZ with
its substrates, KidO alone (Fig 6A) or with its cofactor (NAD+ or
NADH, Fig 6B) did not substantially affect the GTPase activity of FtsZ. At a 2:1 KidO:FtsZ ratio, KidO slightly increases the GTP hydrolysis rate of FtsZ (~30%) in the presence of either NADH or
NAD+(compare Figs 6B and 4B). However, EM analyses revealed
that, in the presence of NADH but not NAD+, KidO drastically
FtsZ ± GdhZ 40 0 20 40 60 80 100 120 140 160 180 20 10 30 Time (min) µM Pi 50
C
FtsZ FtsZ + GdhZD
FtsZ + GdhZ + NAD+/glutamateE
A
B
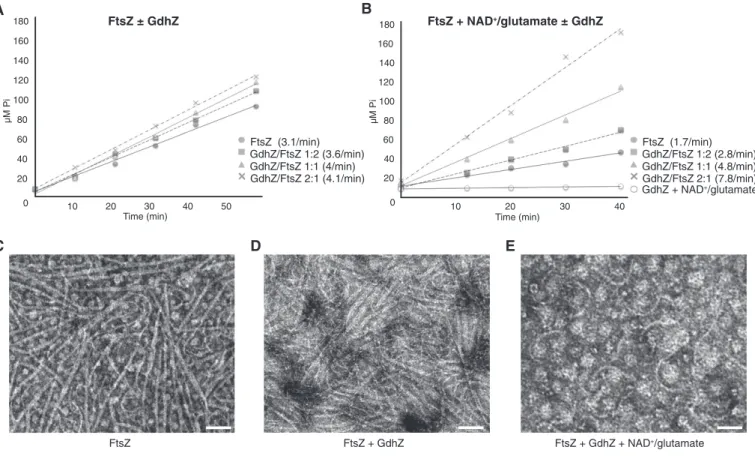
FtsZ (3.1/min) GdhZ/FtsZ 1:2 (3.6/min) GdhZ/FtsZ 1:1 (4/min) GdhZ/FtsZ 2:1 (4.1/min) FtsZ (1.7/min) GdhZ/FtsZ 1:2 (2.8/min) GdhZ/FtsZ 1:1 (4.8/min) GdhZ/FtsZ 2:1 (7.8/min) GdhZ + NAD+/glutamate 40 FtsZ + NAD+/glutamate ± GdhZ 0 20 20 0 3 0 1 40 60 80 100 120 140 160 180 Time (min) µM PiFigure 4. Active GdhZ promotes FtsZ’s GTPase activity in vitro leading to filaments disassembly.
A Inorganic phosphate (Pi) release over time by FtsZ (0.5 lM) incubated with 1 mM GTP in the presence of 0, 0.25, 0.5, or 1 lM GdhZ, respectively. The rates of GTPase (Pireleased per FtsZ molecule per min) are indicated for each condition.
B Stimulation of FtsZ’s GTPase activity with active GdhZ. Inorganic phosphate (Pi) release over time by FtsZ (0.5 lM) incubated with 1 mM GTP, 100 mM glutamate, 5 mM NAD+in the presence of 0, 0.25, 0.5, or 1 lM GdhZ, respectively. The rates of GTPase (P
imolecules released per FtsZ per min) are indicated for each condition. Note that GdhZ with its substrates (100 mM glutamate, 5 mM NAD+) does not display any detectable GTPase activity on itself.
C–E Negative-stain electron microscopy of FtsZ (0.5 lM) incubated with 1 mM GTP in the absence (c) or presence of 0.5 lM GdhZ alone (d) or together with 100 mM glutamate and 5 mM NAD+(e). Scale bar, 100 nm.
reduced FtsZ bundling without interfering with single protofila-ments (Fig 6D). These results suggest that KidO bound to NADH hampers lateral interactions between FtsZ protofilaments rather than stimulating FtsZ’s GTPase activity. This observation is consis-tent with the drastic increase of bundling capacity that we observed
for the KidO-resistant mutant FtsZE79K(Supplementary Fig S6F). In
comparison with wild-type FtsZ, FtsZE79K assembled in vitro into
larger and longer polymeric structures (compare Supplementary Fig S6E and F), very likely by increasing lateral interactions between FtsZ protofilaments. In that case, the reduced GTPase activity of
FtsZE79K would therefore be an indirect consequence of the
increased bundling. On the other hand, the fact that GdhZ and KidO use different molecular mechanisms to control cell division explains
the sensitivity of the KidO-resistant mutant FtsZE79Kto active GdhZ
(Supplementary Fig S6C) as well as the synthetic interactions
observed between ftsZE79K and DgdhZ or gdhZK837A (Fig 2B and
Supplementary Fig S7C). The robust Z-rings formed in vivo by
FtsZE79K could not be properly disassembled without the
GdhZ-dependent stimulation of FtsZ GTPase activity.
Thus, GdhZ and KidO might control FtsZ by using different and complementary mechanisms to trigger Z-ring disassembly.
KidO and GdhZ work in synergy to trigger Z-ring disassembly As both GdhZ and KidO (i) inhibit Z-ring assembly/stability in swarmer and late predivisional cells, (ii) share the same regula-tory network to oscillate throughout the cell cycle, and (iii) use NAD(H) as a cofactor, we wondered whether KidO and GdhZ could act in coordination to control Z-ring dynamics. To test this idea, we created a C. crescentus strain in which both proteins were stabilized, that is, not anymore proteolyzed by ClpXP. If both proteins disassemble FtsZ polymers, we predict that their presence at the onset of the S phase would interfere with Z-ring
formation. As expected, this strain (gdhZ-gfp kidOAA::DD) exhibited
a strong filamentation, much stronger than the strain expressing
either gdhZ-gfp or kidOAA::DD (Supplementary Fig S10A and B).
Interestingly, this filamentation was completely abolished when glucose was added to the medium (data not shown), supporting that GdhZ and/or KidO are controlled by nutrient availability. We then tested whether KidO could enhance the effect of active GdhZ on the GTPase activity of FtsZ. As shown on Fig 6C, the presence of KidO increased the stimulation of FtsZ GTPase activity by active GdhZ (~30%) although NADH was only generated by GDH activity. The NADH produced by GdhZ could therefore be directly delivered to KidO to disassemble FtsZ bundles. In support of this idea, GdhZ and KidO co-purified in a pull-down assay suggesting that both proteins are part of the same complex (Supplementary Fig S10C).
These results suggest that GdhZ and KidO act in synergy to stimulate depolymerization of the Z-ring, KidO-NADH dissociating FtsZ bundles and active GdhZ stimulating GTPase activity of newly available FtsZ protofilaments.
A
C
D
B
E
Figure 5. The ClpXP protease is responsible for the cell cycle oscillation of GdhZ.
A Immunoblotting of protein samples extracted from synchronized 3FLAG-gdhZ (RH743) cells to follow 3FLAG-GdhZ, FtsZ and CtrA abundance throughout the cell cycle.
B Immunoblotting of protein samples extracted from synchronized wild-type (RH50) cells to follow GdhZ and CtrA abundance throughout the cell cycle.
C Immunoblotting of protein samples extracted from synchronized gdhZ-3FLAG (RH728) cells to follow GdhZ-gdhZ-3FLAG and KidO abundance throughout the cell cycle.
D Alignment of the C-terminal extremity of GdhZ, CtrA and SsrA tag. The last two hydrophobic amino acids (Ala-Ala) are essential for degradation of substrates by ClpXP.
E Steady-state levels 3FLAG-GdhZ and MreB in clpP depletion (RH991, left panel) or deletion (RH1672 and RH1675, right panel) strains revealed by immunoblots (level of 3FLAG-GdhZ increased ~threefold and ~twofold, respectively). DclpP PxylX::clpP 3FLAG-gdhZ cells were grown in PYE supplemented with 0.1% xylose to mid-exponential phase and then washed and resuspended in PYE without xylose. Deletion clpP is known to be viable in strain deleted for the toxin–antitoxin system socAB (Aakre et al, 2013). DsocAB (RH1672) and DsocABDclpP (RH1675) cells were grown in PYE to mid-exponential phase.
Discussion
Here, we found that the NAD-dependent glutamate dehydrogenase GdhZ coordinates metabolism with cell division in C. crescentus. GdhZ directly stimulates the GTPase activity of FtsZ, and this regu-lation requires GdhZ catalytic activity. The central position of GDH reaction between the TCA and nitrogen cycles makes GdhZ an
excellent candidate and as a metabolic regulator of the cell cycle (Figs 1B and 7). So far, the best characterized bacterial metabolic regulators of cell division are UgtP in Bacillus subtilis and OpgH in Escherichia coli; both are glucosyltransferases using UDP-glucose as a substrate (Weart et al, 2007; Hill et al, 2013). These proteins coordinate growth with cell division to adapt cell size according to nutrient availability. In contrast to C. crescentus, E. coli and
A
B
C
D
i
iii
ii
FtsZ (3.9/min) KidO/FtsZ 2:1 (3.8/min) KidO/FtsZ 5:1 (3.9/min) FtsZ (2.5/min) KidO/FtsZ 1:1 (2.7/min) KidO/FtsZ 2:1 (3.3/min) KidO/FtsZ 5:1 (3.7/min) KidO/FtsZ 10:1 (4./min) FtsZ (2.2/min) KidO/FtsZ 1:1 (2.5/min) GdhZ/FtsZ 1:1 (4.1/min) GdhZ/KidO/FtsZ 1:1:1 (5.5/min) FtsZ + NAD+/glutamate ± KidO/GdhZ FtsZ + KidO/NAD+ FtsZ FtsZ + KidO/NADH FtsZ ± KidO 40 0 20 20 10 30 40 60 80 100 120 140 160 Time (min) µM Pi FtsZ + NADH ± KidO 40 0 2 0 20 10 30 40 60 80 100 120 140 160 Time (min) µM Pi 40 0 20 20 10 30 40 60 80 100 120 140 160 Time (min) µM Pi 50Figure 6. NADH-bound KidO prevents lateral interactions between FtsZ protofilaments.
A Inorganic phosphate (Pi) release over time by FtsZ (0.5 lM) incubated with 1 mM GTP in the presence of 0, 1, 2.5, or 5 lM KidO, respectively. The rates of GTPase (Pireleased per FtsZ molecule per min) are indicated for each condition.
B KidO does not strongly stimulate GTPase activity of FtsZ in the presence of NADH. Inorganic phosphate (Pi) release over time by FtsZ (0.5 lM) incubated with 1 mM GTP, 5 mM NADH in the presence of 0, 0.5, 1, or 2.5 lM KidO, respectively. The rates of GTPase (Pimolecules released per FtsZ per min) are indicated for each condition. Similar results were obtained when NAD+was used instead of NADH (data not shown).
C KidO enhances the effect of GdhZ on the GTPase activity of FtsZ. Inorganic phosphate (Pi) release over time by FtsZ (0.5 lM) incubated with 1 mM GTP, 100 mM glutamate, 5 mM NAD+, in the absence or presence of 0.5 lM KidO, or 0.5 lM GdhZ, or both 0.5 lM KidO and 0.5 lM GdhZ. The rates of GTPase (P
imolecules released per FtsZ per min) are indicated for each condition.
D Negative-stain electron microscopy of FtsZ (0.5 lM) incubated with 1 mM GTP, in the presence of 1 lM KidO without NAD(H) (i), or with 5 mM NAD+, (ii) or 5 mM NADH (iii). Scale bar, 200 nm. Note that neither NADH nor NAD+does affect FtsZ polymerization.
B. subtilis can indeed adjust their cell size depending on their growth rate (Sargent, 1975; Campos et al, 2014). Similar to UgtP and OpgH, GdhZ directly interferes with FtsZ. However, in contrast to GdhZ, UgtP and OpgH do not require their substrates to inhibit FtsZ polymerization in vitro. The cell division control by UgtP or OpgH is rather driven by their steady-state levels, which, in turn, are determined by nutrient availability. In addition, GdhZ mainly stimulates the GTPase activity of FtsZ, while UgtP inhibits FtsZ single-filament formation and OpgH sequesters FtsZ monomers preventing them from assembly (Weart et al, 2007; Hill et al, 2013). KidO is another metabolic regulator of cell division in C. crescen-tus, described to stimulate the disassembly of the Z-ring in a NAD (H)-dependent manner (Radhakrishnan et al, 2010), during the G1 and G2 phases of the cell cycle. We showed that GdhZ and KidO share the same regulatory network. First, ClpXP degrades both proteins at the G1-to-S transition, to ensure that they mainly disap-pear when the Z-ring needs to be assembled at the division site (early S phase). Second, the master regulator CtrA positively regu-lates the transcription of gdhZ and kidO, and this coregulation allows reaccumulation of both proteins in G2 phase to stimulate the rapid depolymerization of the Z-ring during cytokinesis (Fig 7). Change in NAD(H) levels during the cell cycle has been initially proposed to drive KidO-dependent cell division control (Radhakrishnan et al, 2010). Alternatively, GdhZ might directly deliver NADH to KidO in the vicinity of the Z-ring, through its catabolic
activity (Fig 7). This “substrate channeling-like” process (Schendel et al, 1988; Arentson et al, 2012; Dunn, 2012) would coordinate GdhZ and KidO activities on the Z-ring during the G2 phase of the cell cycle, in order to facilitate Z-ring disassembly and cytokinesis. Similar to KidO, GdhZ also prevents premature Z-ring formation during the G1 phase. Indeed, time-lapse experiments showed that DgdhZ predivisional cells could assemble a new Z-ring at the division site of future daughter cells prior to the completion of cell
division (Fig 3B). In addition, aDgdhZ mutant gives birth to small
swarmer progeny cells that have already built up a Z-ring (Fig 3A). On the basis of these observations, we propose a model (Fig 7) in which GdhZ and KidO coordinately prevent premature assembly of the Z-ring in G1 swarmer cells. Then, the ClpXP-dependent proteolysis of GdhZ and KidO at the G1-S transition allows the building of the Z-ring. Later in the cell cycle (G2 phase), both proteins reaccumulate to reach their maximal levels at the late predivisional stage of the cell cycle. At that time, KidO destabilizes lateral interactions between FtsZ protofilaments, thereby increasing filament sliding, while active GdhZ stimulates the GTPase activity of FtsZ to ensure that the Z-ring does not reach a too condensed state that could block cytokinesis (Szwedziak et al, 2014). The concomitant recruitment of two negative regulators of the Z-ring at the onset of the G2 phase could therefore be responsible for the 2-step motion of cytokinesis (first slow, then rapid) described for C. crescentus (Holden et al, 2014). GdhZ FtsZ KidO
n
o
i
s
i
v
i
D
/
2
G
S
1
G
ll e c l a n o i s i v i d e r P ll e c d e k l a t s e li s s e S ll e c r e m r a w s e li t o M Z-ring NAD+ NADH+H+ GdhZ KidOFigure 7. Model for the coordination of cell division with metabolism through the concomitant and synergic action of GdhZ and KidO.
GdhZ and KidO abundance oscillate throughout the cell cycle to reach maximal levels during G1 and G2 phases. Localization of GdhZ and KidO to the Z-ring allows both proteins to accumulate in the vicinity of the division site, at the constriction step. Each protein can, independently of each other, avoid premature Z-ring assembly in G1 swarmer cell and promote Z-ring disassembly in G2 predivisional cells. As being part of the same complex, we propose that GdhZ could locally provide KidO with NADH thanks to glutamate catabolism. This “substrate channeling-like” mechanism could enhance Z-ring disassembly. According to nutrient availability, the synergic action of both GdhZ and KidO could be responsible for the rapid constriction observed during G2 phase (Holden et al, 2014). In starving conditions, GdhZ and KidO would not stimulate constriction, therefore delaying cell division and preventing the release of the swarmer progeny cells without enough energy and nutrients to colonize new environments.
AlthoughDgdhZ cells spend significantly more time to proceed to
cytokinesis, aDgdhZ cell population contains many tiny cells smaller
than the smallest wild-type G1 swarmer cells, a phenotype usually attributed to polar cell division events (Lutkenhaus, 2007). Surpris-ingly, it is unlikely to be the case forDgdhZ cells as the Z-ring still assembles at midcell in the vast majority of cells (Fig 3A). Instead, it probably arises from a miscoordination between metabolism/growth and cell division. Indeed, the premature Z-ring assembly in G1 swarmer cells coupled to a slow growth rate could lead to smaller pre-divisional cells, which could in fine generate smaller progeny cells.
The kinetic parameters determined for GdhZ (high S0.5for
gluta-mate and low Kmfor NAD+) suggest that the catabolic activity of
GdhZ would be mainly controlled in vivo by glutamate availability
rather than by NAD+levels. In oligotrophic environments, amino
acids could serve as a major carbon source for bacteria such as C. crescentus. High GDH activity could therefore be sensed as a signal of plenty for the cell division apparatus, allowing the release of daughter cells with sufficient nutrient/energy supplies. Such a mechanism would favor the survival of swarmer progeny cells in poor nutrient environments. The conservation of GdhZ among a-proteobacteria also suggests that amino acids catabolism could be another common feature for these bacteria. In support of this idea,
an in-frame deletion of gdhZ homolog in Brucella abortus (DgdhZBa),
an intracellular pathogen of cattle, led also to growth and cell
divi-sion defects (data not shown). Moreover,DgdhZBacells failed to
sustain efficient intracellular replication in murine macrophages (F. Beaufay and R. Hallez, unpublished results), strongly suggesting that amino acids could be a major carbon source encountered by Brucella during infection, as it is the case for other intracellular pathogens (Zhang & Rubin, 2013). Altogether these data suggest that cell
divi-sion control mediated by GdhZ could be conserved among
a-proteo-bacteria. The suppression of DgdhZ defects by the addition of a
GdhZ-independent carbon source (e.g. glucose) raises the possibility that (an)other enzyme(s) regulate(s) cell division according to the main carbon source encountered in the environment. It is worth to note that a connection between glycolysis and cell division has been recently highlighted in B. subtilis (Monahan & Hajduk, 2014). The authors proposed that pyruvate levels control Z-ring assembly thanks to the pyruvate dehydrogenase (PDH) activity (Monahan & Hajduk, 2014). As the final product of hexose (e.g. glucose) catabo-lism, it would be interesting to check whether pyruvate and/or PDH controls cell division in C. crescentus grown in the presence of glucose or other complex hexoses.
As a metabolic enzyme, GDHs are subjected to various post-trans-lational regulations (Minambres et al, 2000; Commichau et al, 2007; Oliveira & Sauer, 2012). Our in vitro analysis also revealed that GDH activity of GdhZ is inhibited by TCA intermediates (e.g. citrate) and stimulated by some amino acids such as arginine (data not shown). We also observed that GdhZ auto-assembles into ordered structures (F. Beaufay and R. Hallez, unpublished results), even we do not know whether this self-assembly has any effect on GDH activity or cell division control. Self-assembly of glutamate dehydrogenase has been described for a long time in various organisms (Josephs & Borisy, 1972; O’Connell et al, 2012). It is worth noting that UgtP’s oligomerization state was shown to play an important role in the control of cell division in B. subtilis (Chien et al, 2012).
A single protein harboring multiple functions is referred to as a “moonlighting protein” (reviewed in Huberts & van der Klei, 2010).
Moonlighting proteins are commonly found among metabolic enzymes; for example, 7 out of the 10 proteins in the glycolytic pathway and 7 out of the 8 proteins in the TCA cycle display a moonlighting function. Because of their interaction with cell metabolites and the subsequent conformational change induced upon substrate binding, metabolic enzymes constitute good candidates for signal transduction (Huberts & van der Klei, 2010).
How cells coordinate growth with cell cycle according to nutrient availability and energy supplies remains an exciting open question. Although we have now uncovered a new bifunctional enzyme that couples cell division with amino acids catabolism, further work is needed to highlight other links between metabolism and cell cycle.
Materials and Methods
Bacterial strains and growth conditions
Escherichia coli Top10 was used for cloning purpose and grown aerobically in Luria–Bertani (LB) broth (Sigma) (Casadaban & Cohen, 1980). Electrocompetent cells were used for transformation of E. coli. All Caulobacter crescentus strains used in this study are derived from the synchronizable wild-type strain NA1000 and were grown in peptone–yeast extract (PYE,) or synthetic M2 glucose (M2G) or xylose (M2X) media at 28–30°C. Growth was monitored by following the OD (600 nm) during 24 h in an automated plate reader (Bioscreen C; Lab Systems) with continuous shaking at 30°C. When indicated, media were supplemented with glucose (G), xylose (X), vanillate (Van), and alanine (A) at a final concentration of
0.2%. Genes expressed from the inducible vanA promoter (PvanA)
were induced with 0.5 mM vanillate; genes expressed from the
inducible xylX promoter (PxylX) were induced with ≤ 0.05% xylose
in aDxylX background or with 0.1% xylose in xylX+background.
For FtsZ depletion experiments, cells were grown in the presence of 0.05% xylose for induction, then washed and resuspended in PYE liquid media without xylose. Generalized transduction was performed with phage ФCr30 according to the procedure described in Ely (1991).
For E. coli, antibiotics were used at the following concentrations (lg/ml; in liquid/solid medium): ampicillin (50/100), kanamycin (30/50), oxytetracycline (12.5/12.5), spectinomycin (100/100), streptomycin (50/100), and hygromycin (100/100). For C. crescen-tus, media were supplemented with kanamycin (5/20), oxytetra-cycline (1/2.5), spectinomycin (25/50), or streptomycin (5/5), where appropriate.
Escherichia coli S17-1 and E. coli MT607 helper strains were used for transferring plasmids to C. crescentus by respectively bi- and tri-parental mating. In-frame deletions were created by using the
pNPTS138-derivative plasmids, by following the procedure
described in Thanbichler and Shapiro (2006).
Strains and plasmids used in this study are listed in Supplemen-tary Tables S2 and S3, together with construction details provided in the Supplementary Materials and Methods.
Y2H screen
Y2H screen was performed using a N-terminal fragment of C.
random genomic DNA (gDNA) fragments of C. crescentus fused to
Gal4ADas prey (Davis et al, 2013). The library was transformed into
Saccharomyces cerevisiae strain Y187 (Clontech) and selected onto
synthetic medium without leucine (SD-L). The pGBKT7-ftsZ1–324
(pHR284) plasmid was transformed into S. cerevisiae strain Y2H Gold (Clontech) and selected onto synthetic medium without trypto-phan (SD-W). Y2H screen was performed essentially as proposed by the manufacturer (Clontech). Both yeast strains were grown sepa-rately either in SD-L or in SD-W, washed, and allowed to grow together in complex rich medium supplemented with adenine for
24 h at 30°C with slow shaking. More than 1 × 10⁷diploids were
screened either on SD-LWH supplemented with 5 mM 3-Amino-1,2,4-triazole (3-AT) or on SD-LWA. Isolated prey plasmids were transformed into E. coli strain Top10 and the inserts identified by DNA sequencing.
Immunoprecipitation
Caulobacter crescentus strains were grown in PYE liquid media
(OD660~0.7), harvested by centrifugation for 15 min at 6,000 × g,
4°C and resuspended in 5 ml ice-cold phosphate buffer saline (PBS) containing 0.05% Triton X-100, complete EDTA-free anti-proteases, 20 mg/ml lysozyme, 10 U/ml DNase I. Cells were first lysed by sonication, and then, zirconium beads were added and cells were disrupted by FastPrep cycles (5 × 20 s) and harvested by centrifuga-tion for 30 min at 14,000 × g, 4°C. Cell pellets were discarded, and
1 mg of protein lysates was mixed to 50ll of anti-FLAG M2
magnetic beads (Sigma) resuspended in PBS 20 mg/ml BSA and incubated at 4°C for 1 h. Beads were pelleted by using magnets and washed six times in PBS containing 0.05% Triton X-100. Beads were
then resuspended in 100ll SDS-loading containing 0.5 mg/ml of
3×Flag peptides (Sigma). Lysates and eluates were analyzed by Western blot. For Co-IP analysis with KidO, 0.05% xylose was added to the culture 1 h before harvesting cells, to allow kidO-mcherry expression.
Immunoblot analysis
Proteins crude extracts were prepared by harvesting cells from
expo-nential growth phase (OD6600.1–0.4). Cells were resuspended in
SDS–PAGE loading buffer and lysed by incubation at 90°C for 10 min. Proteins were then subjected to electrophoresis in a 4–15% SDS–polyacrylamide gel, transferred onto a nitrocellulose membrane, and immunoblotted for ≥ 1 h with primary antibodies: a-FtsZ (1:20,000), a-FLAG (1:5,000) (Stratagene), a-CtrA (1:5,000), a-MreB (1:5,000), a-KidO (1:2,000) (Radhakrishnan et al, 2010), a-GdhZ (1:10,000), and a-DsRed (Clontech) (1:1,000). Membranes were then immunoblotted for ≤ 1 h with secondary antibodies:
1:10,000 anti-mouse (fora-FLAG) or 1:7,500 anti-rabbit (for all the
others) linked to peroxidase (GE Healthcare), and visualized thanks to Western Lightning Plus-ECL chemiluminescence reagent (Perkin-Elmer) and ImageQuant LAS400 (GE Healthcare).
Synchronization of cells
For synchrony, cells were grown in 200 ml of PYE to OD660 0.6,
harvested by centrifugation for 15 min at 6,000 × g, 4°C, resus-pended in 60 ml of ice-cold phosphate (PO3"
4 ) buffer, and combined
with 30 ml of Ludox LS Colloidal Silica (30%) (Sigma-Aldrich) (Jenal & Shapiro, 1996). Cells resuspended in Ludox were centri-fuged for 40 min at 9,000 × g, 4°C. Swarmer cells, corresponding to
the bottom band, were isolated, washed twice in ice-cold PO3"
4 buffer, and finally resuspended in prewarmed PYE media for growth at 30°C. Samples were collected every 15 min for Western blot, microscopy, and FACS analyses.
Light and fluorescent microscopy
All strains were imaged during exponential growth phase after immo-bilization on 1% agarose pads (Ely, 1991). For time-lapse experi-ments, cells were grown in PYE, transferred onto freshly prepared PYE 1.5% agarose pads, covered, and sealed with 1:1:1 mixture of paraffin, lanolin, and vaseline. Microscopy was performed using Axioskop microscope (Zeiss), Orca Flash 4.0 camera (Hamamatsu), and Zen 2012 software (Zeiss). Images were processed with ImageJ. Microbetracker and matlab analysis
Cell identification and analysis were obtained using the Matlab-based open-source software MicrobeTracker. Further quantitative analyses from cell meshes were performed with Matlab software (The MathWorks Inc., Natick, MA). Demographic representations were created using scripts derived from Hocking et al (2012). Briefly, each cell was sorted by length and segmented, and fluores-cence in each segment was integrated, normalized to the brightest segment, and plotted as a heat map from 0 (no fluorescence) to 1 (maximum fluorescence). Polar and midcell signals were considered when a maximal fluorescence (≥ 1.5-fold of the mean fluorescence) was localized up to 0.1 from each pole (0–0.1; 0.9–1) or from 0.4 to 0.6, respectively.
Proteins purification
FtsZ purification was performed as described in Thanbichler and Shapiro (2006).
GdhZ purification was performed essentially as described in Minambres et al (2000) with the exception of GdhZ overproduction. Escherichia coli BL21 (DE3) was transformed with plasmid pHR354
(pET-21b-gdhZ) or pHR573 (pET-21b-gdhZK837A) and grown to an
OD600of ~0.6 in LB medium (2 L) at 37°C.
Isopropyl-b-D-thiogalac-toside (IPTG) was added to a final concentration of 1 mM and incu-bated for 4 h. Cells were harvested by centrifugation for 30 min at 5,000 × g, 4°C. Following purification, samples were dialyzed in
50 mM HEPES, pH 7.2, 50 mM KCl, 10 mM MgCl2, 10% glycerol,
5 mM b-mercaptoethanol, and aliquoted, snap-frozen in liquid N2,
and stored at "80°C. Purified GdhZ was also used to immunize a
rabbit in order to producea-GdhZ polyclonal antibodies.
To purify KidO, E. coli BL21 (DE3) was transformed with
pHR624 (pET-21b-kidO) and grown to an OD600 of 0.6 in LB
medium (2 L) at 37°C. IPTG was added to a final concentration of 1 mM and incubated for 4 h. Cells were harvested by centrifugation for 30 min at 5,000 × g, 4°C. Cells were resuspended in 20 ml of buffer A (50 mM Tris, pH 8.5, 1 mM ethylenediaminetetraacetic
acid (EDTA), 10% glycerol, 100lg/ml phenylmethylsulfonyl
fluo-ride (PMSF) containing 10 U/ml DNase I and complete EDTA-free anti-proteases (Roche)). Resuspended cells were then disrupted by
sonication and cell debris pelleted by centrifugation for 30 min at 37,000 × g, 4°C. The supernatant was then passed through HiTrap DEAE Fast Flow columns (Sigma, 2 × 5 ml) equilibrated with buffer A. Columns were washed with 100 ml of buffer A, and elution was carried out with buffer A2 (buffer A + 80 mM KCl). Aliquots of 3 ml were collected at a flow rate of 3 ml/min. Fractions containing the KidO were detected by SDS–PAGE and Coomassie blue staining. These fractions were pooled, dialyzed for 24 h in 50 mM HEPES,
pH 7.5, 50 mM KCl, 10 mM MgCl2, 10% glycerol, 5 mM
b-mercap-toethanol, and aliquoted, snap-frozen in liquid N2, and stored at
"80°C.
In order to immunize rabbits for production of specific polyclonal
antibodies, His6-MreB142-347, FtsZ-His6, and His6-CtrA were purified
according to published works (Quon et al, 1996; Quardokus et al, 2001; Figge et al, 2004).
GTPase assay
The GTPase activity of FtsZ was assayed with the GTPase Assay Kit (Innova Biosciences, high fidelity) following the manufacturer’s
protocol. GTPase assays were performed with 0.5lM FtsZ or
FtsZE79K in polymerization buffer (50 mM HEPES pH 7.2, 50 mM
KCl, 0.1 mM EDTA, 1 mMb-mercaptoethanol, 10 mM MgCl2).
Reac-tions were started by the addition of 1 mM GTP before adding KidO
and/or GdhZ or GdhZK837A. When present, NAD+ and glutamate
were used at a final concentration of 5 mM and 100 mM, respec-tively. Hydrolysis rates were calculated from the slope of the Pivalues
plotted according to time. Pivalues were normalized according to
corresponding blank conditions containing all reagents except GTP. Electron microscopy
As for GTPase assays, reactions were performed with 0.5lM FtsZ
in polymerization buffer and initiated by addition of 1 mM GTP. Polymerization mixtures were incubated for 5 min at RT. Samples were then applied to glow-discharged carbon-coated grids, stained with 2% uranyl acetate for 1 min, washed with a drop of distilled water, blotted, and air-dried. Images were taken at 80 kV on a TECNAI 10 transmission electron microscope with a Gatan 967 slow-scan, cooled CCD camera.
b-Galactosidase assay
Cells resuspended in 800ll of Z buffer (60 mM Na2HPO4, 40 mM
NaH2PO4, 10 mM KCl, 1 mM MgSO4) were lysed with chloroform.
After the addition of 200ll ONPG (4 mg/ml), reactions were
incu-bated at 30°C until color turned yellowish. Reactions were then
stopped by the addition of 500ll of 1 M Na2CO3, and absorbance at
420 nm was measured. Miller units are defined as (OD420× 1,000)/
(OD660× t × v), where “OD660” is the absorbance at 660 nm of the
cultures before theb-galactosidase assays, “t” is the time of the reac-tion (min), and “v” is the volume of cultures used in the assays (ml). All the experiments were performed with three biological replicates and were normalized according to the wild-type strain harboring the PgdhZ-lacZ fusion cultivated at 30°C.
Supplementary information for this article is available online: http://emboj.embopress.org
Acknowledgements
We are grateful to Yves Brun, Patrick Viollier, Christine Jacobs-Wagner, Martin Thanbichler, and Urs Jenal for providing antibodies, strains, and plasmids. We further thank Urs Jenal for sharing the yeast two-hybrid library. We thank Jean-Yves Matroule and the members of the BCcD team for critical reading of the manuscript and helpful discussions; Joanne Lau and Peter Chien for helpful discussions and suggestions about ClpXP-dependent proteolysis; David Delgle-ize and Corry Charlier at the Electron Microscopy Service of the University of Namur for assistance with the transmission electron microscope; and Guy Houbeau at the Animal Care Facility of the University of Namur for immuniz-ing rabbits with purified proteins. F.B. and J.C. hold a FRIA (Fund for Research Training in Industry and Agriculture) fellowship from the National Fund for Scientific Research (F.R.S.-FNRS) and R.H. was holding a Postdoctoral Researcher from the F.R.S.-FNRS. This work was supported by a Research Project (PDR T.0053.13) to X.D.B and a Research Credit (CDR 1.5067.12) to R.H from the F.R.S.-FNRS.
Author contributions
FB and RH conceived and designed the experiments. FB performed all the experiments except otherwise stated. JC did the Y2H screen and constructed the DgdhZ mutant. AM purified all the native proteins. GL performed the quantitative analysis on Matlab software. FB, XDB, and RH analyzed the data and contributed reagents/materials/ analysis tools. FB and RH wrote the manuscript.
Conflict of interest
The authors declare that they have no conflict of interest.
References
Aakre CD, Phung TN, Huang D, Laub MT (2013) A bacterial toxin inhibits DNA replication elongation through a direct interaction with the b sliding clamp. Mol Cell 52: 617 – 628
Aaron M, Charbon G, Lam H, Schwarz H, Vollmer W, Jacobs-Wagner C (2007) The tubulin homologue FtsZ contributes to cell elongation by guiding cell wall precursor synthesis in Caulobacter crescentus. Mol Microbiol 64: 938 – 952
Abel S, Chien P, Wassmann P, Schirmer T, Kaever V, Laub MT, Baker TA, Jenal U (2011) Regulatory cohesion of cell cycle and cell differentiation through interlinked phosphorylation and second messenger networks. Mol Cell 43: 550 – 560
Arentson BW, Sanyal N, Becker DF (2012) Substrate channeling in proline metabolism. Front Biosci 17: 375 – 388
Bernhardt TG, de Boer PAJ (2005) SlmA, a nucleoid-associated, FtsZ binding protein required for blocking septal ring assembly over chromosomes in E. coli. Mol Cell 18: 555 – 564
Campos M, Surovtsev IV, Kato S, Paintdakhi A, Beltran B, Ebmeier SE, Jacobs-Wagner C (2014) A constant size extension drives bacterial cell size homeostasis. Cell 159: 1433 – 1446
Casadaban MJ, Cohen SN (1980) Analysis of gene control signals by DNA fusion and cloning in Escherichia coli. J Mol Biol 138: 179 – 207 Chien A-C, Zareh SKG, Wang YM, Levin PA (2012) Changes in the
oligomerization potential of the division inhibitor UgtP co-ordinate Bacillus subtilis cell size with nutrient availability. Mol Microbiol 86: 594 – 610
Commichau FM, Herzberg C, Tripal P, Valerius O, Stulke J (2007) A regulatory protein-protein interaction governs glutamate biosynthesis in Bacillus