Publisher’s version / Version de l'éditeur:
Proceedings of 1st International Symposium on Laser Ultrasonics, pp. 1-7, 2008
READ THESE TERMS AND CONDITIONS CAREFULLY BEFORE USING THIS WEBSITE.
https://nrc-publications.canada.ca/eng/copyright
Vous avez des questions? Nous pouvons vous aider. Pour communiquer directement avec un auteur, consultez la
première page de la revue dans laquelle son article a été publié afin de trouver ses coordonnées. Si vous n’arrivez pas à les repérer, communiquez avec nous à PublicationsArchive-ArchivesPublications@nrc-cnrc.gc.ca.
Questions? Contact the NRC Publications Archive team at
PublicationsArchive-ArchivesPublications@nrc-cnrc.gc.ca. If you wish to email the authors directly, please see the first page of the publication for their contact information.
NRC Publications Archive
Archives des publications du CNRC
This publication could be one of several versions: author’s original, accepted manuscript or the publisher’s version. / La version de cette publication peut être l’une des suivantes : la version prépublication de l’auteur, la version acceptée du manuscrit ou la version de l’éditeur.
Access and use of this website and the material on it are subject to the Terms and Conditions set forth at
Defect detection and residual stress measurement in friction stir welds using laser ultrasonics
Lévesque, Daniel; Dubourg, Laurent; Lord, Martin; Jahazi, Mohammad; Blouin, Alain
https://publications-cnrc.canada.ca/fra/droits
L’accès à ce site Web et l’utilisation de son contenu sont assujettis aux conditions présentées dans le site LISEZ CES CONDITIONS ATTENTIVEMENT AVANT D’UTILISER CE SITE WEB.
NRC Publications Record / Notice d'Archives des publications de CNRC:
https://nrc-publications.canada.ca/eng/view/object/?id=58e4a0a8-33a7-48f4-9511-271029949a61 https://publications-cnrc.canada.ca/fra/voir/objet/?id=58e4a0a8-33a7-48f4-9511-271029949a61
Defect Detection and Residual Stress Measurement in
Friction Stir Welds using Laser Ultrasonics
Daniel LÉVESQUE 1, Laurent DUBOURG 2, Martin LORD 1,
Mohammad JAHAZI 2 and Alain BLOUIN 1
1 Industrial Materials Institute, National Research Council of Canada
Boucherville, Québec, J4B 6Y4 Canada; Phone: +1 450 641 5240, Fax +1 450 641 5106;
daniel.levesque@cnrc-nrc.gc.ca
2 Institute for Aerospace Research, National Research Council Canada,
Montreal, Quebec, H3S 2S4 Canada; laurent.dubourg@cnrc-nrc.gc.ca
Abstract
The laser-ultrasonic technique is proposed for defect detection and residual stress measurement in friction stir welds (FSW). When combined with the synthetic aperture focusing technique (F-SAFT), very good performances are achieved for detecting lack of penetration in butt joints, the detection limit coinciding with the conditions of reduced mechanical properties. Also, the detection of kissing bonds seems to be possible in lap joints with frequencies up to 200 MHz. Another application is the measurement of residual stresses induced by the FSW process. The method is based on monitoring the velocity change of the laser generated surface skimming longitudinal wave, propagating just below the surface and being found much more sensitive to stress. The residual stress profile measured across the weld line is in good agreement with results from a finite element model and from strain gauge measurements.
Keywords: Friction stir welding, laser ultrasonics, synthetic aperture focusing technique, kissing bond, residual stress, surface skimming longitudinal wave
1. Introduction
Friction stir welding (FSW) is a solid-state, environmentally friendly joining process that produces high strength and good finish welds. FSW uses the heat generated from a friction tool to plasticize and bond metals in a highly controllable and repeatable manner. During the last few years, FSW has been gaining acceptance and has found various applications in aerospace, automotive and naval industries. In the aerospace industry, stronger and lighter friction stir welded joints are excellent candidates for replacing bonded and riveted joints in the manufacture of large fuselage and other components.
However, the nondestructive inspection of FSW is not yet clearly established, especially due to specific defects and their random orientation within the weld. Typical FSW defects are lack of penetration, wormholes and vertical kissing bonds in butt joints, and hooking, wormholes and horizontal kissing bonds in lap joints. Kissing bonds originate from the remnants of trapped oxide layers resulting in inferior mechanical properties in the weld nugget [1]. They are known as the most challenging problem for inspection of FSW joints. In addition to defects, distortion in thin section structures usually occurs caused by buckling due to thermal residual stresses. This weld distortion can result in poor dimensional control and structural integrity. Techniques such as reduction of weld size, design modifications and thermal tensioning can be used to minimize residual stresses and related buckling [2]. There is a need to evaluate in a nondestructive manner the level of residual stresses to support such techniques.
In this paper, laser ultrasonics, a non contact method using lasers for the generation and detection of ultrasound, is proposed for both defect detection and residual stress
measurement, ultimately on-line during welding. For FSW defects, data acquisition across the weld line is made and numerical focusing is performed using the Fourier domain Synthetic Aperture Focusing Technique (F-SAFT). Lap and butt joints are examined along with metallographic analysis and validation by destructive mechanical testing. For residual stress, the method is based on monitoring the small velocity change produced by the stress of the laser generated surface skimming longitudinal wave (LSSLW). This wave propagates just below the surface and is found much more sensitive to stress than Rayleigh wave (SAW) [3]. The residual stress profile measured across the weld line is compared with results from numerical simulations and strain gauge measurements.
2. FSW Defect detection
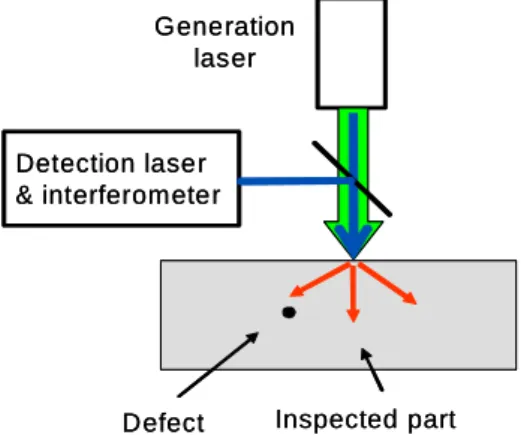
2.1 Laser-ultrasonic setupThe approach to detect different types of flaws in FSW is illustrated in Figure 1. Using F-SAFT, the generation and detection spots overlap at the surface of the part. The generation of ultrasound is performed in the slight ablation regime with a 35 ps duration pulse of a Nd:YAG laser in its 3rd harmonic with a spot size of about 50 µm. The detection uses a long pulse Nd:YAG laser in conjunction with a photorefractive interferometer for demodulation. Frequencies up to 220 MHz are generated and detected in the weld region. Also, mechanical scanning along two axes is performed for data acquisition with a step size of 0.1 mm. The scans are performed after the removal by milling of any welding debris that could interfere with the recorded signal. For the numerical focusing, an algorithm in the Fourier domain is used for time-efficient reconstruction [4].
Defect Inspected part
Generation laser
Detection laser & interferometer
Defect Inspected part
Generation laser
Detection laser & interferometer
Figure 1. Laser-ultrasonic setup for inspection of defect with F-SAFT
2.2 Inspection of lap joints
Lap joint samples using FSW for aerospace application, consisting of a 1.5 mm thick plate of AA7075-T6 on top of a 2.5 mm thick plate of AA2024-T3, were performed with different pin shapes and welding parameters in order to create different defects. The standard tool with a scrolled shoulder (19 mm diameter) and a pin (6.3 mm diameter pin) was used. Figure 2 shows an F-SAFT image of a cross-section (or B-scan) and the corresponding metallography of a lap joint, with inspection from the far side of the tool. The presence of hooking in the advancing side near the interface is clearly visible. F-SAFT reconstruction is found very useful for the identification of hooking
defect by properly reducing the size of an indication having a parabolic shape. A wormhole is also observed and occurs when the ratio between the welding speed and the tool rotation speed is too high or too low [5]. More importantly, a kissing bond present in the weld is detected by laser-ultrasonics as a slight reflection along the interface, in addition to that from the weld surface.
a) w o rm h o le h o o k in g k is s in g b o n d w o rm h o le h o o k in g k is s in g b o n d b)
Figure 2. Cross-section of a lap joint with many defects. a) F-SAFT image with inspection from the far side of the tool and b) corresponding metallography
2.3 Inspection of butt joints
Samples were welded using FSW in butt configuration. A first sample was prepared with 2-mm thick AA7075-T6 sheets with a tool composed of a concave shoulder (diameter of 10 mm) and a threaded cylindrical pin (diameter of 3 mm). The pin length was purposely made too short (1.2-mm long) to produce a lack of penetration (LOP). Figure 3 shows an F-SAFT image and the corresponding metallography of a cross-section of the butt joint with a constant LOP. Measurements were made on the tool side to detect the LOP on the opposite side. The LOP is well observed and appears as a lack of signal of the longitudinal wave near the bottom surface. From metallography, the LOP shown has a width of about 10 µm and a depth of 0.6 mm. The detection of a 0.3 mm deep LOP in a similar specimen was also observed. However, the quantitative estimation of the depth appears difficult, a situation similar to that found in a previous work for crack detection [6].
A comparison between the detection limit and the mechanical performance was investigated. For this purpose, a second butt joint was prepared using 2.5-mm thick AA2024-O sheets with a tool composed of a scrolled shoulder (diameter of 19 mm) and a threaded cylindrical pin (diameter of 6.3 mm). For this experiment, the pin penetration was progressively increased from 1.2 mm to 2.5 mm during welding along the 355-mm in length joint. This operation introduced a variable weld depth and, consequently, a gradual LOP on the back-side of the weld. Metallographic examination at several locations revealed a LOP for a penetration of the rotating tool (shoulder and pin) lower than 2.2 mm from the top surface. Notice that to produce a good weld, the pin does not have to touch the bottom surface of the plate because of the stirring action
a) b)
Figure 3. Cross-section of a butt joint with a lack of penetration. a) F-SAFT image with inspection from the far side of the tool and b) corresponding metallography
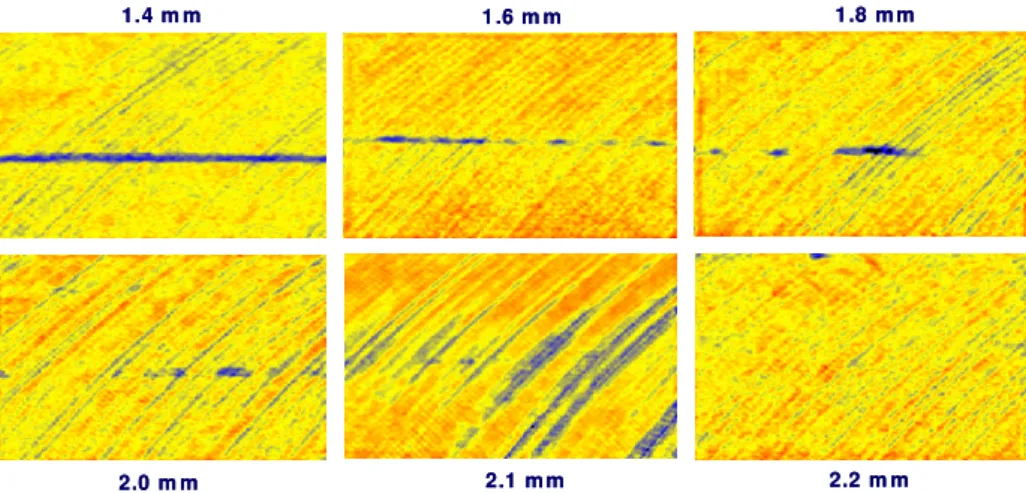
The inspection of regions of dimensions 10 mm x 10 mm was performed along the weld at regular intervals. Figure 4 shows the F-SAFT images of the bottom surface at different locations, with the pin penetration indicated for each image. Indications of LOP along the weld are well observed for pin penetrations less than 2.2 mm, starting from a continuous line and finishing with an irregular trace. The irregular appearance of a LOP implies that many cross-sectional views are required for weld assessment by metallography. Bending tests were also performed on different portions of this sample. No failure was observed for pin penetration larger than 2.1 mm. This is in good agreement with the F-SAFT results as well as with those from metallography.
Figure 4. F-SAFT images of the bottom surface for different pin penetrations along the weld as indicated.
3. Residual stress measurement
3.1 Test sample and numerical analysisWeldments made of 2.3-mm thick AA2024-T3 sheets were performed in butt configuration using a standard FSW tool (cylindrical threaded pin of 6.3-mm diameter and a concave shoulder of 12.7-mm diameter). A tool travel speed of 6 mm/s and a spindle speed of 1000 RPM were used. During welding and for later residual stress measurements, the test coupon was clamped tightly on a thick steel plate. This portable clamping anvil avoided the deformation of the test coupon during and after welding. The FSW process performed on the test coupon was simulated with a 3D finite element model (FEM) using the LS-Dyna package. For simplicity, the FSW tool was modelled as a heat source moving along the weld seam without material stirring. This is reasonable assumption as the formation of residual stresses in FSW is mainly dominated
1.4 m m 1 .6 m m 1 .8 m m
2.0 m m 2.1 m m 2.2 m m
1.4 m m 1 .6 m m 1 .8 m m
by the heat input. The boundary condition was the heat generation below the tool shoulder, with a heat flux of 11x106 W/m2 corresponding to the above FSW parameters. Also, the tool shoulder and the backing anvil were treated as rigid contact surfaces and the edges of the coupon were restrained to simulate the clamping fixture.
With this model, the temperature and stress distributions can be obtained at each time step while the tool is advancing on the sheet. Figure 5 shows the temperature profile across the weld line when the maximum is reached (Fig. 5a) as well as the stress profiles after welding (Fig. 5b). The z stress is along the weld axis and the x stress is across the weld. An important result of the simulations is that the stresses are almost constant through the depth of the sheet except near the weld center, which makes residual stress measurement much easier. The phenomenon may be explained by the relative thinness of the used aluminium coupons compared to the large size and power of the heat source. In this case, the thermal gradients are almost zero through the coupon thickness, resulting in constant stresses.
a) 0 50 100 150 200 250 300 350 400 0 10 20 30 40 50 Distance (mm) T e m p e ra tu re ( °C ) Numerical simulation Thermocouple b) -50 0 50 100 150 200 250 300 0 10 20 30 40 50 Distance (mm) S tr e s s ( M P a ) z stress x stress
Figure 5. Calculated transverse profile across the weld line of a) maximum temperature and b) residual stresses after welding from finite element simulations of the FSW process
3.2 Laser-ultrasonic setup
The laser-ultrasonic setup is presented in Figure 6. The same generation laser, detection laser and photorefractive interferometer are used, but with a separation between a line source and line detection. With this configuration, LSSLW and SAW up to 30 MHz are generated and detected in aluminum. However, a bandpass filter was applied to all signals for velocity measurements at a center frequency of 10 MHz. A scanning system with a mirror and a translation table controls the source to receiver distance from 3 to 20 mm. The selection of an adequate distance is a tradeoff between a sufficient SNR and time resolution associated with small velocity changes. Also, the sample is mounted on a translation table to get a stress profile. Neglecting the small coupling, the stress in a given direction is obtained by propagating the ultrasonic mode in that direction.
For precise velocity measurement, cross-correlation of the signal associated to the LSSLW or SAW arrival is performed with a reference signal obtained on an unstressed similar sample. The resulting time-of-flight (TOF) variation is related to the velocity variation by the simple formula ∆V/V =−∆t/t, assuming no source-to-receiver distance
variation. Since the LSSLW is found much more sensitive to stress, σ, a compensation using the SAW can be made, for changes in path length or other effects, using the relation:
Pσ P P R R K t t t t V V ≈ ∆ − ∆ = ∆ (1) where the subscript denotes the wave mode (R: SAW or P: LSSLW). The acoustoelastic coefficient, KP, can be obtained experimentally as calibration. A positive velocity (negative TOF) variation indicates a compressive (negative) residual stress.
Figure 6. The laser-ultrasonic setup for residual stress measurement
3.3 Residual stress profile
Laser-ultrasonic measurements have been conducted on the test specimen clamped on a thick steel backing anvil. The TOF variations of the LSSLW due to the z and x stresses as a function of the distance from the weld center were obtained, including SAW compensation for the other effects. For a more direct comparison, the coefficient KP = -0.40 % / 100 MPa taken from [7] for aluminum was used. With this calibration, Figure 7 shows the profiles for both the z stress and x stress obtained from laser-ultrasonic measurements. The agreement with the calculated profiles in Figure 5b is very good, noting that the measurement range starts at about 7 mm from the weld centre line. One discrepancy however is the cross point of the z stress going from tensile to compressive stress at a position of 8 mm in the calculation, and 11 mm from laser-ultrasonic measurements.
Strain gauge measurements were performed on three different specimens for the z stress only. The transverse profiles show a fairly good agreement with those from the numerical analysis and laser ultrasonics. However, the cross point from tensile to compressive stress is at a different position, about 20 mm. Also, the impact of heat involved in the FSW process, that may produce some microstructural changes and affect the velocity measurements, was investigated. Many coupons in absence of stress were heated at different temperatures for 3 min. and cooled down at room temperature where TOF measurements were performed. The TOF variations of the LSSLW are small, within 0.03 %, when using the SAW compensation.
Pulsed Nd:YAG laser (1064 nm; 200µs)
Translation table
Photo refractive interferometer (INP:Fe or AsGa)
Pulsed Nd :YAG Laser (355 nm; δ Sample Translation table Optical fibers Photorefractive interferometer (InP:Fe or GaAs)
Pulsed Nd :YAG laser (355 nm; 35 ps)
-50 0 50 100 150 200 250 300 0 5 10 15 20 25 30 35 40 45 50 Distance (mm) S tr e s s ( M P a ) z stress x stress
Figure 7. Transverse profile across the weld line of the z stress and x stress using laser ultrasonics
4. Conclusions
The applicability of laser ultrasonics for both defect detection and residual stress measurement was demonstrated. Ultimately, the approach could allow fast scanning for weld assessment along the tool path. When combined with F-SAFT for defect detection, discontinuities such as wormholes, hooking and lack of penetration were clearly detected in the lap or butt configuration. Moreover, the detection of kissing bonds could be possible in lap joints with frequencies up to 200 MHz. Lack of penetration in butt joints were shown to be irregular, which means that many cross-sectional views or bending tests are required. Also, the detection limit was found to coincide with the conditions of reduced mechanical properties. Laser ultrasonics could also be used to measure residual stresses induced by the FSW process. The method is based on monitoring the small velocity change of the LSSLW with the SAW compensation for other effects. The residual stress profile measured across the weld line was in very good agreement with results from simulations and strain gauge measurements. However, the cross point from tensile to compressive stress was different for the different methods.
References
1. Y.S. Sato, H. Takauchi, S.H.C. Park and H. Kokawa, “Characteristics of the kissing-bond in friction stir welded Al alloy 1050”, Mat. Sci. Eng. A 405, 333-338, 2005. 2. P. Michaleris and X. Sun, Finite element analysis of thermal tensioning techniques
mitigating weld buckling distortion, Welding Journal 76, pp. 451-S – 457-S, 1997. 3. C. Bescond, J.-P. Monchalin, D. Lévesque, A. Gilbert, R. Talbot and M. Ochiai,
Determination of residual stresses using laser-generated surface skimming longitudinal waves, Proc. of the SPIE, Symp. on NDE for Health Monitoring and Diagnostics 5767, pp. 175-186, 2005.
4. D. Lévesque, A. Blouin, C. Néron and J.-P. Monchalin, “Performance of laser-ultrasonic F-SAFT imaging”, Ultrasonics 40, 1057-1063, 2002.
5. L. Dubourg, M. Jahazi, F.O. Gagnon, F. Nadeau, and L. St-Georges, “Process window optimization for FSW of thin and thick sheet Al alloys using statistical methods”, Proc. of the 6th Intern. FSW Symposium, St-Sauveur, Canada, 2006. 6. D. Lévesque, M. Ochiai, A. Blouin, R. Talbot, A. Fukumoto and J.-P. Monchalin,
“Laser-ultrasonic inspection of surface-breaking cracks in metals using SAFT processing”, IEEE Intern. Ultras. Symp. Proc., New York, 732-735, 2002.
7. D.E. Bray and W. Tang, Subsurface stress evaluation in steel plates and bars using Lcr ultrasonic wave, Nuclear Eng. & Design 207, pp. 231-240, 2001.