Publisher’s version / Version de l'éditeur:
Vous avez des questions? Nous pouvons vous aider. Pour communiquer directement avec un auteur, consultez la
première page de la revue dans laquelle son article a été publié afin de trouver ses coordonnées. Si vous n’arrivez pas à les repérer, communiquez avec nous à [email protected].
Questions? Contact the NRC Publications Archive team at
[email protected]. If you wish to email the authors directly, please see the first page of the publication for their contact information.
https://publications-cnrc.canada.ca/fra/droits
L’accès à ce site Web et l’utilisation de son contenu sont assujettis aux conditions présentées dans le site LISEZ CES CONDITIONS ATTENTIVEMENT AVANT D’UTILISER CE SITE WEB.
RILEM, 2nd International Symposium on Advances in Concrete Through Science and Engineering [Proceedings], pp. 1-15, 2006-09-01
READ THESE TERMS AND CONDITIONS CAREFULLY BEFORE USING THIS WEBSITE.
https://nrc-publications.canada.ca/eng/copyright
NRC Publications Archive Record / Notice des Archives des publications du CNRC :
https://nrc-publications.canada.ca/eng/view/object/?id=bedec8af-029a-4fe9-96e3-55790cfbb648 https://publications-cnrc.canada.ca/fra/voir/objet/?id=bedec8af-029a-4fe9-96e3-55790cfbb648
NRC Publications Archive
Archives des publications du CNRC
This publication could be one of several versions: author’s original, accepted manuscript or the publisher’s version. / La version de cette publication peut être l’une des suivantes : la version prépublication de l’auteur, la version acceptée du manuscrit ou la version de l’éditeur.
Access and use of this website and the material on it are subject to the Terms and Conditions set forth at The Thermal decomposition of Ca(OH)2 polymorphs
http://irc.nrc-cnrc.gc.ca
T he T he r m a l de c om posit ion of Ca (OH )2
polym or phs
N R C C - 4 6 3 1 0
B e a u d o i n , J . J . ; S a t o , T . ; T u m i d a j s k i , P . J .
A version of this document is published in / Une version de ce
nd
document se trouve dans : 2 International Symposium on
Advances in Concrete Through Science and Engineering,
Québec City, Sept. 11-13, 2006, pp. 1-15
THE THERMAL DECOMPOSITION OF Ca(OH)
2POLYMORPHS
James J. Beaudoin (1), Taijiro Sato (1) and Peter J. Tumidajski (2)(1) Institute for Research in Construction, National Research Council, Canada
(2) Centre for Advanced Building Technologies, The City College, George Brown, Canada
Abstract
The thermal decomposition of different polymorphs of Ca(OH)2 with varying degrees of crystallinity and surface area was investigated. The nitrogen surface area values ranged from 3.7 to 31.1 m2/g. The presence of two separate and distinct thermal decomposition events was observed depending on the degree of crystallinity. Binary mixtures of Ca(OH)2 with substantially different degrees of crystallinity exhibited well defined thermal decomposition doublets. In addition Differential Scanning Calorimetry (DSC) experiments (for cycles of heating and cooling) performed in controlled environments pre-conditioned to various relative humidities (RH) also indicated the presence of two distinct endothermal doublets. The endothermic peak temperatures were dependent on the RH and temperature history of the Ca(OH)2 samples. An assessment of factors affecting the observed thermal behavior included: investigation of particle size and degree of crystallinity; observation of combined strain and particle size broadening (Williamson-Hall X-ray plots); heat capacity-temperature characteristics. A thermodynamic analysis of the thermal decomposition process is presented.
1. INTRODUCTION
The importance of Ca(OH)2 in cement science is paramount. It occupies up to 26% by volume of hydrated Portland cement binders [1]. It is both a reaction product and a reactant. The well known hydration reactions associated with the silicate phases in Portland cement are the primary source. The Ca(OH)2 is also a reactant with the various supplementary cements in widespread use e.g. fly ash, silica fume, slag and metakaolin [2]. Numerous studies have focused on the role of Ca(OH)2 in sustainability issues related to concrete performance. Reactions that influence the durability of cement-based materials often involve Ca(OH)2 [3].
Relatively recent applications of nanotechnology in cement science involve nanoparticulate or nanocomposite cement phases [4]. The focus of this work is the thermoanalytical characterization of nanoparticulate Ca(OH)2. The presence of two distinct thermal decomposition events was detected for binary mixtures of Ca(OH)2 polymorphs. Doublets in DTA curves of hydrated cements have been previously observed for the decomposition of Ca(OH)2 by Greene and Herrick et al. [5, 6].
It is apparent that the characterization of nanomaterials in cement systems will become increasingly important. Results of an investigation to examine the thermal decomposition behavior of nano-sized Ca(OH)2 particulates are presented. The influence of the degree of crystallinity and decomposition environment is examined. Thermodynamic arguments for the existence of distinct forms of Ca(OH)2 and their thermal performance are given.
2. EXPERIMENTAL
2.1 Materials
CaO: Calcium oxide was prepared as described in Table 1. Table 1: Preparation of CaO
Preparation CaO-1 Reagent grade Ca(OH)2 was heated to 600
o
C and held isothermally for 1 hour. The nitrogen surface area of CaO-1 was 31.2 m2/g.
CaO-2 Reagent grade CaCO3 was heated to 1050 o
C and held isothermally for 1 hour. The nitrogen surface area of CaO-2 was 2.6 m2/g.
CaO-3 Reagent grade CaCO3 was heated to 1400 o
C and isothermally held for 1 hour. The nitrogen surface area of CaO-3 was 1.9 m2/g.
CaO-4 Reagent grade CaCO3 was heated at 1050 o
C and held isothermally for 3 hours. The nitrogen surface area of CaO-4 was 3.1 m2/g.
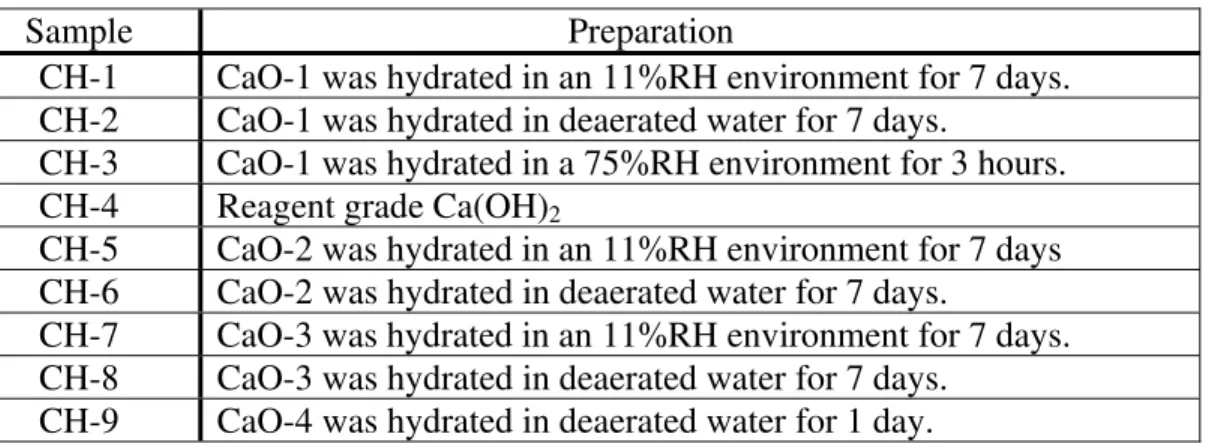
Ca(OH)2: Nine different samples of Ca(OH)2 were prepared. The procedures are described in Table 2. The reagent grade Ca(OH)2 was supplied by Anachemia Canada Inc., Montreal, Canada.
Table 2: Preparation of Ca(OH)2 samples
Sample Preparation
CH-1 CaO-1 was hydrated in an 11%RH environment for 7 days. CH-2 CaO-1 was hydrated in deaerated water for 7 days.
CH-3 CaO-1 was hydrated in a 75%RH environment for 3 hours. CH-4 Reagent grade Ca(OH)2
CH-5 CaO-2 was hydrated in an 11%RH environment for 7 days CH-6 CaO-2 was hydrated in deaerated water for 7 days.
CH-7 CaO-3 was hydrated in an 11%RH environment for 7 days. CH-8 CaO-3 was hydrated in deaerated water for 7 days.
CaCO3: The reagent grade CaCO3 was supplied by Anachemia Canada Inc., Montreal, Canada. The BET surface area was 2.6 m2/g.
LiCl and NaCl: Reagent grade LiCl was supplied by Fisher Scientific, New Jersey, USA and NaCl by EMD Chemicals Inc., New Jersey, USA.
2.2 TG/DSC
A TA Instruments SDT-Q600 Thermal Analyzer was used for simultaneous TG and DSC measurements. A heating rate of 10°C/min (from room temperature to 1400°C) in a nitrogen gas environment (100mL/min) was employed. TG results are plotted in a derivative form (DTG). Heat flow data from the DSC measurements were used for heat capacity calculations.
The controlled environment DSC experiments employed a Dupont 1090 Thermal Analyzer used in conjunction with a DSC cell. A heating rate of 10°C with a nitrogen flow of 100 mL/min was used. The nitrogen was pre-conditioned at different values of RH, (12 – 100%). The nitrogen was passed over an aqueous salt solution at a predetermined RH. This was followed by flow into a vessel equipped with an RH sensor and through a flow meter into the DSC cell. It is noted that as the temperature in the DSC cell increases the saturation vapor pressure increases. The effective RH would therefore be less.
2.3 X-ray diffraction
A Scintag XDS 2000 instrument was used for X-ray diffraction measurements. CuKα radiation (45 KV, 35 mA) was used. The scan rate was 0.025 degree/sec.
2.4 Surface area – BET method
Nitrogen surface area measurements were obtained with a Quantachrome Quantasorb Sorption System. Samples were dried at 140°C for 10 minutes prior to the measurements. The surface area values for the Ca(OH)2 samples are given in Table 3.
Table 3: BET surface area values for various Ca(OH)2 preparations
Sample CH-1 CH-2 CH-3 CH-4 CH-5 CH-6 CH-7 CH-8 CH-9 Surface Area,
m²/g 20.1 31.1 21.5 16.6 3.7 7.3 5.1 7.8 6.5
3. RESULTS AND DISCUSSION
The presence of two separate and distinct thermal decomposition events in DTG and DSC experiments conducted with different Ca(OH)2 preparations tested in environments conditioned at various RH was observed. The results are presented in three sections to illustrate the effect of degree of crystallinity, hydration environment and the underlying thermodynamic basis for the arguments advanced.
3.1 Effect of varying degree of crystallinity on thermal decomposition
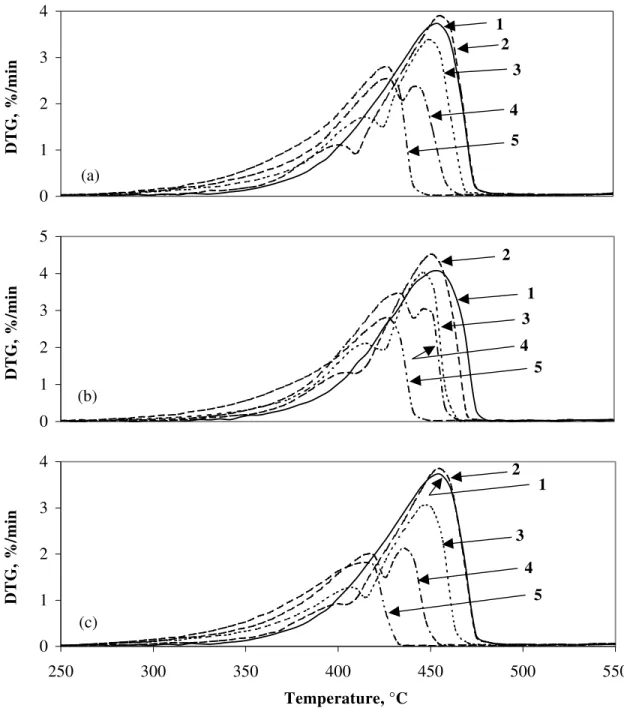
The DTG curves for the vapor hydrated (CH-1, 11%RH) and liquid hydrated (CH-2) Ca(OH)2 preparations are presented in Figure 1(a). Well defined doublets appear and are consistent with the relative proportions of each sample. The DTG results for CH-1 and CH-6 (liquid hydrated, lower surface area than CH-2) show similar trends, Figure 1(b). The vapor
hydrated CH-1 preparation had the lowest decomposition temperature. Characteristic doublets were also observed for binary mixtures of the vapor hydrated material (CH-3, 75%RH) and the high surface area material (CH-2), Figure 1(c). Similar behavior was observed for binary mixtures of vapor hydrated (CH-5, 11%RH) and liquid hydrated (CH-6) as well as for (CH-7, 11%RH) and liquid hydrated (CH-8), not shown.
0 1 2 3 4 DTG, %/min 5 1 2 3 4 0 1 2 3 4 5 DTG, %/min 5 1 2 3 4 (b) 0 1 2 3 4 250 300 350 400 450 500 550 Temperature, °C DTG, %/min 5 1 2 3 4 (c) (a)
Figure 1: DTG curves for binary mixtures of Ca(OH)2 polymorphs. Curves 1 – 5 refer to mixtures of (a) CH-1 and CH-2, (b) CH-1 and CH-6 and (c) CH-3 and CH-2. The content of
CH-2, CH-6 and CH-2 respectively in (a), (b) and (c) for curves 1 – 5 is 100, 80, 50, 20 and 0%
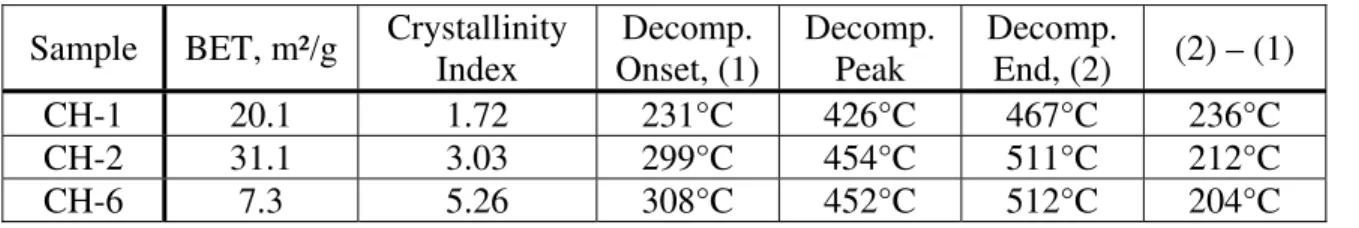
Results of investigations on the effect of particle size on the decomposition temperature are often conflicting. Differences in fact may be due to variation in the degree of crystallinity [7]. For example, there appears to be no particle size effect for Ca(CO)3 if the degree of crystallinity of the particles is similar [8]. Two methods were used to assess the relative differences in crystallinity of the Ca(OH)2 preparations - calculation of a crystallinity index and Williamson-Hall analysis [9]. The index method utilizes the inverse of the peak width at half peak height (e.g. at 2θ = 34.09°) from the baseline as an indicator of the degree of crystallinity. Values of the crystallinity and thermal decomposition temperature support the view that the on-set of decomposition temperature is dependent on the degree of crystallinity (Table 4).
Table 4: Characterization data for selected Ca(OH)2 preparations Sample BET, m²/g Crystallinity
Index Decomp. Onset, (1) Decomp. Peak Decomp. End, (2) (2) – (1) CH-1 20.1 1.72 231°C 426°C 467°C 236°C CH-2 31.1 3.03 299°C 454°C 511°C 212°C CH-6 7.3 5.26 308°C 452°C 512°C 204°C
The second method utilized the Williamson-Hall plots constructed from the X-ray data using Bruker AXS. TOPAS V2.1 Software [10]. It has been shown that line broadening can be attributed to simultaneous strain and small particle size broadening [9]. Plots of Bcosθ versus sinθ are linear with the intercepts providing semi-quantitative values of the volume weighted characteristic length <L>vol and the slopes indicating the level of lattice strain. The software enables the ‘B’ term to be extracted from the ‘full width-half maximum’ values (FWHM) of ‘double-Voigt’ fitting to the sample and the LaB6 standard. The magnitude of the slopes of the lines and the degree of disorder are in the following order- CH-1> CH-2> CH-6- indicating that the lower decomposition temperature would be expected for the CH-1 preparation.
3.2 Effect of heating-cooling environment on thermal decomposition
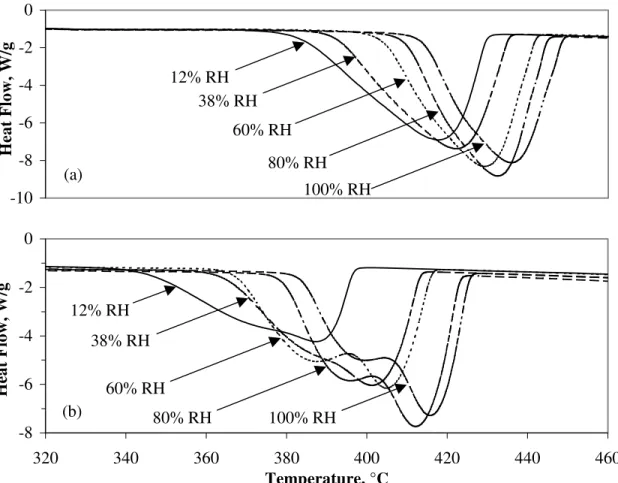
The presence of at least two different forms of Ca(OH)2 was confirmed by the results of DSC measurements performed in an atmosphere of a continuous flow of nitrogen pre-conditioned to various RH ranging from 12 to 100%. The Ca(OH)2 sample CH-9 was selected for this study. On first heating it decomposes at higher temperatures as the RH of the environment increases, Figure 2(a). The Ca(OH)2 decomposes more readily in the lower RH environments as the on-set of the endotherm and peak temperatures are reduced. The DSC curves that are typical of the re-heating curves after cooling are shown in Figure 2(b). The shift of the curves with RH is also observed. More well defined doublets also appear in the higher RH environments. The effect of cooling and re-heating on re-hydration and decomposition of the Ca(OH)2 is illustrated in Figure 3. The CaO starts to re-hydrate at a higher temperature in the 100%RH environment. The range of the effective RH variation with temperature in the 100%RH cell (RH changes during the test due to non-equilibrium conditions) is much wider than for lower humidity conditions. This might be the reason for the more distinctive doublets in the 100%RH environment. Hydration of a sample produced in
different RH environments would result in a difference in degree of crystallinity and therefore a difference in decomposition temperature.
-10 -8 -6 -4 -2 0 Heat Flow, W/g 12% RH 38% RH 60% RH 80% RH 100% RH (a) -8 -6 -4 -2 0 320 340 360 380 400 420 440 460 Temperature, °C Heat Flow, W/g 12% RH 38% RH 60% RH 80% RH 100% RH (b)
Figure 2: DSC curves for (a) 1st heating of CH and (b) re-heating after cooling in various RH environments -8 -6 -4 -2 0 2 4 100 150 200 250 300 350 400 450 500 Temperature, °C Heat Flow, W/g
Figure 3: DSC curves for a typical cooling of CaO and re-heating of CH in a 38% and 100% RH environments
Cooling
Re-heating
3.3 Thermodynamic analysis of the thermal decomposition of Ca(OH)2
The following arguments are intended to support the previous discussion concerning the influence of the degree of crystallinity and the RH of the test environment on the thermal decomposition of Ca(OH)2.
Heat capacity (Cp) - temperature functions were determined for selected Ca(OH)2 preparations. The Cp values were calculated using the heat flow data obtained from the differential scanning calorimetry (DSC) results. They were calculated using the equation:
(
-1) (
-1 -1) (
-1 o 1) (
o -1 p Wg Js g Jg K Ks t T C m Q ⋅ = = = ⎟ ⎠ ⎞ ⎜ ⎝ ⎛ ∂ ∂ ⋅ = ⎟ ⎠ ⎞ ⎜ ⎝ ⎛ −)
(1) where, Q is the applied power (Watts or Joules per second),m is the sample mass (grams),
C is the heat capacity (Joules per gram per degree Kelvin), p ⎟
⎞ ⎜ ⎛ ∂T
is the heating rate (degree Kelvin per second). ⎠
⎝ ∂t
mate changes in enthalpy (ΔH) and entropy (ΔS) for each of the
,3) The determination of the change in Gibbs free energy can also be calcu
G = (4)
RT
RT re) (5)
was calculated using Kirchoff’s lationship. The enthalpy and entropy changes at any temperature were calculated utilizing
Ca(OH) CaO T o T R, = + ⇒ Δ
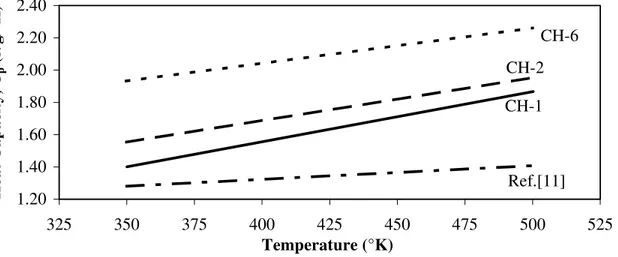
The curves were approximately linear in the temperature range, 350-500o, Figure 4. These functions can be used to esti
preparations. Generally,
∫
∂ = 1 T T C ΔH and =∫
∂ 1 T T /T C ΔS (2 T p T plated from the general relationship:
Δ ΔH- TΔS
Hence, ΔGo =ΔHo –TΔSoRT (at standard temperature and pressu The decomposition temperature, Td, of the CH specimens
re
the enthalpy and entropy changes at the standard condition and the heat capacities of the reactants and products in the range of temperatures under consideration. The Kirchoff’s relationship was represented as:
d (g) 2 2(s) (s) H O T H -) g ( 2O H , p C K) 373 (T H C CP,Ca(OH)2(s) p,CaO(s) Δ l→g = ° ) l ( 2O H , p ΔHo K 298 R, ° C K 298 T O H Ca(OH)2(s) ⇒ CaO(s) + 2 (l) = °
2.00 2.20 2.40 p (J/g/°K) CH-2 CH-6 Heat Capacity, C 1.20 1.40 1.60 1.80 325 350 375 400 425 450 475 500 525 Temperature (°K) CH-1 Ref.[11]
Figure 4: Region of Linear Temperature Dependence for Heat Capacity Values of CH
for the
(6) = –151,600 – 68,315 – (–235,500) = 15,585 calories mol–1
The heat required to bring CaO(s) from 298oK to a higher temperature T is:
(7)
= Φ1(T) cal mol-1
ilarly for H O taking into account the phase transition at 373oK:
T 373 373 298 ΔH (8) =Φ (T) cal mole-1
he enthalpy released as Ca(OH)2 is brought from T to 298°K is:
) 3
Using Kirchoff’s rel ΔH ΔH 3 o T R, 2 o + + + = (10) Polymorphs
The standard enthalpy of reaction at 298oK was calculated from tabulated values enthalpy of formation of the reactants and products.
ΔH – ΔH ΔH ΔH o Ca(OH) f, o O H f, o CaO f, o R,298K = (s) + 2 (l) 2(s)
∫
∂ = T 298 CaO p, 1 C T ΔH (s) Sim 2 (l)∫
∫
∂ + + ∂ = p,H O l→g p,HO 2 C 2 (l) T ΔH C 2 (g) T 2 Now ) S ( 2 ) OH ( Ca , p C = a + bT cal mol-1°K-1 T∫
∂ = 298 Ca(OH) p, 3 C T ΔH (9 T 2(s) = Φ (a, b, T) cal.mol-1 ationship: 0 ΔH ΔH – ΔH 1 R,298Ko RT
ΔH = Φ4 (a,b,T) Entropies can be calculated similarly leading to the following:
s n reaction is determined from:
T R, T R, ΔH T S G (13) = Φ6 (a, b, T) following (11)
SRTo=Φ5 (a, b, T) cal mol-1°K-1 (12) Δ
The Gibbs free energy for the decompo itio
o o
o = − Δ
Δ R,T
previous arguments. The generalized form is:
⎟ ⎟ ⎠ ⎞ ⎜ ⎜ ⎛ + = o CaO(s) T R, T R, a ln RT ΔG ΔG ⎝ ⋅ 2 (g) 2 Ca(OH) O H a P (14)
Ca(OH)2, respectively, and is the no
alorie
ion temperature of a(OH)2, Td. It can be seen th p temperatu dependence for the Ca(OH) he heat capacity
f Ca(OH)2(s) prepared under different conditions Heat Capacity (a + bT where (s) CaO a and ) s ( 2 ) OH ( Ca
a are the activities of CaO and
(g)
2O
H
P
rmalized partial pressure of water vapor. R is the universal gas constant given as 1.987 s mol-1 K-1. With the appropriate substitutions, the generalized Gibbs free energy of c
reaction is,
ΔGRT = Φ7 (a, b, T, PH2O(g)) cal.mol-1 (15) The temperature at which ΔGRT is zero corresponds to the decomposit
C at Td depends on the RH condition and the C re 2 samples prepared under different conditions. T
(Cp) results are summarized in Table 5. able 5: Heat capacities o
T ) J g–1 K–1 Calories m lo–1 K–1 Preparation a b a b CH-1 0.3136 0.0032 5.55 5.489×10⁻² CH-2 0.6204 0.0027 10.99 4.781×10⁻² CH-6 1.1654 0.0022 20.64 3.896×10⁻² Reference alues – Linear
Approxim V
ation (Ref. [11]) 0.9811 0.0009 17.37 1.594×10 –2
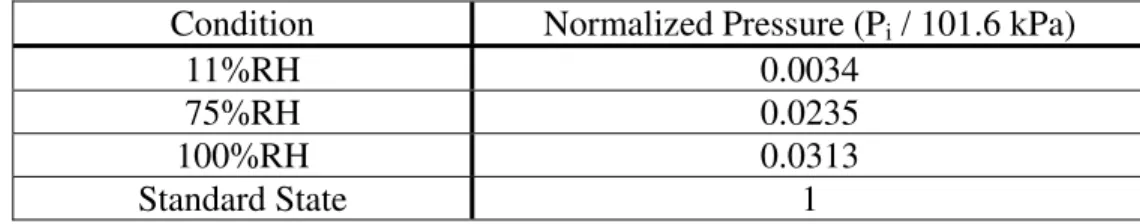
The normalized water vapor partial pressures for 11%, 75%, and 100% RH and for the standard state (i.e. 101.3 kPa) are given in Table 6.
Calculated values for the on-set of the decomposition temperature Td are given in Table 7. The decomposition temperature of CH for all preparations increases as the humidity in the
ecomposition environment increases. Further the Ca(OH)
d 2 prepared by liquid phase
by vapor hydration hydrated s
hydration decomposes at higher temperatures than the Ca(OH)2 prepared
uggesting that the liquid hydrated samples are more thermodynamically stable than the vapor s
Table 6: Experimental humidity conditions
Condition Normalized Pressure (Pi / 101.6 kPa)
11%RH 0.0034 75%RH 0.0235 100%RH 0.0313
Standard State 1
Table 7: Calculated decomposition temperatures, Td (oC) for Ca(OH)2 Vapor Hydrated Preparations Liquid Hydrated Preparations Normalized H2O (g) Pressure CH-1 CH-2 CH-6
Using Reference Values (Ref. [11])* Dry Nitrogen 301 320 334 - 0.0034 311 318 338 303 0.0235 374 386 422 359 0.0313 385 398 438 368 1 582 626 925 514
* The prep ure for the C 2
4. CLUSIONS
– Ca ons of varying crystallinity can be produced by employing vapor phase and liquid phase hydration of CaO.
thermal decomposition temperatures (endothermal doublets) can easily be produced.
ec temperatures of Ca(OH)2 appe the f cr n to surf ticle size
– gram omposition of Ca(OH) icate the o distinct forms (reflecte o endot when t mposition and re-hydration process
contro humidity and CO2 free environment.
– agnitude oth the l nd high t rature endother eak heights is ent on th tive humidity and temperature in a DSC test environment.
– temperature is conducive to formation of a more crystalline Ca(OH)2 product, while at the sam e, vapor phase hydration promotes formation of a microcrystalline – The thermodynamic analysis corroborates the validity of the previously observed
doublets in al spectral information (DTG, DSC) for Ca(OH)2. aration proced a(OH) used in Ref. [11] was unspecified.
CON (OH)2 preparati
– Two or more distinct forms of Ca(OH)2 with separate – Thermal d omposition
ystallinity tha s for the dec
ar to be related more to .
degree o ace area or par
Thermo 2 ind
he deco
presence of tw d by tw herms)
occur in a lled
The m of b ow a empe mic p
depend e rela Higher
e tim product.
the thermal analytic
– Thermodynamic calculations of the decomposition temperature of Ca(OH)2 support previous arguments that Ca(OH)2 with varying degrees of crystallinity can be produced. – The observations that the decomposition temperature of the various Ca(OH)2 preparations increases as the relative humidity of the environment under which decomposition occurs increases and that it is dependent on the degree of crystallinity of the Ca(OH)2 are compatible with thermodynamics – based arguments.
A The a
R E
[1 T
[2] M
in Concrete’, (CRC Press Inc., Boca Raton, Florida, 1987). [3 [4 [5 C [6] H s (1992) 277-282.
[7 Tanaka, T., ‘Simultaneous grinding and reaction’, Minerals Process, 5 (1964) 31.
e size on differential thermal analysis’, Nature, 201, (1964) 1019.
0] Bruker AXS.TOPAS V2.1 User Manual, Karlsruhe Germany (2003).
, O. and Alcock, C.B., ‘Metallurgical Thermochemistry, 5th Edn., (Pergamon Press,
CKNOWLEDGEMENTS
uthors would like to thank Mr. Gary Polomark for conducting many of the experiments. EF RENCES
] aylor, H.F.W., ‘Cement Chemistry’, 2nd Edn. (Thomas Telford, London, 1997).
alhotra, V.M., Ramachandran, V.S., Feldman, R.F. and Aitcin, P.C., ‘Condensed Silica Fume
] Glasser, F.P., ‘The role of Ca(OH)2 in Portland cement concretes’, in Materials Science of
Concrete - Special Volume: Calcium Hydroxide in Concrete, 6, Eds. J. Skalny, J. Gebauer, J. Odler, (Amer. Ceram. Soc., 2001) 11-36.
] Raki, L., Beaudoin J.J., Mitchell L.D., ‘Layered double hydroxide-like materials: nanocomposites or use in concrete’, Cem. Concr. Res. 34 (2004), 1717-1724.
f
] Green, K.T., ‘Early hydration reactions of Portland cement’, in Proceedings 4th International
ongress on Chem. of Cem., Washington DC, 1960, Vol. I, Session IV, Paper IV-1, 359-374. errick, J., Scrivener K. and Pratt P., ‘The development of microstructure in calcium
ulphoaluminate expansive cement’, in Proceedings Matls. Res. Soc., Vol. 245 ]
[8] Bayliss, P., ‘Effect of particl
[9] Williamson G.K. and Hall W.H.,’X-ray line broadening from filed aluminium and wolfram’, Acta Metallurgica, 1 (1953) 22-31.
[1
[11] Kubaschewski Toronto, 1979).