Publisher’s version / Version de l'éditeur:
Vous avez des questions? Nous pouvons vous aider. Pour communiquer directement avec un auteur, consultez la
première page de la revue dans laquelle son article a été publié afin de trouver ses coordonnées. Si vous n’arrivez pas à les repérer, communiquez avec nous à PublicationsArchive-ArchivesPublications@nrc-cnrc.gc.ca.
Questions? Contact the NRC Publications Archive team at
PublicationsArchive-ArchivesPublications@nrc-cnrc.gc.ca. If you wish to email the authors directly, please see the first page of the publication for their contact information.
https://publications-cnrc.canada.ca/fra/droits
L’accès à ce site Web et l’utilisation de son contenu sont assujettis aux conditions présentées dans le site
LISEZ CES CONDITIONS ATTENTIVEMENT AVANT D’UTILISER CE SITE WEB.
Client Report (National Research Council of Canada. Construction), 2016-10-31
READ THESE TERMS AND CONDITIONS CAREFULLY BEFORE USING THIS WEBSITE.
https://nrc-publications.canada.ca/eng/copyright
NRC Publications Archive Record / Notice des Archives des publications du CNRC :
https://nrc-publications.canada.ca/eng/view/object/?id=e47b00e3-d684-427d-8468-840b09756157 https://publications-cnrc.canada.ca/fra/voir/objet/?id=e47b00e3-d684-427d-8468-840b09756157
NRC Publications Archive
Archives des publications du CNRC
For the publisher’s version, please access the DOI link below./ Pour consulter la version de l’éditeur, utilisez le lien DOI ci-dessous.
https://doi.org/10.4224/23002873
Access and use of this website and the material on it are subject to the Terms and Conditions set forth at
Evaluation of thermal and moisture response of highly insulated
wood-frame wall assemblies: Part I: experimental trials in the field exposure
of walls test facility
Construction
Evaluation of Thermal and Moisture
Response of Highly Insulated
Wood-Frame Wall Assemblies
― Part I:
Experimental trials in the
Field Exposure of Walls test Facility
Report A1-006035
Bartko, M., Lacasse, M. A., G. Ganapathy
and
M. Nicholls
Table of Contents
Table of contents ... iii
List of Figures ... v List of Tables ... v Acknowledgements ... vii Executive Summary ... ix
1. Introduction ... 1
1.1 Overview ... 1
1.2 Objectives ... 2
2.0 Research Approach ... 4
2.1 Scope of Testing ... 4
2.2 Description of Wall Specimens ... 4
Test specimens ... 4
Instrumentation ... 8
2.3 Test Protocol ... 9
2.4 Monitoring ... 12
3.0 Results ... 13
3.1 Response of Walls assemblies... 14
4.0 Summary of Response of Walls assemblies ... 19
5.0 References ... 20
Appendix 1 Test Specimen Fabrication and Installation details ... 22
Appendix 2 Test Specimen Sensor Installation Details ... 24
Test specimens - Location of temperature thermocouples (TC) ... 24
Test specimens - Location of relative humidity sensors (RH) ... 26
Test specimens - Location of Pressure transducers ... 27
Test specimens - Location of moisture and liquid sensing tapes ... 28
W1
– Location of DETEC moisture sensing tapes in stud cavity ... 28
W2
– Location of DETEC moisture sensing tapes in stud cavity ... 29
W3
– Location of DETEC moisture sensing tapes in stud cavity ... 30
Appendix 3 ... 32
Pressure variations over monitoring period ... 32
Temperature variations over monitoring period... 33
List of Figures
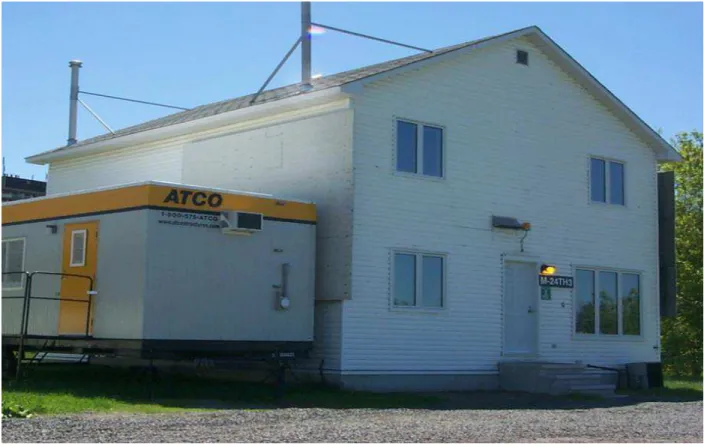
Figure 1. NRC-Construction’s Field Exposure of Walls (FEWF) test facility, located at the NRC
Montreal Road campus in Ottawa ... 3
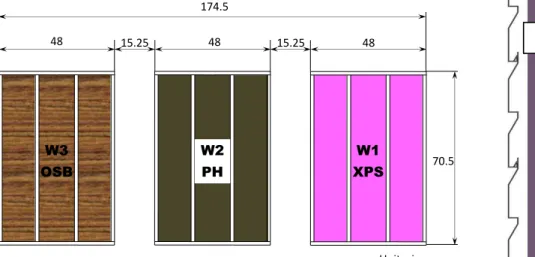
Figure 2. Schematic of three 2x6-in. (38 mm x 140 mm) wood-frame wall (residential) test specimens installed side-by-side in FEWF ... 6
Figure 3. Wall 1 (W1: XPS) - Horizontal cross-section through XPS wall assembly ... 6
Figure 4. Wall 2 (W2: PH) - Horizontal cross-section through Passive Haus wall assembly ... 6
Figure 5. Wall 3 (W3: OSB) - Horizontal cross-section through wall assembly with OSB as smart vapor barrier ... 6
Figure 6. Wall 1 (XPS) – (i) Stud wall wood frame with OSB, (ii) GF batt insulation in stud cavities, (iii) poly vapour barrier ... 7
Figure 7. Wall 2 (PH) - (i) Stud wall wood frame with diffusion board, (ii) wood fiber insulation in stud cavities, (iii) OSB smart vapour retarder (iv) interior wood fiber insulation ... 7
Figure 8. W3 (OSB) – (i) Stud wall wood frame with external XPS board, (ii) GF batt insulation in stud cavities, (iii) OSB smart vapour retarder ... 7
Figure 9. Installation of W1, W2, & W3 in FEWF showing (i) exterior layers under air cavity, furring strips & (ii) exterior cladding (vinyl siding) ... 7
Figure 10 – Deficiencies in wall test specimens showing location & size of deficiency in W1 (XPS) ... 12
Figure 11– Response of respective wall assemblies (Temperature [T]; RH at exterior insulation surface and dew point T) over monitoring period (2016); (i) W1 (XPS); (ii) W2 (PH); (iii) W3 (OSB) ... 16
Figure 12 – W1 : Response of moisture detection strip to the presence of moisture in the wall ... 17
Figure 13 – W2: Response of moisture detection strip to the presence of moisture in the wall ... 17
Figure 14 – W3: Response of moisture detection strip to the presence of moisture in the wall ... 17
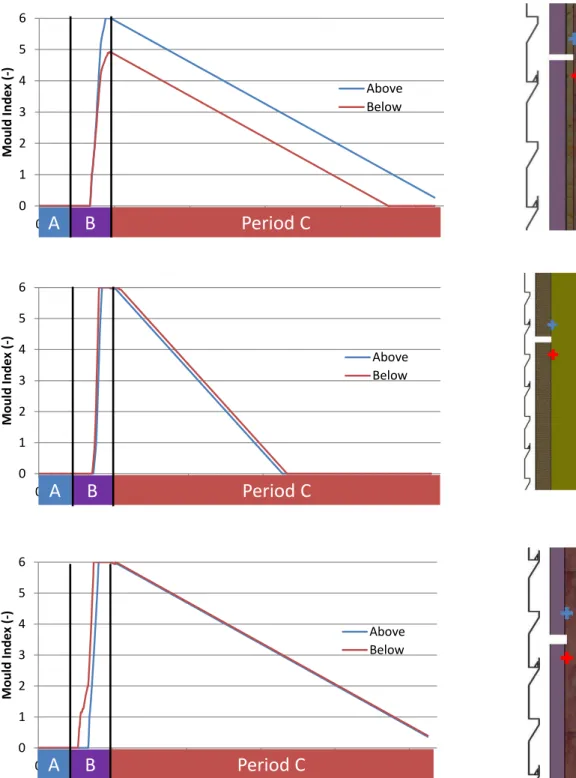
Figure 15 – Mold Index calculation results by Viitanen for monitoring period (2016) above and below the deficiency slits on exterior side; (i) W1 (XPS); (ii) W2 (PH); (iii) W3 (OSB) ... 18
List of Tables
Table 1. List of sensors used to determine hygrothermal response of test specimens to changing local exterior and interior conditions ... 9Table 2 – Selected array of sensors deployed within wall assembly of test specimen W1... 11
Table 3. - Test protocol over monitoring period (2016) ... 12
Acknowledgements
The authors wish to thank Canadian Wood Council contributing funding for this project. Also, the authors wish to thank NRC-Construction for providing the funding to enable
researchers to build, operate and maintain a state-of-the-art Field Exposure of Walls Facility (FEWF) that was used in this project.
Executive Summary
Over the years, the energy efficiency of the North American housing stock has significantly improved mainly due to higher insulation levels, more efficient windows and, more importantly, adoption of various energy efficiency measures by building codes. The increased insulation levels of building envelopes for homes leads to a multitude of opportunities as well as challenges. A major opportunity is to reduce heat losses and thereby significantly reducing the space heating loads. However, there are many challenges that necessitate changes in the current construction process, durability of products, and more importantly, the effect of higher insulation levels on the overall moisture performance and expected long-term performance of the building envelope. A major barrier to the uptake of highly insulated homes is the lack of proven evidence of reliable thermal and moisture performance of these homes as might be achieved in various climates of Canada.
The National Research Council of Canada (NRC) has undertaken field monitoring and computer modelling to investigate the risk of condensation in wall assemblies having different combinations of increased thermal resistance (R-value) of cavity insulation and of selected exterior insulation products. A set of three wall assemblies with different types of exterior insulation systems were chosen for the field study. The set of three wall assemblies range from total insulation value of RSI-4.96 to RSI 7.57 (R-29 to R-43). Full-scale testing included 8 months performance monitoring. These wall specimens were installed in a side-by-side test bay and were subjected to local climate conditions of Ottawa, Canada; on the interior of the specimens conditions were nominally maintained at 21°C and 35% RH. This report provides results of field trials of the three wall assemblies in terms of their hygrothermal performance and risk for condensation over a year of operation.
Building Regulations for Market Access Program
Evaluation of Thermal and Moisture Response of Highly Insulated
Wood-
Frame Wall Assemblies ─ Part I:
Experimental Trials in the Field Exposure of Walls Test Facility
Authored by:
M. Bartko, M. A. Lacasse, G. Ganapathy and M. Nicholls
A Report for the
Canadian Wood Council
ATT: Dr. Robert Jonkman
National Research Council Canada Ottawa ON K1A 0R6 Canada
31 October, 2016
This report may not be reproduced in whole or in part without the written consent of both the client and the National Research Council of Canada
Evaluation of Thermal and Moisture Response of Highly Insulated
Wood-Frame Wall Assemblies
─ Part I:
Experimental Trials in the Field Exposure of Walls Test Facility
M. Bartko, M. A. Lacasse, G. Ganapathy and M. Nicholls
1. Introduction
1.1 Overview
The Canadian market for new residential home construction and existing retrofits was about 79 million m2, which represents an investment of about CDN $9.7 billion in 2012 [Error! eference source not found.]. Conservatively assuming a 25% market share by 2025, highly-insulated (enhanced) envelopes could save 11.6 PJ of energy and 1.2 Mt of Green House Gas per year [1]. This represents a significant economic opportunity for the housing industry within Canada and for value-added exports such as manufactured panelized wall systems. This project is needed to provide the scientific data and analysis necessary to characterize the thermal and moisture performance of advanced residential wall systems. Such information is needed to update any considerations for further energy efficiency improvements to building codes and technical requirements of nay voluntary residential energy efficiency programs. Evidence is needed to guide the development of highly energy efficient, cost-effective, durable and buildable solutions that are well-integrated with current practices used for wall assemblies of Canadian housing.
Given the heightened interest of homebuilders to provide homes that met or exceeded Energy Star requirements, and their voiced concerns regarding “super-insulated” homes, the intent of this work was to demonstrate compliance of a set of highly-insulated wall assemblies as compared to a code compliant reference wall in respect to their anticipated thermal and hygrothermal performance when subjected to Canadian climate extremes. On the basis of providing useful information to building practitioners, the National Research Council Canada (NRC) undertook field monitoring and numerical modelling to investigate the risk of
condensation in wall assemblies having different combinations of increased thermal resistance (R-value) of insulation for selected insulation products.
EVALUATION OF THERMAL AND MOISTURE RESPONSE OF HIGHLY INSULATED WOOD-FRAME WALL ASSEMBLIES
REPORT A1-006035.01 2
To achieve higher wall insulation levels in wood-frame wall assemblies, it has been
commonplace to apply rigid, or semi-rigid, board insulation over the inside or outside of the framing. Alternatively, double wall or deep wall construction assemblies can be used to attain the desired level of insulation. However, concerns had been expressed in the building
community regarding the use of progressively higher levels of insulation in wall assemblies as a means of attaining greater energy savings. It was felt that the use of higher insulation levels would increase the risk of incurring moisture problems given the perceived effect that highly insulated walls have on the wetting and drying characteristics of walls.
To help address the development of such unintended consequences, a collaborative research project, with government and industry participation, was initiated to explore, develop, test and document the energy performance and moisture response of highly insulated residential wall systems. The information derived from the project will be used to guide the development of durable new wood frame wall assemblies.
1.2 Objectives
The intent of the project was to develop information on the moisture and thermal performance of progressively higher insulated wood-frame wall assemblies. The information is to be used to: (1) Support the evaluation of future code proposals regarding energy efficiency improvements to building envelope systems; (2) Support the development of knowledge, details and practices for advanced wall systems for voluntary residential energy efficiency programs; (3) Help the
housing industry meet near- and net-zero energy targets, and; (4) Promote the deployment of highly energy efficient wall details for new and retrofitted existing wood-frame construction. In essence, the primary outcome from this project is to facilitate the widespread adoption of high performance residential wood-frame wall systems (Energy Guide rating: EGH-83 and 86) that are practical, buildable, durable, energy efficient and affordable.
To achieve these objectives, the project focused on investigating the moisture and energy performance of thermally enhanced wood-frame walls with progressively higher levels of insulation from a base line (2010 National Building Code minimum (RSI 3.27 – 4.13) to new R-2000 performance levels (RSI 7.04 – 7.92). It permitted comparing the heat, air and moisture response of the advanced wall systems to the base line code-compliant wall and thereafter complete the necessary analysis to develop meaningful information outputs that could be used to address and thereby alleviate industry concerns regarding the unintended consequences of enhanced wall insulation systems on the moisture performance of the wall assemblies over time.
In collaboration with the Canadian Wood Council (CWC), NRC-Construction developed proposals for 3 wall assemblies to be tested in NRC-Construction’s Field Exposure of Walls (FEWF) test facility, shown in FIGURE 1, over a period of 8–months in a yearly cycle where the walls were exposed to outdoor conditions.
As it was of importance to ensure that the results of the research were meaningful in all regions of Canada, the analysis was extended through the use of simulation tools to representative cities in the Atlantic and Prairie regions of Canada, the lower coastal mainland of BC and in the North. Given that conducting experimental tests to determine the hygrothermal performance of different wall systems in different Canadian locations is time consuming and expensive, an advanced hygrothermal modeling tool was used to develop this part of the project. The
modeling tool (hygIRC-2D) was benchmarked against experimental data obtained from field test of the project. Once the benchmarking of the modeling tool was completed, is was then used to investigate the effect of different outdoor and indoor conditions, as may be found in the different regions of Canada, on the moisture and thermal performance of the wall assemblies; results from the numerical simulation part of the project can be found in the companion report [3]. In this report, results are provided of the monitoring of the hygrothermal response of a set of three highly insulated wall assemblies to local climate conditions of Ottawa and when subjected to forced exfiltration conditions.
Figure 1. NRC-Construction’s Field Exposure of Walls (FEWF) test facility,
EVALUATION OF THERMAL AND MOISTURE RESPONSE OF HIGHLY INSULATED WOOD-FRAME WALL ASSEMBLIES
REPORT A1-006035.01 4
2.0 Research Approach
2.1 Scope of Testing
The field monitoring of the three (3) different wall assemblies was undertaken in the NRC’s Field Exposure of Walls Facility (FEWF), located at the NRC campus in Ottawa. The research
approach was similar to that used in previous projects where there was interest in knowing the hygrothermal response of wall assemblies subjected to local climate conditions as described by Lacasse et al. [4], Armstrong et al. [11], Maref et al. [11, 13] and Saber et al. [5, 14].
Field monitoring of the test specimens was conducted from February 2016 to October 2016; this allowed an 8-month period over which test specimens were subjected to a broad range of weather conditions for each set of experiments.
2.2 Description of Wall Specimens
Test specimens
Two wall test specimens with size of 4 x 6 ft. (1220 x 1790 mm) consisted of 2x6-in.. (38 x 140 mm) wood-frame walls and another having a 2x10-in. (38 x 230 mm) wood-frame were installed side-by-side in the FEWF (Figure 2). The different material layers and the dimensions of the wall specimens are given in Figure 3 to Figure 5.
The common elements of three wall test specimens included vinyl siding attached to 0.75 in. thick furring strips (which created an air space) on the exterior side of the assemblies, and painted gypsum wallboard (GWB) on the interior of the assembly.
Wall 1 (W1 XPS) and Wall 3 (W3 OSB) used similar components throughout, resulting in identical thermal resistance, but the components were rearranged primarily to see the effect of using a variable permeance vapour retarder (sometimes called a “smart” vapour retarder). An OSB panel was used in Wall W3 as a “smart” vapour retarder; in W1 this same panel was used on the exterior of the assembly, and vapour barrier in that wall was a polyethylene sheet (6 mil). A continuous exterior insulation layer of wall W1 (XPS; Figure 3) was created by adding a 25 mm (1 in.) thick extruded polystyrene (XPS) panel onto the 11 mm (7/16 in.) thick oriented strand board (OSB), the OSB being overlaid with a polymer-based sheathing membrane. The OSB board was attached to the 38 x 140 mm (1.5 x 5.5 in.) wood-frame wall and friction-fit glass fibre batt insulation of R-24 was added to the interior wall cavity between the vertical studs. The interior side of wall W1 consisted of polyethylene air and vapour barrier (6 mil thick), and 12.7 mm (0.5 in.) thick interior drywall. The total nominal thermal resistance for W1 (XPS) was R29. Wall 3 (W3 OSB), deviated from standard construction by not having a polyethylene sheet as vapour barrier, but instead, an OSB panel; this arrangement of layers for W3 is given in Figure 5. Similar to that which was installed in W1, a 25 mm (1 in.) thick continuous layer of extruded polystyrene (XPS) was installed to the wood frame from exterior side. Glass-fibre batt insulation of R-24 was installed in the wood-frame cavity, and installed inboard of the stud cavity, was an 11 mm (7/16 in.) thick OSB (taped joints) as a “smart” vapour retarder. Interior
drywall 12.7 mm (0.5 in.) thick was installed as the interior finish as in all other wall assemblies. The total nominal thermal resistance for wall W3 was R29.
The level of insulation used in Wall 2 (W2 PH) was increased to levels typically used in Passive Haus (PH) design (Figure 4) and in which a much deeper cavity (9.25 in. + 3.5 in.) is required to accommodate R 43 batt insulation. The materials used for insulation were wood fibre batt placed between the 2x10-in. (38 x 230 mm) wood studs against a 25mm (1 in.) wood fibre exterior diffusion board; both products being novel to North America and imported from the UK. The secondary interior wood frame 2x4-in. (38 x 89 mm), was offset from the primary 2x10-in. frame to eliminate thermal bridging; the secondary frame was also filled with wood fiber batt insulation. As was used in wall W3, an 11 mm (7/16 in.) OSB was used as a smart vapour barrier in lieu of a polyethylene sheet, the sheet being placed between the two stud-walls. A 12.7mm (0.5 in) thick interior drywall formed the interior side. For wall W2 the wood fiber insulation provided a nominal R-value of R43.
The sequence of installation of the primary wall components forming the interior portion of the respective test specimens and inboard of the 2x6-in. (38 mm x 140 mm) wood framing is
illustrated in Figure 6 to Figure 9. In Figure 6 is shown the state of fabrication where the exterior sheathing panel (OSB) has been installed for wall specimen W1, followed by the glass fibre batt insulation and the polyethylene vapour barrier installed from the interior side. As evident in Figure 7, the sequence of installation of wall components is shown from left to right in the Figure. The left-most figure shows the wood-based diffusion board installed on the exterior side of the 2x10-in. wood frame; thereafter, wood fiber insulation in placed in the stud cavity; an OSB panel is installed as vapour barrier atop of which can be seen a 2x4-in. wall; in this interior wall is installed wood fiber insulation towards the interior.
The construction of specimen W3 is given in Figure 8 where XPS sheathing has bene installed to the wood frame from the exterior side; glass fibre batt insulation is installed in the stud cavities and; the interior side includes the OSB panel as smart vapor barrier to which is affixed the interior finish consisting of gypsum drywall panel.
The final sequence, provided in Figure 9, shows the installation of wood furring strips to which was affixed the exterior cladding.
Additional installation details for each of the test specimens can be found in Appendix 1 Test Specimen Fabrication and Installation details .
Figure 2. Schematic of three 2x6-in. (38 mm x 140 mm) wood-frame wall (residential) test specimens installed side-by-side in FEWF
Figure 3. Wall 1 (W1: XPS) - Horizontal cross-section through XPS wall assembly
Figure 4. Wall 2 (W2: PH) - Horizontal cross-section through Passive Haus wall assembly
Figure 5. Wall 3 (W3: OSB) - Horizontal cross-section through wall assembly with OSB as smart vapor barrier
48 48 48 174.5 W1 XPS W2 PH W3 OSB 15.25 15.25 70.5 Units: in • Vinyl siding
• 3 x 0.75 in. nominal vertical furring strip • 1 in. XPS rigid foam insulation (R5) • Sheathing membrane
• 11 mm OSB wood-sheathing
• 1.5 x 5.5 in. nominal wood stud cavity • R24 glass fiber batt insulation for 6 in. cavity • 6 mil poly air/vapour barrier
• 0.5 in. painted drywall
Total R-29
W1 XPS
• Vinyl siding
• 3 x 0.75 in. nominal vertical furring strip • Sheathing membrane
• 24mm Diffusion board
• 1.5 x 9.25 in. nominal wood stud cavity • R30 Wood fibre insulation for 10 in. cavity • 11 mm OSB wood-sheathing; joints taped • 1.5 x 3.5 in. studs (Service wall interior) • R13 Wood fibre insulation for 4 in. cavity • 0.5 in. painted drywall
Total R-43
W2 PH
• Vinyl siding
• 3 x 0.75 in. nominal vertical furring strip • 1 in. XPS rigid foam insulation (R5) • 1.5 x 5.5 in. nominal wood stud cavity • R24 glass fiber batt insulation for 6 in. cavity • 11 mm OSB wood-sheathing; joints taped • 0.5 in. painted drywall
Total R-29
Figure 6. Wall 1 (XPS) – (i) Stud wall wood frame with OSB, (ii) GF batt insulation in stud cavities, (iii) poly vapour barrier
Figure 7. Wall 2 (PH) - (i) Stud wall wood frame with diffusion board, (ii) wood fiber insulation in stud cavities, (iii) OSB smart
vapour retarder (iv) interior wood fiber insulation
Figure 8. W3 (OSB) – (i) Stud wall wood frame with external XPS
board, (ii) GF batt insulation in stud cavities, (iii) OSB smart vapour retarder
Figure 9. Installation of W1, W2, & W3 in FEWF showing (i) exterior layers under air cavity, furring strips & (ii) exterior
EVALUATION OF THERMAL AND MOISTURE RESPONSE OF HIGHLY INSULATED WOOD-FRAME WALL ASSEMBLIES
REPORT A1-006035.01 8
Vaisala Model WXT
Instrumentation
For the characterization of the hygrothermal response of the walls, the test specimens were instrumented with different sensors to permit determining the degree of heat transfer across the specimens, to establish values for surface temperature and local relative humidity as well as the presence of moisture accumulation and pressure differences across the different layers; the different sensors used in this study are listed in Table 1.
For each test specimen, an array of sensors was deployed in a grid at each layer of the assembly; an example of the array of sensors deployed within wall assembly of test specimen W1 is shown in Table 2, the broader set of sensors for all test specimens are provided in
Appendix 2
Test Specimen Sensor Installation Details).
A local weather monitoring device (Vaisala Model WXT 510) that included a rain gauge, sensors for air temperature, relative humidity, air pressure, wind speed and wind direction, was installed in close proximity to the wall specimens and provided information on hourly ambient exterior conditions. The combined package permitted determining the response of the respective wall assemblies to changing weather conditions over hourly, daily and seasonal periods.
Each of the three test specimens was isolated from each other by a vertical chase that provided effective control of heat, air and moisture flow (Figure 2) and as well provided room for running wires for instrumentation (Figure 9). The test specimens were also isolated from the
surrounding building envelope of the test house with effective heat, air and moisture control materials (e.g. thermal insulation and self-adhered airtight membranes were used), as well as flashings where warranted.
As a part of the test protocol all heat flux transducers (HFTs) used in the test specimens were calibrated according to ASTM C-1130 “Standard Practice for Calibrating Thin Heat Flux
Transducers” [6]; the uncertainty of the heat flux measurements was ± 5%. The locations of the HFTs in the respective test specimens are shown in Figure 2 to Figure 4.
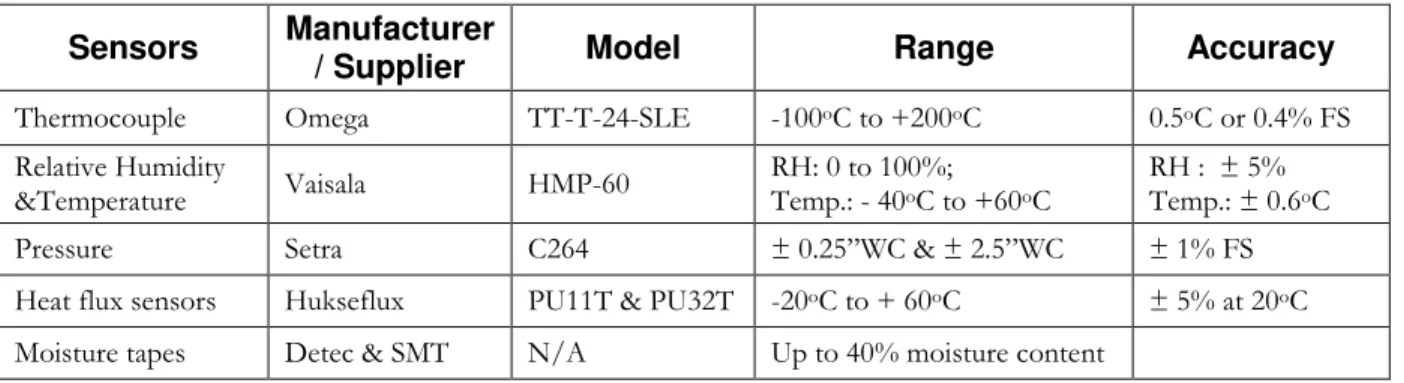
Table 1. List of sensors used to determine hygrothermal response of test specimens to changing local exterior and interior conditions
Sensors Manufacturer
/ Supplier Model Range Accuracy
Thermocouple Omega TT-T-24-SLE -100oC to +200oC 0.5oC or 0.4% FS
Relative Humidity &Temperature Vaisala HMP-60 RH: 0 to 100%; Temp.: - 40oC to +60oC RH : ± 5% Temp.: ± 0.6oC
Pressure Setra C264 ± 0.25”WC & ± 2.5”WC ± 1% FS Heat flux sensors Hukseflux PU11T & PU32T -20oC to + 60oC ± 5% at 20oC
Moisture tapes Detec & SMT N/A Up to 40% moisture content
2.3 Test Protocol
The test protocol was conceived to ensure that the wall assemblies were monitored to assess their vapour diffusion characteristics over an 8 month period, the initial period (A) covering the coldest period of the year.
The test protocol consisted of exposing the wall specimens to: • Exterior weather conditions prevalent at the FEWF test site; • A set of indoor controlled temperature and humidity conditions.
Indoor controlled conditions were based on that provided in ASHRAE standards [7] as these relate to indoor winter and summer conditions (21°C; 35% RH). To attain these conditions, an indoor climatic chamber was installed and sealed against the perimeter of the test opening, thereby allowing control of indoor conditions to which test specimens were subjected.
EVALUATION OF THERMAL AND MOISTURE RESPONSE OF HIGHLY INSULATED WOOD-FRAME WALL ASSEMBLIES
REPORT A1-006035.01 10
Test Periods ─ The monitoring program was set-up in four (4) periods (A, B, C and D) as provided in
Table 3. The length of periods varied, but in essence the initial period, Period A, was intended
as a period over which the fluctuations of heat flow, temperature, relative humidity and pressure differences within the assembly were monitored to gain an appreciation of the response of the wall to local weather conditions and when the interior conditions were nominally maintained at 21°C and 35% RH. Period B was meant to subject specimens to conditions where warm moist air (21°C; 55% RH) exfiltrated through intended deficiencies in the test specimens; exfiltration was induced by applying a 20 Pa pressure across the test specimens from the interior
enclosure. In this instance, there was interest in bringing about condensation on cold surfaces within the wall. The subsequent period, period C, provided a period over which the deficiencies remained in the assembly but no exfiltration pressure was applied to the enclosure and interior RH conditions were not controlled to a set RH level as they were for periods A and B. As such, the wall might recover from moisture deposition within the wall and in essence, “dry out”. In this way, the propensity for the wall to dry out following occurrences of moisture deposition within the wall provided a means to assess the robustness of the moisture management ability of the wall assembly. The final period (Period D), was again intended as a period over which to gain an understanding of the response of the wall to increasingly cooler periods following the summer months; the deficiencies were not present in this instance and neither was the RH in the interior enclosure maintained to a set level.
Period Interior conditions Exterior conditions
Temperature (°C) RH (%) Pressure (Pa) Deficiency (3mm slit) Deficiency (3mm slit) Temperature / RH
A (20 days) 21 35 0 Closed Open Ambient local
B (20 days) 21 55 20 Open Open Ambient local
C (190 days) 21 Variable / natural 0 Open Open Ambient local
Table 2 – Selected array of sensors deployed within wall assembly of test specimen W1
W1 – Location of thermocouples Designation Exterior temperature B1_TC_01 Exterior (stud) temperature B1_TC_02
XPS at top B1_TC_03
+
XPS at bottom B1_TC_04+
Sheathing membrane at top B1_TC_09 OSB interior surface top B1_TC_10 OSB interior surface bottom B1_TC_11 Drywall exterior top B1_TC_16 Interior surface temperature B1_TC_17
Interior surface (stud) temperature B1_TC_18
W1 – Location of RH sensors Designation Exterior B1_RHT_01
×
XPS at top B1_RHT_02 XPS at bottom B1_RHT_03
Sheathing membrane at top B1_RHT_04 Sheathing membrane at bottom B1_RHT_05
OSB interior surface top B1_RHT_06 OSB interior surface bottom B1_RHT_07 Drywall exterior top B1_RHT_08
Interior surface B1_RHT_09
W1 – Location of ΔP transducers Designation Exterior air pressure B1_DP_01 Mid stud air pressure B1_DP_02 Interior air pressure B1_DP_03
W1 – Location of thermocouples Designation Middle XPS at top B1_TC_05
+
Mid-height XPS – left cavity B1_TC_06 Mid-height XPS – right cavity B1_TC_07 Middle XPS at bottom B1_TC_08 Middle stud cavity at top B1_TC_12+
Mid-height stud– left cavity B1_TC_13 Mid-height stud– right cavity B1_TC_14
+
Middle stud cavity at bottom B1_TC_15+
Mid-height drywall – right cavity B1_TC_19
+
2X6XPS XPS 2X6 XPS 2X6 XPS 2X6 Drywall
EVALUATION OF THERMAL AND MOISTURE RESPONSE OF HIGHLY INSULATED WOOD-FRAME WALL ASSEMBLIES
REPORT A1-006035.01 12
Table 3. - Test protocol over monitoring period (2016)
Deficiencies in the wall assembly — Each test specimen included a deficiency through which air from the interior was meant to exfiltrate through the test specimens. The size and location of the respective deficiencies are shown in Figure 10. Pressure differences across the
assemblies, occurring either naturally or through forced air flow from the interior enclosure, induced the flow of air through the deficiencies as suggested in the schematic on the right of the photos in Figure 10. The location of the deficiencies at the interior of the test specimens and at the exterior sheathing panel, in principal, permitted a path for air to flow. The air leakage rate at several different enclosure pressures for each of these deficiencies was determined the results of which are given in Table 4. These are given as the air leakage rate (L/sec m2). Of
importance are the values of air leakage at the exfiltration mode when the deficiencies were present in the walls (Period B-“Deficiency state”).
Table 4 – Air leakage Q (L/sec m2) of test specimens at 75Pa
Wall Q (L/sec m2)
W1 6.59
W2 1.91
W3 6.66
2.4 Monitoring
Data was gathered continuously over an 8-month period and data analysis consisted of reviewing relevant sensors within the assembly and determining whether there was risk to the formation of condensation within the respective assemblies over the evaluation period.
Figure 10 – Deficiencies in wall test specimens showing location & size of deficiency in W1 (XPS)
Location of 3 X 368 mm deficiency in air & vapour barrier Location of 3 X 368 mm
deficiency in exterior sheathing
Period Interior conditions Exterior conditions
Temperature (°C) RH (%) Pressure (Pa) Deficiency (3mm slit) Deficiency (3mm slit) Temperature / RH
A (20 days) 21 35 0 Closed Open Ambient local
B (20 days) 21 55 20 Open Open Ambient local
C (190 days) 21 Variable / natural 0 Open Open Ambient local
On the basis of results obtained from monitoring the response of the respective wall assemblies to local climate conditions, the numerical hygrothermal model hygIRC-2D was benchmarked against selected experimental data. Thereafter, the model was used to conduct a parametric analysis to investigate the risk of condensation and mould growth in the respective wall
assemblies subjected to different climatic conditions for a select set of locations in Canada; this report is provided in [3], whereas, a description of the hygIRC-2D numerical hygrothermal simulation model and record of benchmarking exercises are available in [4].
3.0 Results
In this section, the hygrothermal response of wall test specimens to local climate conditions is described and those instances when moisture from condensation within the wall assembly was observed are discussed. The information acquired from the monitoring program is quite considerable and additional details of this can be found in
EVALUATION OF THERMAL AND MOISTURE RESPONSE OF HIGHLY INSULATED WOOD-FRAME WALL ASSEMBLIES
REPORT A1-006035.01 14
Appendix 3.
3.1 Response of Walls assemblies
The hygrothermal response of the test specimens over the monitoring period of 8 months is shown in Figure 11 for the respective test specimens: (i) W1-with XPS exterior insulation; (ii) W2-PH with wood fibre insulation, and; (iii) W3-with OSB as a smart vapour retarder. The location of the temperature and relative humidity sensors for which values are provided in the figure are shown in the diagram adjacent to the plots. In the plot, values recorded for the 3 periods of the test protocol (i.e. A, B and C) include the: (i) interior surface temperature (black lines); (ii) temperature (T / blue lines) and relative humidity (RH / red lines) of the sheathing panel (OSB for W1, wood fiber based diffusion board for W2, and XPS for W3) at mid-height of the wall, and (iii), the same T and RH in proximity to the 3 mm slit through which air could exfiltrate the wall.
The daily fluctuations in temperature of both the exterior surface of the thermal insulation as well as the interior dew point temperature are superimposed on the seasonal variations.
It can be generalized for all three types of walls tested, that the temperature at the interior surface of the respective sheathing panels gradually rise from below -10°C in February to upwards of 35°C, with maximum values attaining > 40°C in Period C (May -August). The relative humidity (RH) at the interior surface of the respective sheathing panels varies over the monitoring period between 30% and 60% RH, with significant increase in values up to 90% RH recorded during period B of the monitoring program (i.e. induced air exfiltration). The
corresponding temperatures at this same location were quite low, reaching -10°; as such, the propensity to the formation on condensation was high.
Period B of the monitoring program was intended to bring about occurrences of condensation within the wall assembly. This was the “deficiency state” when warm moist air from the interior was to exfiltrate to the exterior of the test specimens under forced flow conditions. Period B was completed over a three week period during the month of March (i.e. 7 to 28 March 2016). As is perhaps obvious from Figure 12 to Figure 14, significant moisture uptake occurred for all three wall assemblies during the deficiency state, period B, this period being defined by the slits being open to air movement. The response of the moisture detection strips to the presence of
moisture is marked with a decrease in electrical resistance which manifests itself by an increase in the value for conductivity. The increase in values for conductivity during period B denotes the presence of condensation.
Whereas after the indoor pressure was reduced to 0Pa at the beginning of the period C (28 March 2016), all wall assemblies started to dry out. At this stage both internal and external slits remained open. The dissipation of moisture from the same locations in Period C is evident from decreases in moisture content values over time; no moisture was detected towards the end of Period C. The moisture sensors in the W2 test specimen stopped recording the presence of moisture after approximately 30 days, at end of April 2016; and in assemblies W1 and W3 no moisture presence was recorded after a period of approximately 60 days, the end of May 2016. This implies that all moisture that was deposited in the walls over period B could gradually dissipate from the wall assemblies.
The propensity for the growth of mould inside the three test walls is shown in Figure 15. Here, values of mould index are given as a function of the monitoring period, in days. The mould index value is based on a mathematical relationship developed by Hukka and Viitanen [8], Viitanen and Ojanen [9], and Ojanen et al. [10] in which values for relative humidity (RH) and temperature (T) and information on the type of surface onto which mould may grow permits establishing the susceptibility to mould growth; values for mould index may range between 0 and 6, where 0 represents no mould growth and 6, very heavy (100% coverage) and tight growth. Its application to providing information on wall performance is more fully described in [4]; additional details regarding the mould index is provided in Appendix 4.
Given the relative humidity and temperatures on the sheathing surface were rising during the Period B, the propensity for mould growth towards the end of Period B increased significantly attaining maximum values of 6 in all three tested assemblies. With lower levels of RH over the Period C, the mould index values slowly abated. However it would be premature to exclude the risk of the occurrence of mould entirely at this stage of testing.
It is the opinion of authors that to determine the behavior of the wall specimens, it would be beneficial to continue data acquisition for a period over the winter of 2016/2017 and thereafter perform a visual inspection of each of the test specimens.
EVALUATION OF THERMAL AND MOISTURE RESPONSE OF HIGHLY INSULATED WOOD-FRAME WALL ASSEMBLIES
REPORT A1-006035.01 16
17 Feb 2016, 7 Mar 2016, 28 Mar 2016 1 Oct 2016
Figure 11– Response of respective wall assemblies (Temperature [T]; RH at exterior insulation
Figure 12 – W1 : Response of moisture detection strip to the presence of moisture
in the wall
Figure 13 – W2: Response of moisture
detection strip to the presence of moisture in the wall
Figure 14 – W3: Response of moisture
detection strip to the presence of moisture in the wall 0 5 10 15 20 25 30 35 Mo is tur e co ntent ( %) , Li qu id pr es en ce A B Period C 0 5 10 15 20 25 30 35 40 45 50 M o is tu re c o n ten t ( %), Li q u id presen ce A B Period C 0 A B Period C 5 10 15 20 25 30 35 40 45 50 M o is tu re c o n ten t ( %), Li q u id presen ce 17/2/16 7/3/16 28/3/16 1/10/2016 17/2/16 7/3/16 28/3/16 1/10/2016 17/2/16 7/3/16 28/3/16 1/10/2016
EVALUATION OF THERMAL AND MOISTURE RESPONSE OF HIGHLY INSULATED WOOD-FRAME WALL ASSEMBLIES
REPORT A1-006035.01 18
17/2/2016 7/3/2016 28/3/2016 1/10/2016
Figure 15 – Mold Index calculation results by Viitanen for monitoring
period (2016) above and below the deficiency slits on exterior side; (i) W1 (XPS); (ii) W2 (PH); (iii) W3 (OSB)
0 1 2 3 4 5 6 0 1000 2000 3000 4000 5000 M o u ld I n d e x ( -) Above Below
A
B
Period C
0 1 2 3 4 5 6 0 1000 2000 3000 4000 5000 M o u ld I n d e x ( -) Above BelowA
B
Period C
0 1 2 3 4 5 6 0 1000 2000 3000 4000 5000 Mo u ld I n d e x ( -) Above BelowA
B
Period C
4.0 Summary of Response of Walls assemblies
The hygrothermal response of 3 highly insulated wood frame wall assemblies was monitored over an 8 month period to determine whether any of these walls were susceptible to moisture problems that might accrue from inadvertent condensation in the wall assemblies. The walls were subjected to local climate conditions of Ottawa, ON. To determine the vulnerability of the wall test specimens and to assess their robustness to moisture ingress from air leakage, all assemblies were configured to include openings in the air barrier and exterior sheathing panel to permit the passage of air exfiltration from or infiltration to an interior conditioned enclosure. It is important to emphasise that such openings are not standard in wall assemblies and in usual in-service conditions, much lower levels of moisture would be expected to exfiltrate through a typical wall assembly. The summary of the hygrothermal responses of the respective test walls are given below; a definition of the mould index is provided in Appendix 4.
Response of W1 (XPS)
Given that the exterior OSB sheathing panel is located towards the exterior of the wall assembly it is evidently exposed to cold temperatures in winter; as such, the OSB sheathing panel
together with the wood studs are the most susceptible components of the assembly. The detection of moisture by sensors (Figure 12 top) together with high values calculated for the mould index (Figure 15 top) permits one to assume that in instances where air exfiltration is permitted to occur across the assembly there is a higher risk to the formation of condensation and in turn, a risk to premature deterioration. The presence of an air cavity behind the vinyl cladding enabled the assembly over a period of 5 months to gradually dry out whilst the value of the mould index diminished. It should be noted that the degree of air exfiltration that was
permitted was one that was imposed on the wall assembly by forcing air through purposely made deficiencies. This is not a situation that would normally occur in-service; no condensation issues would arise for this particular wall assembly provided it was properly constructed using accepted practice to ensure control of air and water vapour transfer across the wall.
Response of W2 (PH)
The rate of moisture dissipation (Figure 13) and degree of reduction in value for the mould index (Figure 15 center) over time are considerably greater (approximately two-fold decrease) than that of wall W1; hence this assembly if properly constructed, is quite robust as compared to wall W1 in respect to managing moisture deposition with the wall assembly.
Response of W3 (OSB)
The layer of OSB used as a smart vapour retarder in the assembly of wall W3 allows for higher RH fluctuations on interior side of the XPS board; the overall performance of this assembly is similar to that of wall W1, given it contains identical components (glass fiber thermal insulation, external XPS board, dry wall) with the exception of a 6 mil polyethylene vapour barrier. During the deficiency period condensation of moisture was observed at the location of the slits and high values for mould index we likewise reported; following the deficiency period mould index values declined over a period of 2 months (Figure 14) and after 5 months the mould risk index (Figure 15 bottom) also diminished. No condensation issues would arise for this particular wall
assembly provided it was properly constructed using accepted practice to ensure control of air and water vapour transfer across the wall.
EVALUATION OF THERMAL AND MOISTURE RESPONSE OF HIGHLY INSULATED WOOD-FRAME WALL ASSEMBLIES
REPORT A1-006035.01 20
Final commentary
Results from this study show that in instances where openings for air leakage exist, there is a considerable risk to condensation in wall assemblies. The risk to the formation of mould (Viitanen mould index value = 6) on the interior surface of the sheathing panels of all tested walls is significant in instances where forced air exfiltration was imposed on the wall test specimen during cold periods. However, these openings were introduced to induce
condensation in the wall and to determine the ability of the wall assemblies to “dry out”, i.e. dissipate any accumulated moisture within the wall. It was shown that all walls tested had the ability to dissipate moisture from within the wall in a 1-2 month period; this is a positive
observation. Under normal in-service conditions in which the vapour barrier is not assumed to be breached, none of these walls would be at risk to the formation of condensation, nor mould.
5.0 References
1. Canadian Housing Statistics – Residential Building Activity Construction Expenditures and Building Permits – 2013; 2014 Canada Mortgage and Housing Corporation (Product # 64685); 12 pgs. 2. Energy Efficiency Trends in Canada - 1990 to 2013; Office of Energy Efficiency; Report
M141-1E-PDF; Natural Resources Canada, Ottawa, ON; 51 pgs
3. Bartko, M., Lacasse, M. A. and Moore, T.V. (2016), “Evaluation of Thermal and Moisture Response of Highly Insulated Wood Frame Wall Assemblies – Part II Parametric Numerical Simulation Evaluation for Risk of Condensation”; CLIENT Report: A1-006035.2; NRC Construction, 23 December 2016; National Research Council of Canada, Ottawa, 23 pgs
4. Lacasse, M. A., H. H. Saber, W. Maref, G. Ganapathy and M. Nicholls, “Evaluation of Thermal and Moisture Response of Highly Insulated Wood-Frame Wall Assemblies – Part 1: Experimental trials in the Field Exposure of Walls test Facility, Phase 1 and Phase 2”, Report No. A1-000444.5; NRC-Construction, National Research Council of Canada, Ottawa, Canada; 8 January 2016.
5. Saber, H. H. and Ganapathy, G., “Evaluation of Thermal and Moisture Response of Highly Insulated Wood-Frame Wall Assemblies ― Phase 1; Part II: Numerical Modelling”; Report No. A1-000444.4; NRC-Construction, National Research Council of Canada, Ottawa, Canada; 12 January, 2016. 6. ASTM Designation: C 1130-07, “Standard Practice for Calibrating Thin Heat Flux Transducers”,
Annual Book of ASTM Standards; Construction, vol. 04.06, Thermal Insulation; Building & Environment Acoustic, pp. 577-584, 2009.
7. ASHRAE. 2009. 2009 ASHRAE Handbook –Fundamentals (SI), Chapter 26, Atlanta: American Society of Heating, Refrigerating, and Air-Conditioning Engineers Inc.
8. Hukka, A., and Viitanen, H.A., "A mathematical model of mould growth on wooden material, Wood Science and Technology", vol. 33 (6), pp 475-485, 1999.
9. Viitanen, H.A., and Ojanen, T., "Improved model to predict mould growth in building materials" Proc. Thermal Performance of Ext. Envelopes of Whole Buildings X, 8 p., 2007.
10. Ojanen, T., Viitanen, H.A., Peuhkuri, R, Lähdesmäki, K., Vinha, J., and Salminen, K., "Mould Growth Modeling of Building Structures Using Sensitivity Classes of Materials", 11th Intl. Conf. on Thermal Performance of the Exterior Envelopes of Whole Buildings XI (Clearwater, USA), 10 p., 2010. 11. Armstrong, M., Saber, H.H., Maref, W., Rousseau, M.Z., Ganapathy, G., and Swinton, M.C., “Field
Energy Performance of an Insulating Concrete Form (ICF) Wall”, 13th CCBST conference - Winnipeg 2011; 13th Canadian Conf. on Building Science & Technology, Winnipeg, MB; May 10 – 13, 2011. 12. Maref, W., Armstrong, M. M., Rousseau, M.Z., Thivierge, C., Nicholls, M., Ganapathy, G. and Lei, W.,
“Field Hygrothermal Performance of retrofitted Wood-Frame Wall Assemblies in Cold Climate”, 13th Canadian Conf. on Bldg. Sci. & Technology - Winnipeg, Canada, 2011.
13. Maref, W., Rousseau, M.Z., Armstrong, M.M., Lee, W., Leroux, M., and Nicholls, M., Evaluating the Effects of Two Energy Retrofit Strategies for Housing on the Wetting and Drying Potential of Wall Assemblies: Summary Report for Year 2007-08 Phase of the Study, Report RR-315, pp. 1-118, NRC Institute for Research in Construction, 2011.
14. Saber, H.H., and Maref, W., “Risk of Condensation and Mould Growth in Wood-Frame Wall Systems with Different Exterior Insulations”, BEST Building Enclosure Science & Technology Conference (BEST4); April 12-15, 2015, Kansas City, Missouri, USA, 19 p.
15. Saber, H.H., Maref, W., Gnanamurugan, G., and Nicholls, M., “Energy Retrofit Using VIPs: - an Alternative Solution for Enhancing the Thermal Performance of Wood-Frame Walls”, Journal of Building Physics, vol. 39(1), pp. 35-68, 2015.
EVALUATION OF THERMAL AND MOISTURE RESPONSE OF HIGHLY INSULATED WOOD-FRAME WALL ASSEMBLIES
REPORT A1-006035.01 22
Appendix 1
Test Specimen Fabrication and Installation details
W1
W3
W2
EVALUATION OF THERMAL AND MOISTURE RESPONSE OF HIGHLY INSULATED WOOD-FRAME WALL ASSEMBLIES
REPORT A1-006035.01 24
Appendix 2
Test Specimen Sensor Installation Details
Test specimens - Location of temperature thermocouples (TC)
W1 – Location of thermocouple (T)
W2 – Location of thermocouple (T)
W1 – Location of thermocouple (T) Designation
W2 – Location of thermocouple (T) Designation
W3 – Location of thermocouple (T) Designation
2X6XPS XPS 2X6 XPS 2X6 XPS 2X6 Drywall 2X10 2X4 2X4 2X10 2X6 XPS XPS Drywall XPS 2X6 XPS 2X6 Drywall
EVALUATION OF THERMAL AND MOISTURE RESPONSE OF HIGHLY INSULATED WOOD-FRAME WALL ASSEMBLIES
REPORT A1-006035.01 26
Test specimens - Location of relative humidity sensors (RH)
W1 – Location of RH sensors Designation
W2 – Location of RH sensors Designation
Test specimens - Location of Pressure transducers
W1 – Location of ΔP transducers
W2 – Location of ΔP transducers
EVALUATION OF THERMAL AND MOISTURE RESPONSE OF HIGHLY INSULATED WOOD-FRAME WALL ASSEMBLIES
REPORT A1-006035.01 28
Test specimens - Location of moisture and liquid sensing tapes
W1 – Location of DETEC moisture sensing tapes in stud cavity
RH-6 TC-10
2.0
6.0
View from interior of specimen. All dimensions in inches.
LAYER 5 - Interior Face of OSB
DETEC_104 (Bl.wt-Bl pair)
DETEC_104 (Or.wt-Or pair)
DETEC_105 (Gn.wt-Gn pair) DETEC_105 (Br.wt-Br pair) DETEC_106 (Gn.wt-Gn pair) DETEC_106 (Br.wt-Br pair) DETEC_105 (Bl.wt-Bl pair) DETEC_105 (Gn.wt-Gn pair) DETEC_104 (Br.wt-Bl pair) DETEC_104 (Gn.wt-Gn pair) DETEC_105 (Or.wt-Or pair)
W2 – Location of DETEC moisture sensing tapes in stud cavity
RH-14 TC-27
2.0
6.0
View from interior of specimen. All dimensions in inches.
LAYER 4 - Interior Face of diffusion board
DETEC_104 (Bl.wt-Bl pair)
DETEC_104 (Or.wt-Or pair)
DETEC_105 (Gn.wt-Gn pair) DETEC_105 (Br.wt-Br pair) DETEC_106 (Gn.wt-Gn pair) DETEC_106 (Br.wt-Br pair) DETEC_105 (Bl.wt-Bl pair) DETEC_105 (Gn.wt-Gn pair) DETEC_104 (Br.wt-Bl pair) DETEC_104 (Gn.wt-Gn pair) DETEC_105 (Or.wt-Or pair)
EVALUATION OF THERMAL AND MOISTURE RESPONSE OF HIGHLY INSULATED WOOD-FRAME WALL ASSEMBLIES
REPORT A1-006035.01 30
W3 – Location of DETEC moisture sensing tapes in stud cavity
RH-24 TC-49
2.0
6.0
View from interior of specimen. All dimensions in inches.
LAYER 3 - Interior Face of XPS insulation
DETEC_104 (Bl.wt-Bl pair)
DETEC_104 (Or.wt-Or pair)
DETEC_105 (Gn.wt-Gn pair) DETEC_105 (Br.wt-Br pair) DETEC_106 (Gn.wt-Gn pair) DETEC_106 (Br.wt-Br pair) DETEC_105 (Bl.wt-Bl pair) DETEC_105 (Gn.wt-Gn pair) DETEC_104 (Br.wt-Bl pair) DETEC_104 (Gn.wt-Gn pair) DETEC_105 (Or.wt-Or pair)
EVALUATION OF THERMAL AND MOISTURE RESPONSE OF HIGHLY INSULATED WOOD-FRAME WALL ASSEMBLIES
REPORT A1-006035.01 32
Appendix 3
Pressure variations over monitoring period
Temperature variations over monitoring period
EVALUATION OF THERMAL AND MOISTURE RESPONSE OF HIGHLY INSULATED WOOD-FRAME WALL ASSEMBLIES
REPORT A1-006035.01 34
Appendix 4
Mould Index and Hygrothermal Performance
Results were expressed using the mould index (M) criteria developed by Hukka and Viitanen [8], Viitanen and Ojanen [9], and Ojanen et al. [10]. The most recent mould model by Ojanen et al. [10] was used in this study to determine the mould index of different materials of the wall assemblies. In that model [10], the sensitivity of different construction materials for mould growth was classified in four sensitivity classes, namely, very sensitive, sensitive, medium resistant and resistant (see Table ). Table provides the assumed correspondence of sensitivity class for materials located within the wall assembly of this study. More specifically, the
sensitivity class for the top and bottom plates, OSB and foam was considered “Sensitive”, whereas the sensitivity class of the materials for cavity insulation (fiber-based), drywall and membranes was considered “Medium Resistant”.
Table 5. Description of Mould Index (M) levels [8, 9, 10]
M
Mould Index (M) Description of Growth Rate
0
No growth1
Small amounts of mould on surface (microscope), initial stages of local growth2
Several local mould growth colonies on surface (microscope)3
Visual findings of mould on surface, < 10% coverage, or < 50% coverage of mould (microscope)4
Visual findings of mould on surface, 10%(microscope) –50% coverage, or > 50% coverage of mould5
Plenty of growth on surface, > 50% coverage (visual)6
Heavy and tight growth, coverage about 100%Table 6. Mould growth sensitivity classes and some corresponding materials [10]
Sensitivity Class Materials RHmin (%)
*
Very Sensitive Pine sapwood 80
Sensitive Glued wooden boards, spruce 80
Medium Resistant Concrete, aerated and cellular concrete, glass wool, polyester wool 85
Resistant PUR with polished surface 85
* Minimum relative humidity needed for mould growth
Table 7. Mould growth sensitivity classes for materials of wall assemblies listed in Table 2
Sensitivity Class Material Layers of Wall Assemblies RHmin (%)
*
Very Sensitive Wood fibre insulation 80
Sensitive Top plate, bottom plate, OSB, foam 80
Medium Resistant Fiberglass insulation, gypsum, membranes 85
Resistant 85


![Figure 11 – Response of respective wall assemblies (Temperature [T]; RH at exterior insulation surface and dew point T) over monitoring period (2016); (i) W1 (XPS); (ii) W2 (PH); (iii) W3 (OSB)](https://thumb-eu.123doks.com/thumbv2/123doknet/14076011.463043/29.918.112.800.127.934/figure-response-respective-assemblies-temperature-exterior-insulation-monitoring.webp)