https://doi.org/10.4224/20374466
READ THESE TERMS AND CONDITIONS CAREFULLY BEFORE USING THIS WEBSITE.
https://nrc-publications.canada.ca/eng/copyright
Vous avez des questions? Nous pouvons vous aider. Pour communiquer directement avec un auteur, consultez la
première page de la revue dans laquelle son article a été publié afin de trouver ses coordonnées. Si vous n’arrivez pas à les repérer, communiquez avec nous à [email protected].
Questions? Contact the NRC Publications Archive team at
[email protected]. If you wish to email the authors directly, please see the first page of the publication for their contact information.
NRC Publications Archive
Archives des publications du CNRC
For the publisher’s version, please access the DOI link below./ Pour consulter la version de l’éditeur, utilisez le lien DOI ci-dessous.
Access and use of this website and the material on it are subject to the Terms and Conditions set forth at
IAQ solutions and technologies: review and selection for protocol
development
Sultan, Z. M.; Magee, R. J.; Nilsson, G.
https://publications-cnrc.canada.ca/fra/droits
L’accès à ce site Web et l’utilisation de son contenu sont assujettis aux conditions présentées dans le site LISEZ CES CONDITIONS ATTENTIVEMENT AVANT D’UTILISER CE SITE WEB.
NRC Publications Record / Notice d'Archives des publications de CNRC:
https://nrc-publications.canada.ca/eng/view/object/?id=62f6a2d4-f1c8-47eb-9780-b184957e8805
https://publications-cnrc.canada.ca/fra/voir/objet/?id=62f6a2d4-f1c8-47eb-9780-b184957e8805
I AQ Solut ions a nd T e c hnologie s: Re vie w a nd Se le c t ion for Prot oc ol
De ve lopm e nt
N R C C - 5 4 4 9 5
S u l t a n , Z . M . ; M a g e e , R . J . ; N i l s s o n , G .
M a r c h 2 0 1 1
http://www.nrc-cnrc.gc.ca/ircThe material in this document is covered by the provisions of the Copyright Act, by Canadian laws, policies, regulations and international agreements. Such provisions serve to identify the information source and, in specific instances, to prohibit reproduction of materials without written permission. For more information visit http://laws.justice.gc.ca/en/showtdm/cs/C-42
Les renseignements dans ce document sont protégés par la Loi sur le droit d'auteur, par les lois, les politiques et les règlements du Canada et des accords internationaux. Ces dispositions permettent d'identifier la source de l'information et, dans certains cas, d'interdire la copie de documents sans permission écrite. Pour obtenir de plus amples renseignements : http://lois.justice.gc.ca/fr/showtdm/cs/C-42
3 |
P a g e
Table of Contents
1
INTRODUCTION
6
2
MATERIALS AND METHODS
8
2.1
Technology review: Literature and Environmental Scan
8
2.2
Description of IAQ Solutions and Technologies
8
2.3
Criteria for selection of IAQ Solutions Technologies
8
2.3.1 Merit and Feasibility Criteria
8
2.3.2 IAQ Solution Technology (IAQST) Evaluation Matrix
13
3
RESULTS
14
3.1
Characterization of IAQ solutions and technologies
14
3.1.1 Source removal/reduction IAQSTs
16
3.1.2 Exposure reduction IAQSTs
16
3.1.3 IAQ solutions, their technologies and target pollutants.
17
3.2
IAQST Performance Indices
20
3.2.1 Efficiencies of IAQSTs
21
3.2.2 Effectiveness of IAQSTs
24
3.3
Health Benefits of IAQSTs
26
3.3.1 Professional Cleaning
27
3.3.2 Portable air cleaners, filtration systems and HRVs
28
3.4
Health Benefits of IAQSTs
29
3.5
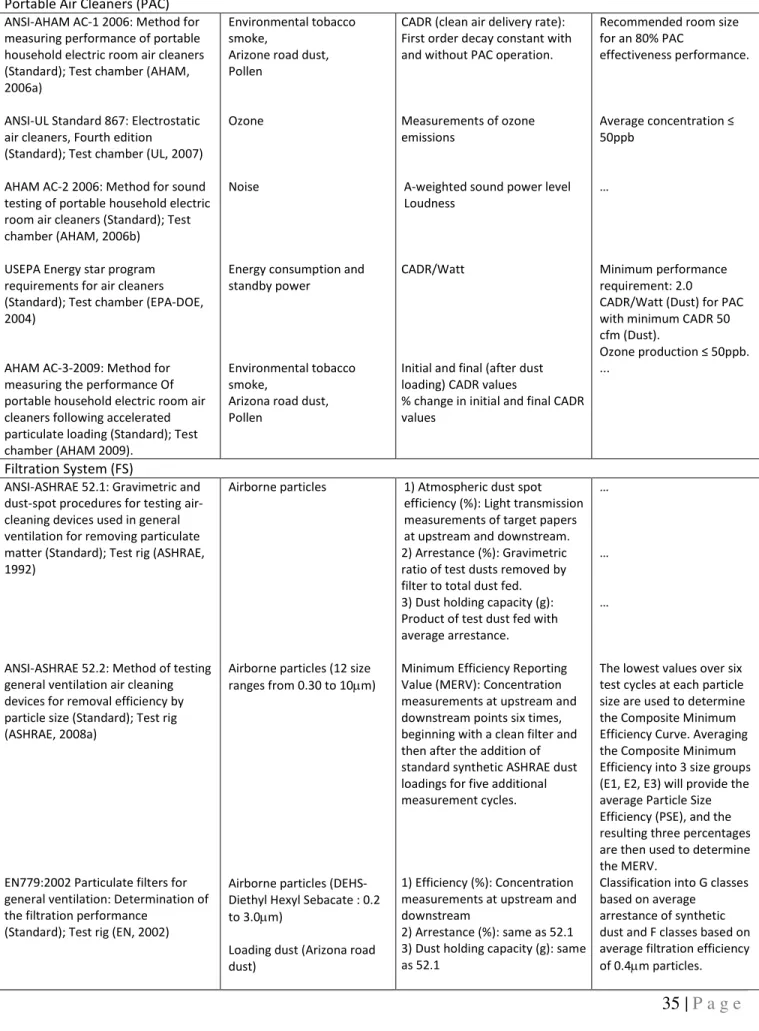
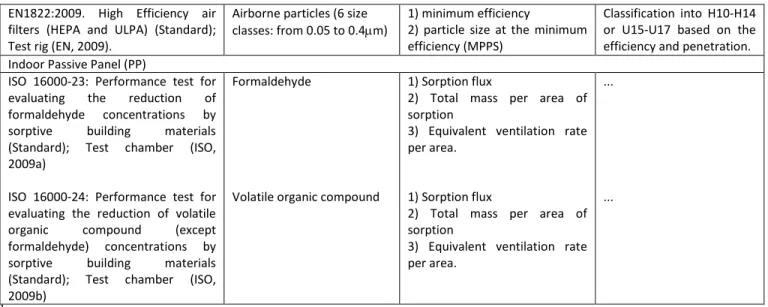
Protocols applicable to IAQSTs
33
3.5.1 Performance evaluation protocols
33
3.5.2 Safety, health and environmental related protocols
37
3.6
IAQSTs Ranking and Selection for Protocol Development
39
3.6.1 Summary of IAQST Technology Review, Environmental Scan and Evaluation Matrix
39
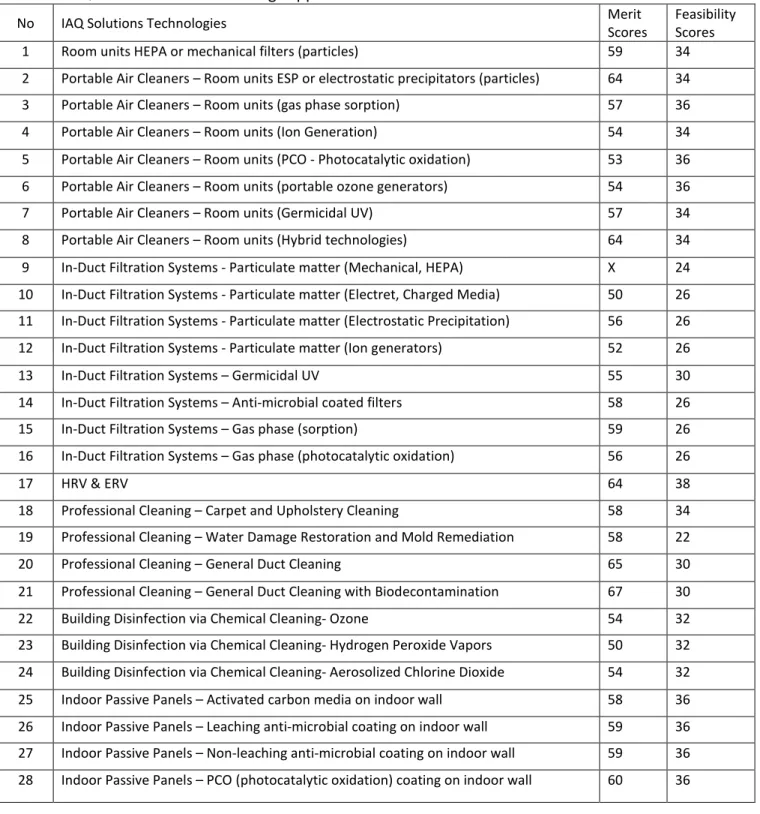
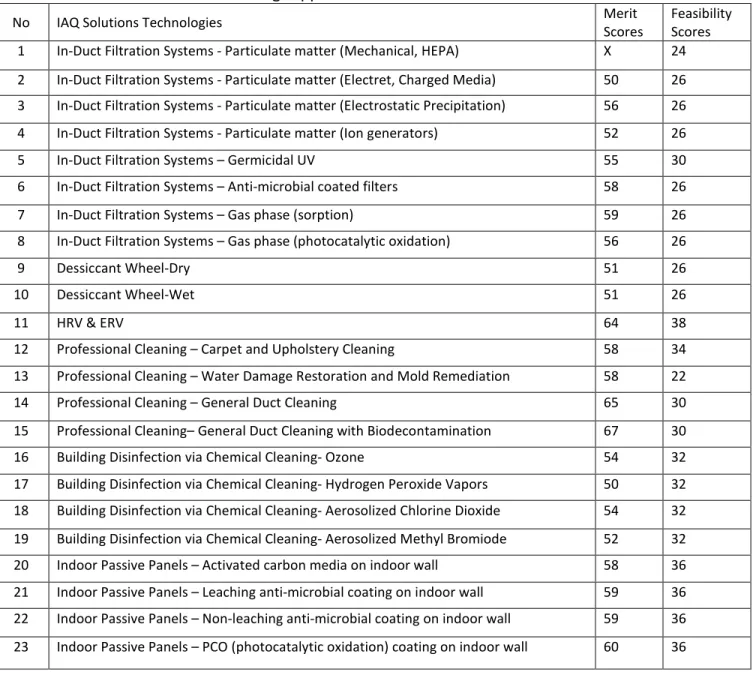
3.6.2 IAQST Ranking and Selection
40
4
SUMMARY AND CONCLUSION
42
5
REFERENCES
43
APPENDIX A
56
A.1
Residential Applications
56
A.1.1
Portable Air Cleaners – Room units HEPA or mechanical filters (particles)
56
A.1.2
Portable Air Cleaners – Room units ESP or electrostatic precipitators (particles)
58
A.1.3
Portable Air Cleaners – Room units (Gas Phase Sorption)
60
A.1.4
Portable Air Cleaners – Room units (Ion Generation)
62
A.1.5
Portable Air Cleaners – Room units (PCO - Photocatalytic oxidation)
64
A.1.6
Portable Air Cleaners – Room units (Portable Ozone Generators)
66
4 |
P a g e
A.1.8
Portable Air Cleaners – Room units (Hybrid technologies)
70
A.1.9
In-Duct Filtration Systems - Particulate matter (Mechanical, HEPA)
72
A.1.10
In-Duct Filtration Systems - Particulate matter (Electret, charged media)
74
A.1.11
In-Duct Filtration Systems - Particulate matter (Electrostatic precipitation)
76
A.1.12
In-Duct Filtration Systems - Particulate matter (Ion generators)
78
A.1.13
In-Duct Filtration Systems – Germicidal UV
80
A.1.14
In-Duct Filtration Systems – Anti-microbial coated filters
82
A.1.15
In-Duct Filtration Systems – Gas phase (sorption)
84
A.1.16
In-Duct Filtration Systems – Gas phase (photocatalytic oxidation)
86
A.1.17
HRV & ERV
88
A.1.18
Professional Cleaning – Carpet and Upholstery Cleaning
90
A.1.19
Professional Cleaning – Water Damage Restoration and Mold Remediation
92
A.1.20
Professional Cleaning – General Duct Cleaning
94
A.1.21
Professional Cleaning – General Duct Cleaning with Biodecontamination
96
A.1.22
Building Disinfection via Chemical Cleaning- Ozone
98
A.1.23
Building Disinfection via Chemical Cleaning- Hydrogen Peroxide Vapors
100
A.1.24
Building Disinfection via Chemical Cleaning - Aerosolized Chlorine Dioxide
102
A.1.25
Indoor Passive Panels – Activated carbon media on indoor wall
104
A.1.26
Indoor Passive Panels – Leaching anti-microbial coating on indoor wall
106
A.1.27
Indoor Passive Panels – Non-leaching anti-microbial coating on indoor wall
108
A.1.28
Indoor Passive Panels – PCO (photocatalytic oxidation) coating on indoor wall
110
A.2
Commercial Applications
112
A.2.1
In-Duct Filtration Systems - Particulate matter (Mechanical, HEPA)
112
A.2.2
In-Duct Filtration Systems - Particulate matter (Electret, Charged media)
114
A.2.3
In-Duct Filtration Systems - Particulate matter (Electrostatic precipitation)
116
A.2.4
In-Duct Filtration Systems - Particulate matter (Ion generators)
118
A.2.5
In-Duct Filtration Systems – Germicidal UV
120
A.2.6
In-Duct Filtration Systems – Anti-microbial coated filters
122
A.2.7
In-Duct Filtration Systems – Gas phase (sorption)
124
A.2.8
In-Duct Filtration Systems – Gas phase (photocatalytic oxidation)
126
A.2.9
Desiccant Wheel-Dry
128
A.2.10
Desiccant Wheel-Wet
130
A.2.11
HRV & ERV
132
A.2.12
Professional Cleaning – Carpet and Upholstery Cleaning
134
A.2.13
Professional Cleaning – Water Damage Restoration and Mold Remediation
136
A.2.14
Professional Cleaning – General Duct Cleaning
138
A.2.15
Professional Cleaning – General Duct Cleaning with Biodecontamination
140
A.2.16
Building Disinfection via Chemical Cleaning- Ozone
142
A.2.17
Building Disinfection via Chemical Cleaning- Hydrogen Peroxide Vapors
144
A.2.18
Building Disinfection via Chemical Cleaning- Aerosolized Chlorine Dioxide
146
A.2.19
Building Disinfection via Chemical Cleaning- Aerosolized Methyl Bromiode
148
A.2.20
Indoor Passive Panels – Activated carbon media on indoor wall
150
A.2.21
Indoor Passive Panels – Leaching anti-microbial coating on indoor wall
152
A.2.22
Indoor Passive Panels – Non-leaching anti-microbial coating on indoor wall
154
5 |
P a g e
A.2.23
Indoor Passive Panels – PCO (photocatalytic oxidation) coating on indoor wall
156
APPENDIX B
158
IAQ SOLUTIONS AND TECHNOLOGIES BACKGROUND INFORMATION
158
IAQ Solutions
158
Portable Air Cleaners – Room units (PAC)
158
Filtration System – In Duct Units (FS)
159
Professional Cleaning (PCL)
160
Air-to-Air Exchanger
163
Building Disinfection (BD)
166
Indoor Passive Panel (PP)
166
IAQ Technologies
167
Mechanical Filters
167
Electronic Air Cleaners
168
Gas-Phase Sorption
170
PCO - Photocatalytic Oxidation
171
Germicidal UV
171
Anti-Microbial Coating
172
6 |
P a g e
1 Introduction
The NRC-IRC Indoor Air Research and Development Initiative, part of the Federal Government’s Clean
Air Agenda, takes a multi-faceted approach to improving indoor air quality (IAQ) in the built
construction sector. One important subtask involves the development of detailed protocols for
assessing the impact of technologies/ devices that claim to enhance IAQ. This research task will
review, identify, develop and validate effective protocols that might be adopted by industry to
improve “indoor air quality solutions and technologies” (IAQSTs), and how they are installed, used and
maintained in buildings. These IAQSTs may range in scope from residential heat recovery ventilator
(HRV) systems, to single room particle filtration units to Heating, Ventilating and Air-Conditioning
(HVAC)-mounted air modification systems in commercial buildings. Although, IAQSTs have been
advocated and adopted for the purpose of controlling indoor air pollutants in commercial and
residential buildings, little research has been conducted on current status and performance. The
purpose of this document is to: 1) provide the current state-of-the-art knowledge on available IAQSTs;
2) aid the Technical Advisory Committee (TAC) members to review current/developing technologies;
and 3) select candidates deemed most promising or most in need of detailed evaluation protocol
development. It is envisaged that three to four IAQSTs (depending on technology complexity) will be
selected in consultation with TAC for full test protocol development.
Much of what we do in a day takes place indoors. In buildings, the quality of the air we breathe
depends on various processes that influence indoor pollutant exposures. These processes include
ventilation, pollutants source strengths control and other removal mechanisms such as deposition and
air cleaning. Dilution of indoor pollutants by ventilation is the most widely applied strategy to reduce
exposure and provide good indoor air quality. However, this approach may not be the most energy
efficient strategy and applicable in some situations (e.g. mold infestation). Alternative to ventilation,
various indoor air quality solutions and technologies (IAQSTs) is receiving increased consideration to
control indoor air pollutants in buildings.
Many IAQSTs are strongly marketed by manufacturers and are increasingly used by consumers. From
the manufacturers’ perspectives, many IAQSTs are promoted as being capable of removing indoor
pollutants thus improving the overall IAQ. Unsubstantiated claims were also made with regards to
performance, health benefits and energy savings of IAQSTs (Consumers Union, 1985; EPA, 1997).
From the consumer’s perspectives, IAQSTs are used primarily for their perceived health, economical
and environmental benefits and also to conform to IAQ regulatory guidelines (Consumers Union,
1985; EPA, 1997; NEMI, 2002; Rideal, 2005). Anecdotal evidence has shown that the sale and
marketing of IAQSTs has increased considerably. A recent survey in the United States revealed that
30% of households own at least one type of air cleaning device (AHAM, 2002) while about 10% of
California residents own air cleaners that deliberately release ozone (Waring et al, 2008). Industry
survey reported that mold remediation has become an important topic among building owners and
insurance providers and that duct cleaning services amount to about US$1.4 billion (CAD 1.35 billion)
worth of market value (NEMI 2002). The filter industry noted the world’s market size was estimated
to be over US$20 billion and forecasted a conservative estimate for the overall industry growth to
exceed 34% from the year 2004 through to 2009 (Rideal, 2005). In the large growing consumer market
7 |
P a g e
of China, air purification market size has increased from 8 to 21.5 million RMB (CAD 1.2 to 3.2 million)
from 2003 to 2007 (Zhang et al, 2008).
A wide variety of IAQSTs are available. To relate the processes of the myriad IAQSTs in controlling
indoor air pollutants, a mass-balanced equation representing three important parameters is used:
( )
(
)
(
)
+
+
−
−
−
=
C
o
s
r
r
Q
V
i
C
o
C
i
C
o
Q
E
dt
V
i
C
d
η
η
β
Equation 1
where, C
oand C
iare the indoor and outdoor pollutant concentrations (µg/m
3), Q
oand Q
rare the
building outdoor and recirculation flow rates (m
3/h), η
sand η
rare removal efficiencies of filter at the
mechanical supply and recirculation flow, β (h
−1) is the first-order loss-rate coefficient via deposition
onto room surfaces, E (µg/h) is the emission source strength operating and V is the interior volume
(m
3) and t is the time. Broadly, equation 1 states that the rate of indoor pollutant accumulation is
equal to the rate of indoor source emission minus the rate of dilution by ventilation minus the rate of
reduction by filtration and deposition.
Now, energy demands of ventilation constitute a significant proportion of total building energy
consumption (EIA, 2003). Further, it is anticipated that energy demands would increase in the coming
years thus making dilution by ventilation an expensive resort. Concomitantly, more sustainable
technologies that reduce pollutants by filtration and deposition are currently being sought and gaining
widespread acceptance (Sanchez et al. 2008). In keeping with the above, IAQ solutions and
technologies associated with efforts to reduce indoor pollutant accumulation, increase filtration and
deposition rates are expected to have a strategic and important role in the future.
The challenges of the building sustainability, energy efficiency and the public’s request for better,
healthier and more productive indoor environments are huge. Despite the potential advantages of
IAQSTs, they are often marketed and used without first being tested if they are effective. Questions
are being asked about benefits and risks
1associated with their use. IAQSTs must not compromise
occupants’ health and cause negative environmental impacts. To meet the needs of consumers and to
support industry requirements for targeted technology development, the findings of both technology
review and protocol development efforts will be used to provide a foundation for creation of
scientifically sound technology labeling systems. In this document, a broad overview of IAQST
applications, target contaminants and their health relevance, performance indices and effectiveness,
market demand, product labeling potential, manufacturer’s claims, associated standards, guidelines
and assessment protocols and knowledge gaps is summarized and tabulated. The IAQSTs are
categorized in terms of applications into residential and commercial buildings. Since numerous IAQSTs
are available, ranking criteria based on merit and feasibility scores and the use of an IAQ solution
technology evaluation matrix for assessment protocol development is proposed. Based on the scores,
all the IAQSTs will be ranked to reflect their level of importance. The top three or four IAQSTs will then
be recommended for full test protocol development.
1
Risks associated with IAQSTs include increased energy with use, high noise levels and creation of environmental footprint and hazardous products over their service lifetime.
8 |
P a g e
2 Materials and Methods
2.1 Technology review: Literature and Environmental Scan
This study considers IAQSTs that are currently in existence and commercially available. The definition
of an IAQ solution here is any activity, device and material that is used and/or performed to improve
indoor air quality which does not rely on ventilation and/or ventilation strategy. Thus, ventilation
systems such as displacement, personalised and other novel strategies of ventilation are not
considered here. Based on these criteria, we focused on portable air cleaners, in-duct filtration
devices, heating/energy recovery ventilation systems, ventilation system duct cleaning and building
disinfection limited in scope to the commercial and residential building applications. Scientific
literature, standards and guidelines, published in journals and conference proceedings were searched
through a number of electronic databases including Airbase from the Air Infiltration and Ventilation
Center, Applied Science and Technology Index; Canadian Mortgage and Housing Corporation (CMHC)
database; Current Contents; Inspec; Medline; PubMed; and Sciencedirect. A search using the key
terms air cleaner, air-purification, filtration, heating or energy recovery ventilation systems, duct
cleaning, mold remediation, water damage remediation, cleaning and building disinfection was also
performed. A similar search was done manually for American Society of Heating, Refrigerating, and
Air-Conditioning Engineers (ASHRAE) IAQ Conference Proceedings; ASHRAE Journal; ASHRAE
Transactions publications. To determine benefits claimed by manufacturers including those suitable
for commercial applications, an environmental scan of websites and brochures of different IAQSTs
were performed.
2.2 Description of IAQ Solutions and Technologies
Although it is beyond the scope of this document to provide detailed descriptions of “solutions” and
“technologies” employed by individual IAQSTs, a brief description of the basic principles will be
provided. The performance indices used to evaluate how well they operate in the field or laboratory
will be described. The health benefits or risk associated with their use as well as environmental
impacts will also be discussed.
2.3 Criteria for selection of IAQ Solutions Technologies
2.3.1 Merit and Feasibility Criteria
We based the IAQSTs selection for protocol development and test evaluation using several criteria.
These criteria are not purely made up of scientific or health considerations but also incorporate
feasibility considerations to include NRC-IRC logistical capabilities and project timelines. Each criterion
is grouped into either merit or feasibility criteria.
For merit criteria, the IAQSTs are first evaluated in terms of their capabilities to remove health
relevant target contaminants. Target contaminant of the IAQST must have a realistic impact on indoor
9 |
P a g e
environment which may also include an unintentional negative impact. For example, some IAQSTs
operations result in ozone formation or creation of harmful secondary products which include irritants
or allergens. The selection criteria for IAQSTs do not provide scores to devices/technologies based on
published or claimed health benefit of IAQSTs. Rather, the approach used here is meant to give scores
to health relevant pollutants that are targeted by IAQSTs, placing particular importance on those
associated with mortality over morbidity outcomes and more morbidity outcomes over lesser ones.
These pollutant levels associations with health outcomes must be well documented in medical
literature.
The IAQSTs are next evaluated in terms of the measurable effect of the target contaminant using
currently available analytical methodologies, or techniques that may reasonably be developed within
time frame of current project. To ensure that the protocol development is not a repetition, IAQSTs are
given various scores in terms of whether current assessment protocols are non-existent, lacking or
incomplete. IAQSTs where protocols are available and widely accepted will not be evaluated.
The next criterion by which the IAQSTs are evaluated is product availability. Since the final deliverable
of this task is the assessment of an existing product via the new protocol, hence the target “product”
must be clearly defined and suitable for assessment. Here, high scores will be given to commercially
available IAQST products that are widely used.
The IAQSTs are also evaluated in terms of whether the proposed assessment protocol for a particular
IAQST is able to provide data suitable for future product labeling. Product labeling could incorporate
labels dealing with health needs, green products, and energy efficiency or at least fulfill building
regulation requirements.
Lastly, we look at whether the development of the proposed protocol may possibly lead to research
partnership opportunities. High scores were given to IAQSTs that can potentially involve support
and/or collaboration with stakeholders in terms of information sharing and future development of
new or enhanced technologies.
For feasibility criteria, the IAQSTs were first evaluated to determine if it is possible to develop
assessment protocols within project timeline. An IAQST was not selected at all if it could not be
evaluated in the allotted time.
The next criterion to be evaluated is the assessment of cost to complete evaluation of the protocol
vis-à-vis project budget. This criterion relates to the cost in terms of human resources, facility
upgrades, instrumentation, operations and maintenance, and target technology purchasing and
installation.
Lastly, the IAQSTs are evaluated to determine if NRC-IRC’s infrastructure and analytical capabilities are
suitable to perform the protocol evaluation within the project budget and timeline.
Using the above criteria, scores ranging from 1 (lowest) to 10 (highest) were given based on different
criteria descriptions.
10 |
P a g e
Merit Scores
•
Health relevance of targeted contaminants:
Description Score
Target contaminants are associated with premature mortality outcomes: 10
Target contaminants are associated with carcinogenic outcomes: 9
Target contaminants are associated with mutagenic outcomes: 8
Target contaminants are associated with toxic outcomes: 7
Morbidity outcomes in more than 5 target contaminants: 6
Morbidity outcomes for target contaminants ≥3 but ≤ 5: 5
Morbidity outcomes for target contaminants > 1 but ≤ 3: 3
Morbidity outcomes for target contaminants = 1: 2
No Morbidity outcomes for target contaminants: 1
•
Measurable (positive) impact:
Description Score
Methods available for all target contaminants: 10
Methods not available for health relevant contaminant – new methods can be developed: 8 Methods not available for negative impact contaminant – new methods can be developed: 6 Methods not available for health relevant & negative impact contaminant – new ones can be developed: 4 Methods not available for health relevant contaminant – new methods difficult to be developed: 3 Methods not available for negative impact contaminant - new methods difficult to be developed: 2 Methods not available for health relevant and negative impact contaminant: 1
•
Potential (negative) impact:
Description Score
Device generates ozone and potential secondary by-products via chemical reactions: 10
Device generates pollutant causing known health effects: 9
Device creates environment causing known health effects: 8
Use of device is associated with large amount of energy consumption: 7
Use of device is associated with generation of greenhouse gas: 6
Device creates environment causing adverse thermal comfort: 4
Use of device is associated with poor acoustical environment: 3
Device creates environment/condition reducing perceived air quality: 2
11 |
P a g e
•
Protocol development need:
Description Score
Protocols non-existent and can be developed: 10
Protocols incomplete and enhancement can be performed: 8
Protocols non-existent and new protocol development difficult: 6
Protocols incomplete and enhancement difficult: 4
Protocols exist and widely accepted: X2
•
Product availability:
Description Score
Commercially available and widely used in both residential and commercial building stock: 10 Commercially available and widely used in either residential or commercial building stock: 8 Commercially available, has potential to be widely used and strongly marketed by vendors: 6 New technology/service which is commercially available, has potential to be widely
used and strongly marketed by vendors: 4
New technology/service which is commercially available: 2
•
Labeling support:
Description Score
Labels for all types (A, B, C and D): 10
Labels for types A, B and D: 8
Labels for types A, C and D: 6
Labels for types B or C and D: 4
Labels for type D: 2
Different label types include:
A) ‘Best’ IAQ for special needs (e.g. for asthmatic children – provide healthy environment );
B) Green product (e.g. energy saving potential from excessive ventilation designed to dilute indoor contaminants); C) Energy saving potential only; and
D) Fulfill minimum requirements of building regulations.
•
Research partnership opportunities:
Description Score
Ready partner [F, $, E]: 10
Ready partner [F] or [S] or [$] or [E]: 8
Potential partner [F] and [E] and/or [$]: 6
Potential partner [F] and/or [E]: 4
2
X : a veto score in which IAQST receiving this score will not be considered for evaluation for protocol development and test evaluation. For technologies which are deemed to be potentially dangerous, these should be evaluated if budget or time permits.
12 |
P a g e
Potential partner [S] and/or [E]: 2
Partner provides – expertise (information sharing) [E], facilities and/or equipment [F], monetary funding [$], support [S]
Feasibility Scores
•
Time:
Description Score
Report and protocol can be completed on schedule: 10
Protocol can be completed on schedule: 8
Report and protocol may be completed on schedule: 6
Protocol may be completed on schedule: 4
Report and protocol difficult to be completed on schedule: X
•
Cost:
Description Score
No partners NRC has to carry 100% of the cost that is within project budget: 10 Confirmed in kind contributions to cover some of the cost that will exceed project budget: 6 No partners - NRC has to carry 100% of the cost but the cost may exceed project budget: 2 No partners - NRC has to carry 100% of the cost but the cost is higher than project budget: X
•
Infrastructure capabilities:
Description Score
All infrastructures is available at NRC-IRC: 10
Most infrastructures is available at NRC-IRC - only minor upgrades needed: 8
Some infrastructures available at NRC-IRC - major upgrades needed: 6
Only bare infrastructures available at NRC-IRC - major upgrades needed: 4
No infrastructure available - major set-up needed: 2
•
Analytical capabilities:
Description Score
All analytical needs are available in NRC-IRC: 10
Most analytical needs are available in NRC-IRC - minor upgrades needed: 8
Some analytical needs are available in NRC-IRC - major upgrades needed: 6
Bare analytical capabilities - major upgrades needed: 4
13 |
P a g e
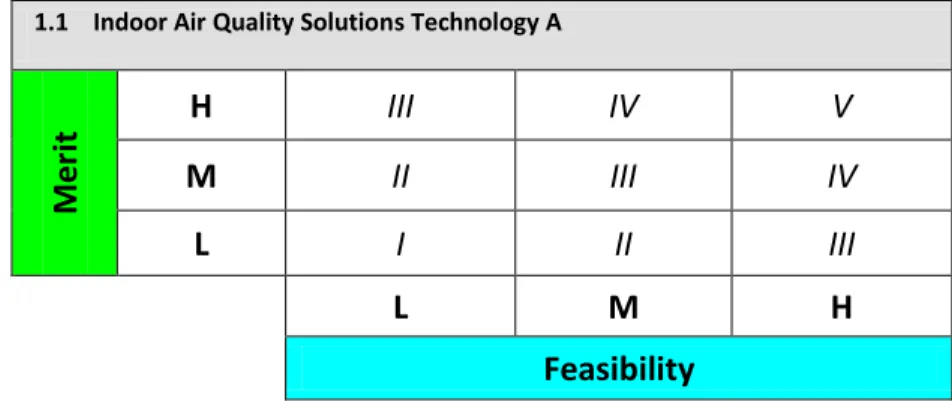
2.3.2 IAQ Solution Technology (IAQST) Evaluation Matrix
An IAQST Evaluation Matrix developed in NRC-IRC is used to select three or four IAQSTs for protocol
development and test evaluation. The IAQST Evaluation Matrix is a simple table where the criteria
scores are grouped. The evaluation matrix provides a quick view of the likelihood and the priority with
which each of the IAQST will be selected. A sample IAQST evaluation matrix is given in Figure 1.
1.1 Indoor Air Quality Solutions Technology A
Me
ri
t
H
III
IV
V
M
II
III
IV
L
I
II
III
L
M
H
Feasibility
Figure 1
IAQST Evaluation Matrix of an Indoor Air Quality Solutions Technology A.
The total merit scores are considered as follows: Low (L) – Less than 50; Medium (M) – 50 to 62; and
High (H) – Over 62. The total feasibility scores are considered as follows: Low (L) – Less than 2;
Medium (M) – 26 to 32; and High (H) – Over 32.
Once the total scores have been placed in the evaluation matrix, the status of the IAQST priority
becomes clear. Each IAQST shown in the table can be categorized as follows.
Strong Pass: IAQSTs that fall in the cell marked with ‘V’ are the most critical and must be. The project
team should develop and evaluate the IAQST protocol.
Pass but less priority then V: Denoted with ‘IV’ in the evaluation matrix, also calls for protocol
development and test evaluation. However, priority is lower than that of “strong pass”.
Medium Pass: IAQSTs that fall in one of the cells marked as ‘III’ should be considered for protocol
development and test evaluation, but only if more technologies are required.
Poor Pass: IAQSTs that fall in the cells marked with ‘II’ are of lower importance and do not have
enough merit and feasibility scores for protocol development and test evaluation.
14 |
P a g e
3 Results
3.1 Characterization of IAQ solutions and technologies
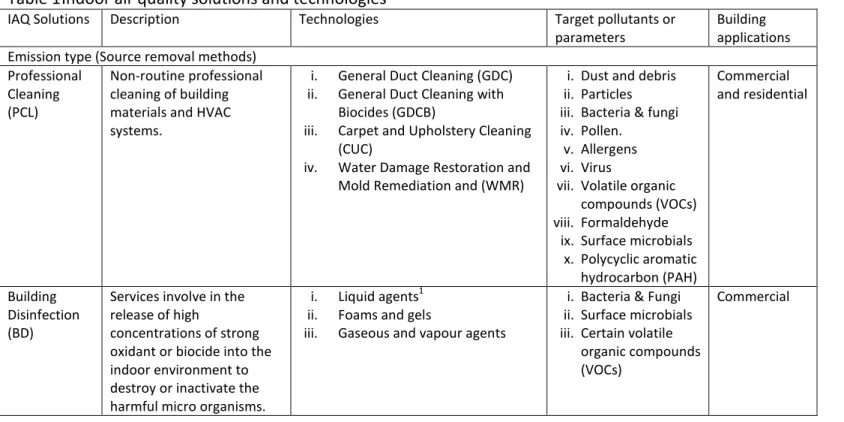
Table 1 presents the various IAQ solutions, their technologies, target pollutants/parameters and
building applications. Based on equation 1, IAQSTs can be classified into 2 categories: 1) source
removal/reduction; and 2) exposure reduction. For source removal/reduction IAQSTs, the solution
involves the reduction or removal of indoor pollutant accumulation sources. On the other hand,
exposure reduction IAQSTs deal with controlling the indoor pollutants concentration using filtration
and deposition principles. Based on the different types of IAQSTs found, IAQ solutions can be grouped
into portable air cleaners, filtration systems, exchangers, professional cleaning, passive panels and
building disinfection.
Table 1 Indoor air quality solutions and technologies
IAQ Solutions Description Technologies Target pollutants or
parameters
Building applications Emission type (Source removal methods)
Professional Cleaning (PCL)
Non-routine professional cleaning of building materials and HVAC systems.
i. General Duct Cleaning (GDC) ii. General Duct Cleaning with
Biocides (GDCB)
iii. Carpet and Upholstery Cleaning (CUC)
iv. Water Damage Restoration and Mold Remediation and (WMR)
i. Dust and debris ii. Particles iii. Bacteria & fungi iv. Pollen.
v. Allergens vi. Virus
vii. Volatile organic compounds (VOCs) viii. Formaldehyde
ix. Surface microbials x. Polycyclic aromatic hydrocarbon (PAH) Commercial and residential Building Disinfection (BD)
Services involve in the release of high
concentrations of strong oxidant or biocide into the indoor environment to destroy or inactivate the harmful micro organisms.
i. Liquid agents1 ii. Foams and gels
iii. Gaseous and vapour agents
i. Bacteria & Fungi ii. Surface microbials iii. Certain volatile
organic compounds (VOCs)
15 |
P a g e
Table 1 continued
IAQ Solutions Description Technologies Target pollutants or
parameters
Building applications Air purification and Deposition type (Exposure reduction methods)
Portable Air Cleaners (PAC)
Devices intended to remove gaseous and particulate pollutants in a single room or specific areas.
i. Mechanical Filtration (MF) ii. Electronic Cleaners
a. Electrostatic precipitators (ESP) b. Ionic Generators (IG)
c. Ion source with charged media filter (ISM) iii. Gas Phase Filtration (GP)
a. Physical adsorption b. Chemisorption
iv. Photocatalytic oxidation (PCO) v. Ultraviolet Germicidal
Irradiation (UVGI) vi. Ozone generator (OG) vii. Nanotechnology (Nano)
i. Particles ii. Bacteria & fungi iii. Pollen.
iv. Allergens v. Virus
vi. Volatile organic compounds (VOCs) vii. Formaldehyde viii. Ozone Residential Filtration System (FS)
In-duct air cleaning systems used in forced-air heating, ventilation, and air conditioning systems (HVAC) to remove gaseous and particulate pollutants at a building scale.
i. Mechanical Filtration (MF) ii. Anti-microbial coated filters
(AMCF)
iii. Electronic Cleaners (EC)
a. Electrostatic precipitators (ESP) b. Ionic Generators (IG)
c. Ion source with charged media filter (ISM) d. Plasmacluster ion (PCI) iv. Gas Phase Filtration (GP)
a. Physical adsorption b. Chemisorption
v. Photocatalytic oxidation (PCO) vi. Ultraviolet Germicidal
Irradiation (UVGI) vii. Biofiltration (BF) viii. Nanotechnology (Nano)
i. Particles ii. Bacteria & fungi iii. Pollen.
iv. Allergens v. Virus
vi. Volatile organic compounds (VOCs) vii. Formaldehyde viii. Ozone Commercial and residential Exchangers (EX)
Devices used to facilitate counter-flow heat/enthalpy exchange between the inbound and outbound airflow within a ventilation system. These could be air-to-air heat/energy recovery ventilators (HRV/ERV) or rotating desiccant wheels (RDW).
i. Heat/Energy Transfer Modules (HTM/ETM) together with a. Mechanical Filtration (MF) b. Electronic Cleaners c. Gas Phase Filtration (GP) d. Ultraviolet Germicidal
Irradiation (UVGI) ii. Dry Desiccant wheel (DDW) iii. Wet Desiccant wheel (WDW)
Filtration system in residential exchangers
i. Same as PAC and FS except viii. Desiccant wheel i. Volatile organic compounds (VOCs) ii. Formaldehyde RDW- Commercial HRV/ERV-Residential Passive Panel (PP)
Passive panels (PP) are coatings applied to an indoor wall with large deposition velocities of contaminants.
i. Gas phase physical adsorption ii. Anti-microbial coating (AMC)
a. Leaching based b. Non-leaching based
iii. Photocatalytic oxidation (PCO) iv. Nanotechnology coating (Nano)
i. Same as PAC and FS
ii. Surface microbials
Commercial
1
16 |
P a g e
3.1.1 Source removal/reduction IAQSTs
Professional Cleaning (PCL) include non-routine cleaning of indoor surfaces such as carpets,
upholsteries and various components of the ventilation systems, and water damage restoration and
mold remediation. Included in the services are the use of various cleaning agents, fragrances and
biocides. Soiling of carpet and upholsteries over time can accumulate dusts within the fabrics where
their subsequent resuspension can increase exposure of particulate matter. Presumably, this may
cause adverse health effects especially among sensitive occupants. It has been reported that people
living in indoor environments with greater fleece characteristics have higher risks of asthma, allergies
and sick building syndrome (Wargocki et al., 1999; Jaakkola et al., 2006). Professional water damage
restoration and mold remediation has been the response by concerns of dampness and/or mold
exposures in indoor environments. Many international scientific organizations have conducted
reviews on the links between increased prevalence and incidence of asthma, allergies, respiratory
symptoms and infections among building occupants with presence of dampness or mold on the
interior surface (Bornehag et al. 2001). Duct cleaning refers to the cleaning of various heating and
cooling system components of ventilation air systems. The main objectives are to improve the general
indoor air quality via the removal of accumulated dusts and mold growths on the interior surfaces of
the ventilation systems, prevent clogging of ducts and improve the efficiency of the ventilation system
(Brosseau et al., 2000a; 2000b). It can be divided into general duct cleaning (dirt/dust) or general duct
cleaning with biocides (dirt/dust and biocontamination). Biocides used include, but not limited to,
essential oils, polyacrylate copolymer containing zinc oxide and borates, acrylic coating containing
decabromodiphenyl oxide and antimony trioxide, acrylic primer containing a phosphated quaternary
amine complex, glutaraldehyde and even ozone (EPA, 1997; 2006; Foarde & Menetrez, 2002; Godish,
2003; Sondossi, 2004).
Building disinfection (BD) services conventionally involves the release of high concentrations of strong
chemical agents or biocide into the indoor environment to destroy or inactivate the harmful
microorganisms such as legionella or even biological warfare agent (EPA, 2005; Hubbard, 2006). When
a disinfectant is vaporized or applied to an indoor environment, it comes into contact with all of the
materials indoor, as well as with the biological pollutants it is meant to destroy. The technologies can
be classified into liquids, foams and gels, and gases and vapors. Typical gaseous agents for building
disinfection include, among others, ozone, chlorine dioxide, methyl bromide and hydrogen peroxide,
glutaraldehyde-based, phenol-based, iodophore-based, quaternary ammonium-based and
alcohol/quaternary-based products (Godish, 2003; Sondossi, 2004; Hubbard, 2006). Surface type
application (liquids, foams and gels) oxidants include hypochlorite, aqueous hydrogen peroxide and
chlorine dioxide and enzymatic foams (EPA, 2005).
3.1.2 Exposure reduction IAQSTs
Portable air cleaning (PAC) devices are room units intended to remove gaseous and particulate
pollutants in a single room or specific areas. Most PACs contain a fan to mechanically draw in the
airborne pollutants into a filtration device (using one or more of air cleaning technologies described
below) and circulate the cleaned air out into the room. Generally PAC are designed and marketed to
17 |
P a g e
reduce concentrations of particulate matter (PM) such as tobacco smoke, pollen, dust mites, animal
allergens, and diesel exhaust particles (Batterman et al., 2005). The widespread use and effectiveness
of PAC in ameliorating asthma and allergies has been the topic of various discussions (see section
3.3.2).
In-duct air cleaning systems are filtration systems (FS) designed and used solely as a physically
integrated part of a forced-air heating, ventilation, and air conditioning systems (HVAC) in residential
and commercial buildings to remove pollutants at a building scale. Since indoor air pollutant removal
takes place within the HVAC system and not within the room, FS are ineffective for pollutants that
deposit on the indoor surfaces. Depending on the types of technologies used for FS, airborne
pollutant removal includes particulates such as dust, pollen, mold, and bacteria as well as gas phase
contaminants such as VOCs, ozone, nitrogen dioxide and formaldehyde.
Passive panels (PP) are coatings applied to an indoor wall to reduce indoor chemical and biological
exposures. By replacing surfaces that have a pollutant low deposition velocity with ones that have a
larger deposition velocity, lower indoor air concentrations of pollutants can be achieved (Kunkel et al.,
2010; Sekine and Nishimura, 2001). Some passive panels rely on special coatings that not only
inactivate biological pollutants but prevent their growth and proliferation on the surfaces (Dubosc et
al., 2001). Others rely on the activation and emission of reactive chemicals into the air to remove
airborne biological and chemical pollutants (Taoda et al. 2006). Modifications of building materials
such as composite sheets and wall papers with photocatalysts (Ichiura et al., 2003; Taoda et al. 2006)
showed that these materials have the potential to be placed on walls and ceilings for the removal of
various indoor pollutants. Indoor passive panels have the potential to improve indoor air quality
without much reliance on energy.
Exchangers are devices used in a ventilation system to facilitate counter-flow heat/enthalpy exchange
between the inbound and outbound airflow. These could be air-to-air heat/energy exchangers or
rotating desiccant wheels. A heat recovery ventilator (HRV) is designed to increase ventilation by
introducing outdoor air while at same time use the heated or cooled air being exhausted to warm or
cool the incoming air. An energy recovery ventilator (ERV) works by exchanging moisture between the
two air streams. Filtration devices incorporated in HRV/ERV have the ability to remove gaseous and
particulate pollutants while the reduction of relative humidity levels from HRV/ERV use have the
potential to create unfavorable microenvironments that enable dust mite proliferation and mold
growth (Wright, 2007). HRV/ERV use has been associated with the threat of pollutant transfer from
the exhaust to the supply air. While HRV/ERV is conventionally used in residential buildings, in many
commercial buildings, the counter-flow heat exchange process involves the use of rotating wheel. For
enthalpy exchange using rotating wheels, it is accomplished through the use of wet or dry desiccants,
transferring moisture through the process of adsorption. This process is predominately driven by the
difference in the partial pressure of vapor within the opposing air-streams.
3.1.3 IAQ solutions, their technologies and target pollutants.
As summarized in Table 2, different technologies can address indoor pollutants concentrations by
various physical, chemical and biological mechanisms. Typically, source removal/reduction
18 |
P a g e
technologies involve mechanical removal and/or strong chemicals agents. Concentration reduction
technologies include mechanical filters, electronic cleaners, gas phase filtration, photocatalytic
oxidation, ultraviolet germicidal irradiation, anti-microbial coatings, heat and energy transfer modules
in conjunction with filtration devices and desiccant wheels. Among these technologies, mechanical
filters, electronic cleaners, gas phase filtration, photocatalytic oxidation, ultraviolet germicidal
irradiation are used in portable air cleaners, filtration system and heat or energy recovery ventilators
(Table 1). In addition, two technologies (gas phase physical adsorption and photocatalytic oxidation)
are applied in all concentration reduction IAQ solutions.
Table 2 shows that the common indoor pollutant that all technologies seem to directly or indirectly
address is airborne particles. This includes inanimate as well as animate particles such as bacteria,
fungi, virus and allergens. For source removal/reduction technologies, the aim is to reduce airborne
particles concentrations via removal of deposited dusts or microorganisms on building surface
materials which can be resuspended when agitated (Corsi et al., 2008). Concentration reduction
technologies remove particles as they come in contact or approach the devices via various physical
and chemical mechanisms. In HRV/ERV devices, incorporated filtration devices have the ability to
remove airborne pollutants (Marsik and Johnson, 2008). It is also noted that most technologies target
indoor gaseous pollutants such as volatile organic compounds (VOCs) and formaldehyde. These
include biofiltration, physical and chemical adsorption, photocatalytic oxidation and agents used in
professional cleaning. It has been reported that VOCs concentrations can be adsorbed on desiccant
wheels behaving the same way a gas phase adsorption filter does (Fang et al., 2008). Nanotechnology
is a new emerging technology that entails the application of reactive nanomaterials for
transformation and detoxification of pollutants (EPA, 2007).
19 |
P a g e
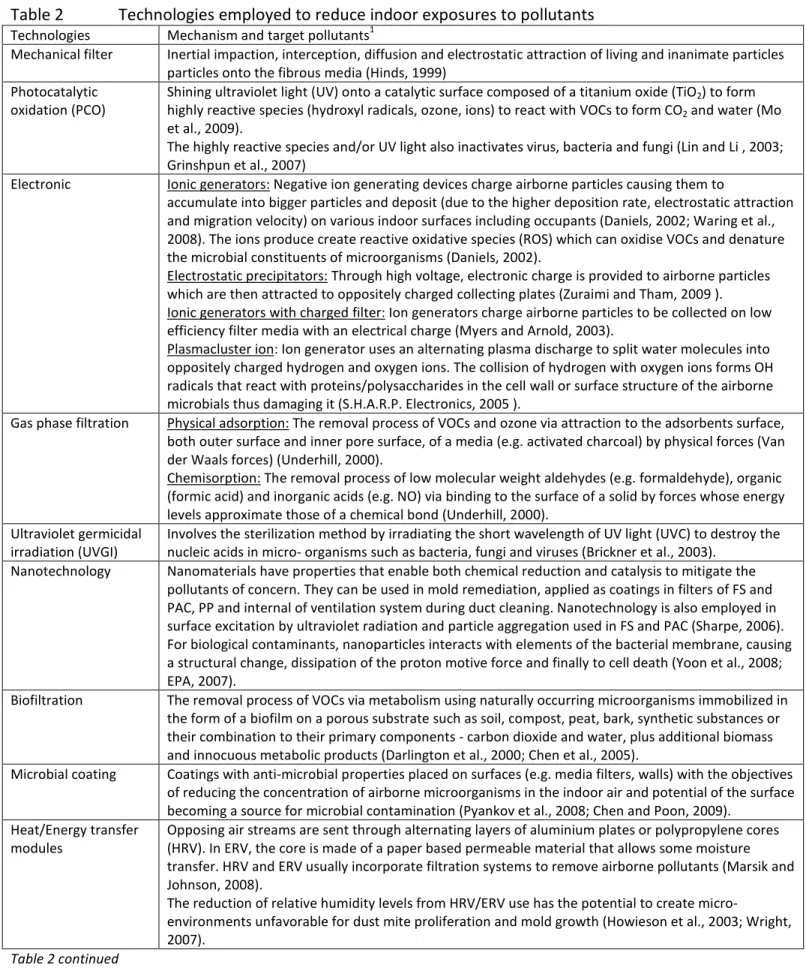
Table 2
Technologies employed to reduce indoor exposures to pollutants
Technologies Mechanism and target pollutants1Mechanical filter Inertial impaction, interception, diffusion and electrostatic attraction of living and inanimate particles particles onto the fibrous media (Hinds, 1999)
Photocatalytic oxidation (PCO)
Shining ultraviolet light (UV) onto a catalytic surface composed of a titanium oxide (TiO2) to form
highly reactive species (hydroxyl radicals, ozone, ions) to react with VOCs to form CO2 and water (Mo
et al., 2009).
The highly reactive species and/or UV light also inactivates virus, bacteria and fungi (Lin and Li , 2003; Grinshpun et al., 2007)
Electronic Ionic generators: Negative ion generating devices charge airborne particles causing them to
accumulate into bigger particles and deposit (due to the higher deposition rate, electrostatic attraction and migration velocity) on various indoor surfaces including occupants (Daniels, 2002; Waring et al., 2008). The ions produce create reactive oxidative species (ROS) which can oxidise VOCs and denature the microbial constituents of microorganisms (Daniels, 2002).
Electrostatic precipitators: Through high voltage, electronic charge is provided to airborne particles which are then attracted to oppositely charged collecting plates (Zuraimi and Tham, 2009 ). Ionic generators with charged filter: Ion generators charge airborne particles to be collected on low efficiency filter media with an electrical charge (Myers and Arnold, 2003).
Plasmacluster ion: Ion generator uses an alternating plasma discharge to split water molecules into oppositely charged hydrogen and oxygen ions. The collision of hydrogen with oxygen ions forms OH radicals that react with proteins/polysaccharides in the cell wall or surface structure of the airborne microbials thus damaging it (S.H.A.R.P. Electronics, 2005 ).
Gas phase filtration Physical adsorption: The removal process of VOCs and ozone via attraction to the adsorbents surface, both outer surface and inner pore surface, of a media (e.g. activated charcoal) by physical forces (Van der Waals forces) (Underhill, 2000).
Chemisorption: The removal process of low molecular weight aldehydes (e.g. formaldehyde), organic (formic acid) and inorganic acids (e.g. NO) via binding to the surface of a solid by forces whose energy levels approximate those of a chemical bond (Underhill, 2000).
Ultraviolet germicidal irradiation (UVGI)
Involves the sterilization method by irradiating the short wavelength of UV light (UVC) to destroy the nucleic acids in micro- organisms such as bacteria, fungi and viruses (Brickner et al., 2003).
Nanotechnology Nanomaterials have properties that enable both chemical reduction and catalysis to mitigate the pollutants of concern. They can be used in mold remediation, applied as coatings in filters of FS and PAC, PP and internal of ventilation system during duct cleaning. Nanotechnology is also employed in surface excitation by ultraviolet radiation and particle aggregation used in FS and PAC (Sharpe, 2006). For biological contaminants, nanoparticles interacts with elements of the bacterial membrane, causing a structural change, dissipation of the proton motive force and finally to cell death (Yoon et al., 2008; EPA, 2007).
Biofiltration The removal process of VOCs via metabolism using naturally occurring microorganisms immobilized in the form of a biofilm on a porous substrate such as soil, compost, peat, bark, synthetic substances or their combination to their primary components - carbon dioxide and water, plus additional biomass and innocuous metabolic products (Darlington et al., 2000; Chen et al., 2005).
Microbial coating Coatings with anti-microbial properties placed on surfaces (e.g. media filters, walls) with the objectives of reducing the concentration of airborne microorganisms in the indoor air and potential of the surface becoming a source for microbial contamination (Pyankov et al., 2008; Chen and Poon, 2009).
Heat/Energy transfer modules
Opposing air streams are sent through alternating layers of aluminium plates or polypropylene cores (HRV). In ERV, the core is made of a paper based permeable material that allows some moisture transfer. HRV and ERV usually incorporate filtration systems to remove airborne pollutants (Marsik and Johnson, 2008).
The reduction of relative humidity levels from HRV/ERV use has the potential to create
micro-environments unfavorable for dust mite proliferation and mold growth (Howieson et al., 2003; Wright, 2007).
20 |
P a g e
Technologies Mechanism and target pollutants1
Desiccants The rotating wheel cylinder filled with an air permeable material of large surface area can adsorb gaseous contaminants such as VOCs (Fang et al., 2008).
Liquid desiccants absorb VOCs via simple hydrolysis, catalyzed hydrolysis, or catalyzed oxidation (Chung et al., 1993; Munro et al., 1999) resulting from action of the desiccant itself or desiccant enhanced by added metal salts or catalytic surfaces. Particles in the air stream are washed down by desiccant while microorganisms (e.g. vegetative cells) can be killed on contact with desiccant solution due to the biocidal effects of salts and dehydration.
Liquid
decontamination agents
Liquid solutions are applied directly on a surface contaminated with a biological or chemical agent (EPA, 2005).
Foams and gel decontamination agents
Foam and gel agents works by enhancing the surface removal of biological or chemical contaminants through delivering them in a matrix that can be applied onto vertical and horizontal surfaces. Wall application using this technology ensures sufficient contact time to effectively treat the surface biological contaminant (Buttner et al., 2004; EPA, 2005). Some enzymatic foams decontaminate chemical and biological agents through catalysis.
Gaseous and vapour decontamination agents
The agents are vaporised and released to an indoor environment where it reacts and oxidised certain classes of airborne organic compounds and airborne micro-organisms (Hubbard, 2006; Korzun et al., 2008). The oxidants also come into contact with all of the materials indoor to oxidise adsorbed organic compounds, as well as bacteria, fungi and viruses (Hubbard, 2006; EPA, 2005).
Duct cleaning Conventional duct cleaning involves the use of high-efficiency particle air (HEPA) vacuum equipment that exhausts particles from the ventilation system (Brosseau et al., 2000a; NAIMA, 2007). Mechanical dislodgement of deposited dusts via well-controlled brushing of duct surfaces or compressed air spray or the use metal “skipper” balls in conjunction with vacuum cleaning is used (NAIMA, 2007). For biocontamination duct cleaning, an additional procedure of coating with biocides is applied to remove fungal and bacterial deposits (Brosseau et al., 2000b).
Cleaning Accumulated dry particle removal using a powerful, industrial grade vacuum cleaning equipment after pile preparation. For ground-in particles that are not easily removed, use of detergents and solvents to suspend, emulsify, peptize or saponify particles of various solubilities at an elevated temperature and mechanical agitation. Particle extraction follows by either absorption, wet or dry vacuuming and rinsing methods (IICRC, 2000; 2002). Some sources are associated with odors and/or VOCs released from micro-organisms, commonly known as microbial volatile organic compounds (MVOC). Water damage
restoration / Mold remediation
Extraction pumps used to remove standing water, followed drying pressure equipments for drying surfaces and dehumidification equipments (refrigerant dehumidification or desiccant
dehumidification) to remove moisture in the air. Biocides are used in conjunction with the above restoration process to remove microbial amplifiers or prevent their growth (IICRC, 2006; 2008). Sometimes, methods involving controlled heat application to a structure are applied to kill mold spores and vegetative structures while abrasive cleaning methods are applied to dislodge mold sources (IICRC, 2008 ).
1
Unless otherwise described, particles given in this table include both living and inanimate.
3.2 IAQST Performance Indices
In discussing IAQST performance, we adopt the description provided by Miller-Leiden et al (1996) in
differentiating the concept of efficiencies and effectiveness. In this context, efficiency describes the
likelihood of the IAQST to remove the pollutant from the air or source matrix at the specific location
where the technology is applied. Effectiveness describes the impact of the IAQST on indoor air
concentrations in actual settings. Thus, effectiveness is more relevant when discussing human
pollutant exposure, dose and subsequent health risk and impact (Miller-Leiden et al. 1996).
21 |
P a g e
3.2.1 Efficiencies of IAQSTs
For duct cleaning, North America Insulation Manufacturers Association (NAIMA) has summarized in its
recommended practice, three types of most commonly used cleaning techniques: contact vacuum, air
washing, and power brushing (NAIMA, 2007). Verification of cleaning efficiencies includes visual
inspection, objectively evaluating the deposit thickness test (DTT) and vacuum test (VT) (NADCA,
2006; HVCA 2005; NAIMA, 2007), wipe test (Ito et al., 1996) and optical method (Holopainen et al.,
2002). Indeed, considering the various methods adopted in these published studies, only crude
comparisons can be made. Ito et al (1996) recorded 4-11 mg/m2 of dust before cleaning and 1-2
mg/m2 after cleaning using wiping method. Kulp et al (1997) measured pre-cleaning dust deposits
using VT ranging from 0.2 to 3.6 g/m2 reduced to less than 0.2 g/m2 after cleaning in nine residential
homes. Holopainen et al (2003) reported that mechanical brush cleaning reduced the amount of dust
deposits in new Finnish buildings from 0.6 - 0.9 g/m2 (before cleaning) to 0.1 - 0.2 g/m2 (after
cleaning) while compressed air cleaning reduced dust amounts from 5.4 to 0.3 g/m2. These values
translate to a reduction of accumulated dust left on the duct surfaces ranging from 6 to 44%
(Holopainen et al., 2003; Ito et al., 1996; Kulp et al., 1997).
Published studies on upholstery and carpet cleaning reports on the reduction of dust, lead, bacteria,
fungi, allergen and even polycyclic aromatic hydrocarbons (PAHs) deposits. No performance index was
identified except determining the percentage reduction of deposits after cleaning. Franke et al (1997)
reported after cleaning reductions of 40 and 84% respectively for fungi and bacteria in carpets. Adilah
et al., (1997) noted regular vacuuming can lower allergen levels in carpets substantially while HEPA
vacuuming can be more effective than conventional vacuuming (Popplewell et al., 2000; Yu et al.,
2009). In a study among low-income urban Seattle homes, Vojta et al (2001) documented that by
vacuuming, group 1 mite allergen levels decreased by 43% from a base level of 70 ug/g. However, the
levels rose back to 60ug/g after 4 weeks. They also reported that by combining vacuuming and dry
steam cleaning, the allergen levels decreased by 28% over the same period. This concurs with Yiin et
al’s (2008) report of mean percent reductions for lead loadings of 29 and 39% for vacuuming and
vacuuming and dry steam cleaning combination respectively. They also reported that the
characteristics of the carpets may have affected cleaning efficiency where level-loop carpets appeared
to be more “cleanable” than cut-pile carpets, regardless of the cleaning method used. Roberts et al.
(2005) mentioned that after starting surface carpet dust has been removed, further decrease by 84%
to 99% can be achieved if deep dust was removed using an inbuilt “dirt finder” device. Yu et al (2009)
noted larger reductions in loading of dust (64.4%), PAH (69.1%), and dust mite allergens (85.5%) by
dry steam cleaning together with repetitive HEPA vacuuming compared to regular HEPA vacuuming
alone: dust (55.5%), PAHs (58.6%), and HDM allergens (80.8%).
It is unclear what constitutes an efficient mold remediation, water damage restoration or building
disinfection (Seiler et al., 1987; Haverinen-Shaughnessy et al. 2008). From a technical viewpoint,
efficient or successful remediation relied on ‘best engineering judgement’ and/or considered
sufficient if proper evaluation of existing damage, elimination of the causes of damage and removal
and replacement of damaged materials are addressed (IICRC 2006, 2008; Shaughnessy and Morey,
1999). These assessments are judgemental and do not allow for a statistical statement as to the
confidence in the decontamination process. Although, experimental studies on cleaning efficiencies
22 |
P a g e
on realistic building materials has been conducted (Hubbard, 2006; Wilson et al., 2004; Rastogi et al.,
2009), no objective measure related to pollutant removal efficiency in the field has been identified
(Haverinen-Shaughnessy et al. 2008). For example during actual building disinfection, the gaseous
agent interacts with various interior building materials in addition to the biological contaminants it is
intended to address. This interaction when coupled with building ventilation can lower indoor
concentration of gaseous agents which in turns lowers the capacity to disinfect the biological
contaminant.
Portable air cleaners are often rated with a clean air delivery rate (CADR). The CADR is the product of
device flow rate and single pass efficiency - the higher the value the better the performance. CADR is
normally computed in a chamber or controlled room environment and has been consistently used to
compare PAC devices (AHAM, 2006a). CADR provides a more representative performance
characterization in a real environment rather than a measure of the single pass efficiency alone
(Waring et al., 2008; Daisey et al., 1989) because it considers both the room mixing and single pass
efficiency of the technology. Although CADRs have been computed for various indoor contaminants
(environmental tobacco smoke (ETS), pollen, Arizona road dust, incense smoke), it can be broadly
categorized into particle or gaseous dependent. Studies on various portable air cleaners (Shaughnessy
et al.,1994; Grinshpun et al., 2007) have noted small or insignificant difference in particle removal
performance for the same general particle size range regardless of whether they were biological or
inanimate particles. For particles, it can be summarized that efficacy of technologies follow the trend
of HEPA<ESP<ionisers<ozone generators. Reported CADRs for particles associated with ETS range
from 277–407m3/h for HEPA PAC, 197–499m3/h for ESP PAC, 2–51m3/h for ion generators
(Shaughnessy et al., 1994; Offermann et al., 1985) and 80 m3/h for ozone generator (Shaughnessy et
al., 1994). There are few particle resolved CADR values reported for ultrafine, fine and coarse particles
(Waring et al., 2008). For gaseous contaminants, the values vary depending on compounds and
technologies: CADRs for toluene range from 3-163 m3/h for activated carbon (Daisey et al., 1989;
Chen et al., 2005); CADRs for dichloromethane did not vary statistically from zero for activated carbon
but recorded 2 m3/h for activated carbon with potassium permanganate (Daisey et al., 1989); CADRs
for nitrogen dioxide range from 0-72 m3/h (Daisey et al., 1989; Shaughnessy et al., 1994). Current
information suggests that PAC sorption technology performance is the best for general removal of
indoor VOCs, with chemisorption technology performing better for more volatile gaseous
contaminants (Daisey et al., 1989; Chen et al., 2005; Shaughnessy et al., 1994). Performance of PCO
PAC devices is reported to be ineffective due to poor product designs (Chen et al. 2005; Mo et al.
2009). Chen et al (2005) reported that PAC with PCO, ionizers and ozone generating technologies did
not significantly remove the challenge VOCs except for limonene.
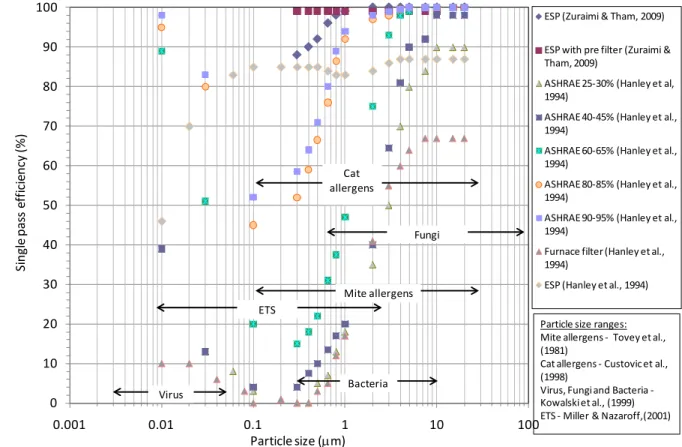
Filtration systems (FS) in HVAC have been widely studied, and the common performance index used
has been the single-pass removal efficiency. Several studies have measured particle resolved
efficiencies for various filters using standard aerosol challenge in test rigs (Hanley et al., 1994; Raynor
and Chae, 2003) and in situ using naturally occurring aerosols (Zuraimi and Tham, 2009). Filter
efficiency curves are typically V shaped with the lowest efficiency at about 0.3 microns. ESP filters
typically have removal efficiencies up to 100% for particles greater than one micron (Zuraimi and
Tham, 2009) while HEPA filters have efficiencies of at least 99.97% for all particle sizes (Hanley et al.,
1994). Researchers have found reasonable concurrence in the removal efficiencies of standard
23 |
P a g e
challenge aerosols with biological active aerosols (Maus and Umhauer, 1997), although removal for all
bioaerosol types has not been evaluated. Typical single pass efficiencies of FS together with the size
ranges of various aerosols are illustrated in Figure 2. Single pass gaseous pollutants removal
efficiencies for FS have been evaluated using sorption and PCO technologies (Weschler et al., 1994;
Tham et al., 2004; Hodgson et al., 2007; Howard-Reed et al. 2008). After 37 months of servicing,
Weschler et al (1994) recorded ozone removal efficiencies ranging from 90-95% for charcoal filters
protected from submicron particles and 60% for similar filter with accumulated dusts. Tham et al
(2004) reported single pass efficiencies for large amount of VOCs using activated carbon in a tropical
office building – efficiencies range from 43–93% for the alcohols, 16–91% for carbonyl compounds,
28–54% for terpenes, 22 to 85% for the aromatics, 22 - 81% for alkanes, 46–66% for the halogenated
compounds, 62–96% for the esters and 54–65% for the cyclic compounds. Howard-Reed et al (2008)
noted decane removal efficiencies in a test house experiment ranging from 40-73% using a
combination of pleated fiber matrix containing activated carbon, alumina, and potassium
permanganate. Hodgson et al (2007) studied removal efficiencies of VOCs mixtures, characteristic of
office buildings and cleaning products, at realistic concentrations using PCO. The removal efficiencies
follow the trend: alcohols and glycol ethers > aldehydes, ketones, and terpene hydrocarbons >
aromatic and alkane hydrocarbons > halogenated aliphatic hydrocarbons. Formaldehyde was noted as
a by-product of PCO where output/input ratios range from 1.9 to 7.2.
Figure 2
Efficiency of some filtration system technologies and size ranges of various indoor
aerosols.
0 10 20 30 40 50 60 70 80 90 100 0.001 0.01 0.1 1 10 100 S in g le p a ss e ff ic ie n cy ( % ) Particle size (µm)ESP (Zuraimi & Tham, 2009)
ESP with pre filter (Zuraimi & Tham, 2009)
ASHRAE 25-30% (Hanley et al, 1994)
ASHRAE 40-45% (Hanley et al., 1994)
ASHRAE 60-65% (Hanley et al., 1994)
ASHRAE 80-85% (Hanley et al., 1994)
ASHRAE 90-95% (Hanley et al., 1994)
Furnace filter (Hanley et al., 1994)
ESP (Hanley et al., 1994)
Virus Bacteria Fungi ETS Mite allergens Cat allergens
Particle size ranges: Mite allergens - Tovey et al., (1981)
Cat allergens - Custovic et al., (1998)
Virus, Fungi and Bacteria -Kowalski et al., (1999) ETS - Miller & Nazaroff,(2001)