Publisher’s version / Version de l'éditeur:
Vous avez des questions? Nous pouvons vous aider. Pour communiquer directement avec un auteur, consultez la première page de la revue dans laquelle son article a été publié afin de trouver ses coordonnées. Si vous n’arrivez pas à les repérer, communiquez avec nous à PublicationsArchive-ArchivesPublications@nrc-cnrc.gc.ca.
Questions? Contact the NRC Publications Archive team at
PublicationsArchive-ArchivesPublications@nrc-cnrc.gc.ca. If you wish to email the authors directly, please see the first page of the publication for their contact information.
https://publications-cnrc.canada.ca/fra/droits
L’accès à ce site Web et l’utilisation de son contenu sont assujettis aux conditions présentées dans le site LISEZ CES CONDITIONS ATTENTIVEMENT AVANT D’UTILISER CE SITE WEB.
Client Report (National Research Council of Canada. Construction), 2015-06-09
READ THESE TERMS AND CONDITIONS CAREFULLY BEFORE USING THIS WEBSITE. https://nrc-publications.canada.ca/eng/copyright
NRC Publications Archive Record / Notice des Archives des publications du CNRC :
https://nrc-publications.canada.ca/eng/view/object/?id=ff3caf70-afa1-4516-90e9-582ec6967f3e https://publications-cnrc.canada.ca/fra/voir/objet/?id=ff3caf70-afa1-4516-90e9-582ec6967f3e
NRC Publications Archive
Archives des publications du CNRC
For the publisher’s version, please access the DOI link below./ Pour consulter la version de l’éditeur, utilisez le lien DOI ci-dessous.
https://doi.org/10.4224/23002868
Access and use of this website and the material on it are subject to the Terms and Conditions set forth at High performance roofing and walls technologies: task 3, thermal optimization in curtain wall design: comparative analysis of European and North-American curtain wall frames
Const ruc t ion
H igh Pe rfor m a nc e Roofing a nd
Wa lls Te c hnologie s
T a sk 3 — T he rm a l Opt im iza t ion in Curt a in Wa ll
De sign – Com pa ra t ive Ana lysis of Europe a n a nd
N ort h-Am e ric a n Curt a in Wa ll Fra m e s
Client Report: A1-002844-03
Nathan Van Den Bossche
9 June 2015
Table of Contents
Table of Contents ... i
List of Figures ... iii
List of Tables ... v Summary ... vii Acknowledgements ... ix Nomenclature ... xi 1. Normative Context ... 1 1.1 Introduction ... 1 1.2 NFRC 100-2014 ... 2 1.3 ISO 12631 [] ... 4 2. Simulation Approach ... 7
2.1 Simulation of mechanical fixings ... 8
2.2 Temperature index ... 10
3. Collection of Typical Sections of North-American and European Commercial Curtain Wall Systems ... 11
3.1 Commercial European curtain wall systems ... 11
3.2 Commercial North-American curtain wall systems ... 12
3.3 Thermal improvement of curtain wall systems ... 14
4. Development of Generic Curtain Wall Systems ... 15
4.1 European versus North-American generic curtain wall frame ... 15
4.2 Thermal transmittance: European versus North-American curtain wall frame ... 18
5. Thermal Performance Analysis of Curtain Wall Frames ... 18
5.1 Profile width and length ... 20
5.2 Length of fastener fins ... 22
5.3 Position of the glass units... 24
5.4 Spacing between fasteners ... 26
5.5 Glass unit thickness ... 27
5.6 Thermal conductivity(Λ)of fasteners and compartmentalization profile ... 29
5.7 Snap cover length ... 31
6. Optimized Curtain Wall Frames ... 32
6.1 Additional insulation ... 32
6.2 Materialization of the curtain wall frame ... 33
6.3 Semi-structural glazing ... 34
6.4 Combination towards optimal curtain wall frame ... 35
List of Figures
Figure 1 – Schematics of cavities; From left to right—H-cavity, L-cavity, and the C-cavity and definitions
of cold and hot surfaces and dimensions [6] ... 3
Figure 2 – Heat flow in unventilated cavities - Key: (1) – reaction of heat flow; (b) – dimension perpendicular to direction of heat flow; (c) – dimension of cavity in direction of heat flow; ε1and ε2 – emissivities of respective surfaces ... 6
Figure 3 – (a) Smoothed lambda method and (b) smoothed thickness method in TRISCO ... 9
Figure 4 – Three Commercial European Curtain Wall Systems showing horizontal sectional details and the configuration detail used in simulations as well as results from simulation ... 12
Figure 5 – Three Commercial North American Curtain Wall Systems showing horizontal sectional details and the configuration detail used in simulations as well as results from simulation ... 13
Figure 6 – Horizontal sectional details of commercial European and North American curtain wall systems highlighting locations and components to provide improvements in thermal performance .. 14
Figure 7 – (a) European and (b) North-American generic curtain wall frame ... 16
Figure 8 – Temperature gradient of generic curtain wall frames (a) European; (b) North-American ... 17
Figure 9 – Heat flux profile of generic curtain wall frames (a) European; (b) North-American ... 17
Figure 10 – Visualization of cooling fin effect (a) with interior aluminum frame and (b) without interior aluminum frame ... 18
Figure 11 – Visualization of sensitive parameters ... 19
Figure 12 – Profile width and length ... 20
Figure 13 – Profile width and length ... 21
Figure 14 – Temperature gradient profile for (a) 100m, (b) 200mm and (c) 300mm profile length and 60mm width ... 21
Figure 15 – Heat flux profile for (a) 100m, (b) 200mm and (c) 300mm profile length and 60mm width . 22 Figure 16 – Length of fastener fins ... 22
Figure 17 – Impact of length fastener fins ... 23
Figure 18 – Temperature gradient profile of fastener fins (a) 15mm, (b) 25mm, (c) 35mm ... 23
Figure 19 – Heat flux profile of fastener fins of (a) 15mm, (b) 25mm, (c) 35mm ... 24
Figure 20 – Position of the glass unit ... 24
Figure 21 – Position of the glass units ... 25
Figure 22 – Temperature gradient profile for varying IGU positions: (a) -5mm; (b) 0mm, and; (c) +5mm ... 25
Figure 23 – Heat flux profile of IGU positioned towards inner cavity: (a) -5 mm; (b) 0 mm; (c) +5 mm 26 Figure 24 – Spacing between screws ... 26
Figure 25 – Thermal transmittance as a function of fastener spacing ... 27
Figure 26 – Glass unit thickness ... 27
Figure 27 – Thermal transmittance as a function of unit thickness of glazing ... 28
Figure 28 – Temperature gradient profile for (a) 28mm, (b) 44mm and (c) 60 mm glass thickness ... 28
Figure 29 – Heat flux profile for (a) 28mm, (b) 44mm and (c) 60 mm glass thickness ... 29
Figure 30 – Varying conductivity ... 29
Figure 31 – Conductivity of different fastener and compartmentalization profile materials ... 30
Figure 32 – Snap cover length ... 31
Figure 33 – Length snap cover ... 31
Figure 34 – Heat flux profile for a snap cover length of (a) 13.5mm, (b) 23.5mm and (c) 33.5mm ... 32
Figure 35 – Additional insulation in the inner cavity: option (a), option (b) and option (c) ... 32
Figure 36 – Improved materialization (a) GFRP frame, (b) Polymer pressure plate ... 33
Figure 37 – Semi-structural glazing ... 34
List of Tables
Table 1 – Simulation results of fasteners in BISCO, TRISCO and SOLIDO ... 9
Table 2 – Performance of generic curtain wall frames ... 17
Table 3 – Sensitive parameters ... 19
Table 4 –Conductivity of materials ... 19
Table 5 – U-values for varying IGU positions ... 26
Table 6 –Conductivity fasteners ... 27
Table 7 – Effect of additional insulation ... 33
Table 8 – Thermal performance due to improved materialization of the frame ... 34
Table 9 – Thermal performance of semi-structural glazing ... 34
Summary
In 2012 the NRC-Construction initiated a project on the “High Performance Walls and Roofing Technologies Next Generation Technologies R&D – Building Envelopes”. Partnership and funding for the project was obtained from NRCan (Housing and Buildings /Sustainable Building and Communities CANMET / Group) under the Program of Energy Research and Development (PERD).
In commercial buildings, curtain wall systems often cover a significant part of the building envelope, and therefore their impact on the overall thermal performance of the building is important. In order to evaluate, compare and improve curtain wall designs, one needs insights in the different calculation and evaluation methods, and state-of-the-art in thermal optimization in curtain wall design.
The overall objective of this project was to improve the thermal efficiency of commercial building envelopes. This was achieved by using different approaches to improve the overall effective R-values of the curtain wall systems.
The project consisted of a number of Tasks in which curtain wall were evaluated, compared and suggestions made for improvement to the thermal performance of such systems, and include:
o Task 1: Literature review on Curtain Walls
o Task 2: Curtain Walls and National Energy Code for Buildings 2011 o Task 3: Thermal Optimization in Curtain Walls: Part I - Modelling
o Task 4: Thermal Testing and Optimization in Curtain Walls: Part II - Experiment o Task 5: CFD Modelling of Curtain Walls
This report focuses on Task 3. The Thermal Optimization in Curtain Walls: Part I – Modelling. It was prepared by Dr. N.Van Den Bossche, ir. arch., manager of the Test Center for Façade Components for the University of Ghent, Belgium. Dr.Van Den Bossche has extensive expertise as regards the evaluation of the thermal and watertightness performance of curtain wall systems, and is knowledgeable of both European and North American design and practice. Given that in Europe there is a need for more thermally performing curtain wall systems, European curtain wall designs are considered more advanced than those currently being specified in North America. Accordingly, in this report an analysis is presented on the thermal performance of typical North-American and European curtain wall systems by adopting a uniform calculation methodology. A relative comparison of thermal performance was made to evaluate the effect of specific parameters on the overall thermal performance of the curtain wall system. Only the U-value of the curtain wall was considered; the thermal performance of the IGU (center of glazing), the spacer (edge of glazing), and the window-wall interface were excluded. However, the specific geometry of the IGU (i.e., thickness; width) was considered. Whereas, given that the spacer and window-wall interface do not have an effect on the U-value of the frame, these components were not part of the analysis. This approach permitted isolating the impact of the curtain wall itself on the overall thermal performance; as such, the results of this analysis can be combined with separate simulations on IGU and IGU spacers.
Acknowledgements
NRC wishes to acknowledge the partnership and funding for the project as provided by NRCan (Housing and Buildings /Sustainable Building and Communities CANMET / Group) under the Program of Energy Research and Development (PERD). As well, NRC wishes to express its thanks to Dr. N.Van Den Bossche for having agreed to take on the simulations and analysis of the various curtain wall systems in the very restricted timeframe in which the results were required.
Nomenclature
A Surface area [m²]
hcv,ex Exterior convective heat transfer coefficient [W/m²K] hcv,int Interior convective heat transfer coefficient [W/m²K]
I Temperature Index [-]
Lh Length of horizontal direction [m] Lv Length of vertical direction [m]
Nu Nusselt number [-]
Ra Rayleigh number [-]
Rse Exterior surface resistance [m²K/W] Rsi Interior surface resistance [m²K/W]
Tin Inside temperature [°C]
Tout Outside temperature [°C]
Uf Thermal transmittance (frame) [W/m²K] λ Thermal conductivity coefficient [W/mK]
High Performance Roofing and Walls Technologies –
Task 3 – Thermal Optimization in Curtain Wall Design
Comparative Analysis of European and North-American
Curtain Wall Frames
Authored by:
Nathan Van Den Bossche, Ph.D., ir. arch. Manager of the Test Center for Façade Components
Department of Architecture and Urban Planning Faculty of Engineering and Architecture
University of Ghent Sint Pietersnieuwstraat 41 B4
9000 Ghent Belgium
A Report for the
Natural Resources Canada (NRCan)
Housing and Buildings
Sustainable Building and Communities CANMET / Group
ATT: Mr. Anil Parekh
National Research Council Canada Ottawa ON K1A 0R6 Canada
9 June 2015
This report may not be reproduced in whole or in part without the written consent of both the client and the National Research Council of Canada
High Performance Roofing and Walls Technologies
Task 3 – Thermal Optimization in Curtain Wall Design Comparative Analysis of European and North-AmericanCurtain Wall Frames
Final Report Task 3
Nathan Van Den Bossche
1. Normative Context
1.1 Introduction
In this report an analysis is presented on the thermal performance of typical North-American and European curtain wall systems. In order to assess and evaluate that performance, a uniform calculation methodology was adopted. It is important to mention that the North-American and European approach to thermal performance assessment are not completely identical. This has two consequences: first of all, small discrepancies may arise between the results in the analysis presented in this report, and results published by manufacturers using a different calculation method. Different calculation rules lead to different heat transfer results. However, in this report only a relative comparison is made to evaluate the effect of specific parameters on the thermal performance. Consequently, small differences in absolute value are not as important, and the specific choice of calculation method should not be overrated. Secondly, the sheer existence of very specific calculation rules inevitably leads to adapted industrial designs. For example, in North-America, two cavities are considered as independent and connected with a “throat” region when the shortest distance between two sides is smaller than 5 mm [cf. 1], whereas in Europe a value of 2 mm is used as criterion [2]. So when, for example, two parts of one cavity are separated by a throat region that is only 2 mm wide, the two zones of the cavity can be considered as two separate zones. By consequence, window frame and curtain wall designs might differ slightly in different regions, as profiles are most likely optimized according to local calculation methods. For the example, as described above relating to cavity subdivision, in North-America one would find a considerable number of 4.9 mm throats, whereas in Europe 1.9 mm throats are more prominent. By consequence, simulating frame sections according to a calculation sequence for which it was not optimized might lead to a “sub-optimal” design.
1 ISO 15099:2003 — Thermal performance of windows, doors and shading devices - Detailed calculations; 71 pgs. 2
ISO 10077-2:2012 — Thermal performance of windows, doors and shutters – calculation of thermal transmittance – Part 2: Numerical method for frames; 36 pgs.
TASK 3—THERMAL OPTIMIZATION IN CURTAIN WALL DESIGN
REPORT A1-002844.03 2
In the analysis undertaken in this study only the U-value of the curtain wall is considered, which excludes the thermal performance of the IGU (center of glazing), the spacer (edge of glazing), and the window-wall interface. The specific geometry of the IGU, i.e., thickness and width, does have an effect on the U-value of the frame, and will thus be considered. The spacer and window-wall interface do not have an effect on the U-value of the frame, and by consequence is not part of the analysis. This approach thus isolates the impact of the curtain wall itself on the overall thermal performance, and the results of this analysis can thereby be combined with separate simulations on IGU and IGU spacers. Furthermore, there is a significant discrepancy between the European and North-American approaches that must be considered. In Europe only the center-of-panel U-value of the IGU is considered (and multiplied with the total IGU surface), whereas the impact of the IGU edge spacer is accounted for by means of a linear thermal transmittance. In contrast, in North-America the IGU area is separated in two distinct areas: the center-of-panel, and a band of 63.5 mm wide with a U-value that incorporates the edge effect of the spacer [3].
1.2 NFRC 100-2014
In North-America the NFRC 100-2014 [4] is the standard typically used to evaluate the thermal performance of window and curtain wall systems. The document provides guidelines on how to determine the U-value of product lines (how to cope with different sizes, how to select a test matrix, rules for extrapolation etcetera) and custom products. For the simulation and calculation of the thermal performance of individual frames the document refers to ISO 15099 [1]. As well, it is specified that only area-weighed methods are allowed. Furthermore, a number of technical aspects are listed, only the most important ones are summarized below:
• Boundary conditions: Tin 21°C; Tout -18°C; wind speed 5.5 m/s;
• Indoor convective heat transfer coefficient is based on center-of-panel IGU surface temperature;
• On the interior side a detailed grey body radiation model shall be used;
• The exterior convective heat transfer coefficient is based on the exterior wind speed (26W/m²K);
• On the exterior side, a detailed black body radiation model shall be used; • A cross-section should include at least 150 mm of glazing section.
Note that NFRC 100-2014 [4] does not specify what correlation should be used to calculate the convective heat transfer coefficient on the interior and exterior sides. For either heat transfer
3 i.e. the alternative approach described in section 4.1.4 of ISO 15099 [1]
4 NFRC 100-2014 (2013), Procedure for determining Fenestration Product U-factors; National Fenestration Rating Council;Greenbelt, MD; 109 pgs.
coefficient, several correlations can be found in literature. The NFRC 100-2014 [4] does not include specific calculation procedures for curtain wall systems.
ISO 15099 [1] provides guidelines on the calculation of the thermal performance of windows and doors. Two different thermal indices are presented to normalize the absolute heat loss through a component: the linear thermal transmittance ψ [W/mK] and the frame thermal transmittance U [W/m²K]. ISO 15099 [1] refers to ISO 10077-2 [2] and ISO 10211 [5] for the details regarding the required two-dimensional numerical analysis, and specifies the following boundary conditions:
• Tin 20°C; • Tout 0°C;
• Interior convective heat transfer coefficient is 3.6 W/m²K; • Exterior convective heat transfer coefficient is 20 W/m²K.
ISO 15099 [1] also provides correlations for the convective heat transfer coefficient; specifically: • hcv,ex = 4.7 + 7.6*V
In addition, the treatment of cavities according to ISO 15099 [1] depends on the orientation. In this report only horizontal heat flows are considered (the curtain wall is assumed to be in a vertical position), and for which the relevant schematics of cavities are given in Figure 1 [6]. The Nusselt number (Nu) can be calculated as follows:
a) for �� �ℎ
<
1
2the Nusselt number is: �� = 1 + ��2.756 � 10−6��2��� �ℎ 8 �� −0.386 + �0.623��1/5��� �ℎ� 2/5 � −0.386 � −2.59
Figure 1 – Schematics of cavities; From left to right—H-cavity, L-cavity, and the C-cavity and definitions of cold and hot surfaces and dimensions [6]
5
ISO 10211:2007 —Thermal bridges in building construction -- Heat flows and surface temperatures -- Detailed calculations; 45 pgs.
6
Gustavsen, A., Kohler, C., Arasteh, D. and Curcija, D. (2005). Two-Dimensional Conduction and CFD Simulations of Heat Transfer in Horizontal Window Frame Cavities, ASHRAE Transactions, 111(1): 587–598.
TASK 3—THERMAL OPTIMIZATION IN CURTAIN WALL DESIGN
REPORT A1-002844.03 4
and for which Lυ is the dimension of the cavity in the vertical direction and Lh the dimension of
the cavity in the vertical horizontal direction, and Ra the Raleigh number (defined below). b) for ��
�ℎ
> 5
the following correlation, also the maximum Nu [= (Nu1, Nu2, Nu3)max] is given as: ��1 = ⎩ ⎨ ⎧ 1 +� 0.104�� 0.293 1 +�6310�� � 1.36� 3 ⎭ ⎬ ⎫1/3 ��2 = 0.242������ �� 0.273 ��3 = 0.0605(��)1/3Where Ra is the Raleigh number and is defined as:
�� = ��12 �3ℎ�����,��(��ℎ− ���) �����
c) for 12<���
ℎ
< 5
the Nusselt number is found using a linear interpolation between the endpoints of a) and b) above.Finally, the Therm 6.3 / Window 6.3 NFRC simulation manual [7] comprises an approach to take the effect of fasteners into account. Basically the impact of thermal bridges is accounted for by simulating the cross-section at the thermal bridge itself, adopting a surface area based on the “effective” thermal conductivity for the component that introduces the thermal bridge.
1.3 ISO 12631 [8]
The only ISO standard that specifically deals with calculating the thermal performance of curtain wall systems is ISO 12631. Two different calculation approaches are presented: the single assessment method and the component assessment method. The component assessment method is more suited for evaluating product lines and considers the frame, IGU and spacer of the IGU as separate components, which allows an easy approach towards calculating the performance of different combinations of frames, IGU’s and spacers. The energy transmission is normalized by
7
Mitchell, R., Kohler, C., Curcija, D., Zhu, L., Vidanovic, S., Czarnecki S. Arasteh, D., Carmody, J. and Huizenga, C. (2013), Therm 6.3 / Window 6.3 NFRC simulation manual; Lawrence Berkeley National Laboratory, LBNL-48255; 406 pgs.
dividing the heat loss by the surface area of the frame. This approach is often used in both Europe and North-America (where it is the only accepted method). The single assessment method was developed to calculate the thermal performance of systems that were developed for a specific project, and allows combining the effect of the frame and spacer in one calculation. But every time a single parameter is changed, the entire simulation must be repeated. The heat loss is expressed as a linear additional heat loss, similar to linear thermal transmittance that is used in thermal bridge calculation. NFRC 100-2014 [4] does not support the use of this approach. For determining the thermal transmittance of frames, mullions and transoms, ISO 12631 [8] refers to the numerical approach provided in ISO 10077-2 [2], or experimental assessment according to EN 12412-2[9].
ISO 10077-2 [2] is the reference standard for the numerical aspects for determining the thermal performance of window frames. According to this approach, the following boundary conditions should be adopted:
• Tin 20°C; • Tout 0°C;
• Interior surface resistance is 0.13 m²K/W in plane surfaces, (~ heat transfer coefficient of 7.7 W/m²K) and 0.20 m²K/W at edges or corners with reduced heat transfer (~ heat transfer coefficient of 5 W/m²K);
• Exterior surface resistance is 0.04 m²K/W (~ heat transfer coefficient of 25 W/m²K); • A cross-section should include at least 190 mm of glazing section.
Convection in unventilated cavities is calculated as follows:
The equivalent thermal conductivity λeq of the cavity in direction 1, shown in Figure 2, is given by Equation (1):
��� = �
�� Eq.(1)
Where:
d = Dimension of the cavity in the direction of heat flow as given in Equation (1); RS = Thermal resistance of the cavity, given by Equation (2);
�� = ℎ�+ ℎ1 � Eq.(2)
Where
ha = convective heat transfer coefficient hr = radiative heat transfer coefficient
9 EN 12412-2: 2003 — Thermal performance of windows, doors and shutters. Determination of thermal transmittance by hot box method; 46 pgs.
TASK 3—THERMAL OPTIMIZATION IN CURTAIN WALL DESIGN
REPORT A1-002844.03 6
Figure 2 – Heat flow in unventilated cavities - Key: (1) – reaction of heat flow; (b) – dimension perpendicular to direction of heat flow; (c) – dimension of cavity in direction of heat flow;
ε1 and ε2 – emissivities of respective surfaces
The convective heat transfer coefficient, ha, is:
For b < 5 mm, ha
=
�1 � where C1 = 0.025 W/(m•K) Otherwise, ha = ��� ��1 � ; �2Δ�1/3� where: C1 = 0.025 W/(m•K) C2 = 0.73 W/(m2•K4/3)ΔT = maximum surface temperature difference in the cavity If no other information is available, then ΔT = 10 K for which
ha = ��� ��1
� ; �3� where :
C1 = 0.025 W/(m•K) C3 = 1.57 W/(m2•K)
The radiative heat transfer coefficient, hr, can be calculated as follows: hr = 4���3��
where:
σ = 5.67 x 10⁻⁸ W/(m2•K4) the Stefan-Boltzmann constant E = Inter-surface emittance = �1 �1+ 1 �2− 1� −1 F =1 2��1 + �1 + (�/�)2� − (�/�)�
If no other information is available, then Tm = 283 K, for which hr =�4�1 + �1 + (�/�)2� − (�/�)
where C4 = 2.11 W/(m2•K)
The radiation heat transfer is calculated in a similar way in NFRC 100-2014 [4].
The only specific aspect of curtain wall systems that is not addressed in ISO 10077-2 [2], is the effect of fasteners that connect the internal to the external sections of mullions and transoms on the thermal performance of the system. Two approaches are provided in ISO 12631 [8] to take this effect into account: either a default value for ΔU is added to the U-value of the frame without fasteners, or it can be calculated according to the approach described in Annex C of ISO 12631 [8]. The only default value for ΔU that is listed is 0.3W/m²K. This can be used for fasteners in stainless steel, with a diameter ≤ 6 mm, and a distance between the connectors between 200 and 300 mm. Annex C provides an approach using an equivalent thermal conductivity for the fastener. The simulation is done assuming the fastener is a continuous metal plate in the profile, however, the actual performance of the fastener can be determined by changing the value of thermal conductivity of the metal plate.
2. Simulation Approach
The NFRC 100-2014 [4] refers to the ISO 15099 [1] for the calculation procedures, but specifies a number of small changes in modeling in respect to boundary conditions and values for the surface heat transfer coefficients. In turn, the ISO 15099 [1] standard refers to ISO 10077-2 [2]. The ISO 12631 [8] standard also refers to ISO 10077-2 [2] to determine the heat transmittance, but adds specific guidelines to account for fasteners (similar to the approach provided in the Therm 6.3 / Window 6.3 NFRC Simulation Manual [7]). Consequently, ISO 10077-2 [2] forms the basis for numerical simulations in both North-America and Europe. The most important differences refer to the boundary conditions and convection in cavities. Apart from these items, the calculation of thermal bridging effects is also important. As stated in the introduction, the focus in this report lies on a comparative analysis, and as such the relative difference between the various systems being investigated is more important than the absolute value of an individual calculation.
TASK 3—THERMAL OPTIMIZATION IN CURTAIN WALL DESIGN
REPORT A1-002844.03 8
A comparison of convection correlations can be found in the thesis by Gustavsen [10]. Considering a range of possible aspect ratio’s, the convection for aspect ratios below 0.4 is over-predicted when using ISO 10077-2 [2] as compared to measurements reported in literature, whereas the convection is under-predicted for aspect ratio’s raging between 0.4 and 10, and good correlation is evident for higher values of aspect ratio. The ISO 15099 [1] seems to work well for Raleigh numbers up to 105. However, the effect on thermal performance for a chosen correlation should not be overestimated. The results from simulations by Blanusa et al. [11] indicate that the difference in the overall thermal performance is never greater than 3%. However, it is useful to recall that this only refers to the difference in convection correlations in the cavities. As a consequence, ISO 12631 [8] is adopted (and ISO 10077-2 [2] to which both ISO 12631 [8] as NFRC 100-2014 [4] refer). Furthermore, this is the only ISO standard that was specifically developed for curtain walls, and is used in several continents. As well, optimization parameters and approaches used in the European context will be considered for thermal optimization, as the European approach is considered the most appropriate when evaluating the effectiveness of improvements in thermal performance. Similarly, fixed heat transfer coefficients are adopted that take into account reduced heat transfer at corners in accordance with ISO 10077-2 [2]. Again, the effect of different heat transfer coefficients is of limited importance for a comparative analysis, and the effects are less important for thermally improved systems.
2.1 Simulation of mechanical fixings
Although heat conduction through mechanical fixings is a 3D phenomenon, a 2D simulation method can provide a relatively precise estimation. According to Annex C of NBN EN ISO 12631:2012 [8], the fastener has to be modeled as a ‘smoothed’ fastener with its thickness equal to the real diameter with an equivalent thermal conductivity. The airspace surrounding the fastener needs to be treated as a single air space, to avoid inaccurate results.
Table 1 provides an overview of some results of simulating fasteners in curtain wall systems. BISCO, TRISCO and SOLIDO are similar programs [12], but BISCO uses a triangular grid, TRISCO has an orthogonal grid and SOLIDO also uses a rectangular grid with node fitting so it can almost perfectly replicate the original geometry. The results show that the difference between those three programs is limited (0.1%). When the actual geometry of the fastener is modeled accurately, the U-value is 2.526 W/m²K. The differences between the smoothed lambda method and the smoothed thickness method as developed in TRISCO are illustrated in Figure 3. When the smoothed lambda-value is applied, as adopted in Annex C of NBN EN ISO 12631:2012 [8] and Therm 6.3 / Window 6.3 NFRC Simulation Manual [7], the heat loss through
10 Gustavsen, A. (2001), “Heat transfer in window frames with internal cavities”, PhD thesis, Trondheim, Norway. 11 Blanusa, P., Goss, W. P.,Roth, H., Weitzmann, P., Jensen, C.F., Svendsen, S., Elmahdy, H. (2007), Comparison
between ASHRAE and ISO thermal transmittance calculation methods; Energy & Buildings 39 (2007) 374–384 12BISCO (2D steady state heat transfer); TRISCO (3D steady state heat transfer rectangular); SOLIDO (3D steady
the fasteners is underestimated by 6% (or 0.16 W/m²K) compared to the correct simulations. The simulations point out it is better to adopt the smoothed thickness approach: the fastener is replaced by a continuous plate which has the same overall cross section as the fasteners. For example, if each 250mm a fastener (simplified, 5x5 mm) connects both aluminum parts, the smoothed thickness of the thin plate is 0.1mm (5 mm x 5 mm = 25 mm² = 250 mm x 0.1 mm). In that case the heat loss through the fasteners is overestimated by 2%. However, based on the SOLIDO simulations the impact of the fastener itself is 0.267 W/m²k, 0.107 W/m²k based on the smoothed lambda approach in BISCO, and 0.329 W/m²k according to the smoothed thickness method. Based on these results, it was decided to use the smoothed thickness method.
Table 1 – Simulation results of fasteners in BISCO, TRISCO and SOLIDO Q [W/m] Q [W] Uf [W/m²K] Difference %
Frame without fastener
BISCO 8.3127 2.256 TRISCO 8.3205 2.259 SOLIDO 8.3205 2.259
Frame with fastener
SOLIDO 1.1049 2.526 Reference TRISCO 1.1141 2.564 + 2
Smoothed lambda method
(EN 13947) BISCO 8.4918 2.363 - 6 Smoothed thickness
method (EN 13947) BISCO 8.9182 2.585 + 2 Smoothed thickness
method (EN 13947) TRISCO 8.9260 2.571
+ 2
Figure 3 – (a) Smoothed lambda method and (b) smoothed thickness method in TRISCO
TASK 3—THERMAL OPTIMIZATION IN CURTAIN WALL DESIGN
REPORT A1-002844.03 10
2.2 Temperature index
The risk for mold growth or surface condensation can be evaluated by means of the Temperature Index (I). The Temperature Index of the window can be determined based on the following relationship provided in the CSA A440.2 Standard [13]:
I = (Ts–To) / (Ti – To) x 100 (2)
where Ti and To are the indoor and outdoor air temperatures, and Ts is the room-side surface temperature. For the equation (2) to be used internationally, a different definition of the temperature index is used according to EN ISO 13788:2001 [14]:
I = (Ts–To) / (Ti – To) (2)
The temperature index is non-dimensional, and represents the interior surface temperature relative to the interior and exterior air temperatures. The use of the temperature indexes offers the opportunity to compare the thermal performance of different systems. Due to Fourier’s laws linear correlation between heat transfer and temperature difference, the temperature index does not depend on the absolute value of the boundary conditions. Condensation will occur when the vapor pressure in the air near the building component is above the vapor saturation pressure that corresponds to the surface temperature. The saturation pressure can be calculated as follows (EN ISO 13788:2001 [14]):
����= 610.5∗ �17.269∗ �237.3+ � for θ ≥ 0°C (4)
����= 610.5∗ �
21.875∗ �
265.5 + � for θ < 0°C (5)
The inverted equations to calculate the temperature corresponding to any saturated vapor pressure:
� = 237.3∗�����610.5�����
17.269−�����610.5����� for psat ≥ 610.5 Pa (6)
� = 265.5∗�����610.5�����
21.875−�����610.5����� for psat < 610.5 Pa (7)
For each simulation the temperature index is reported in this report. The temperature index was determined at the coldest point at the interior surface. Note that this point is not necessarily located at the curtain wall: for thermal high-performance systems the coldest point is situated at
13 CAN/CSA-A440.2-14/A440.3-14 - Fenestration energy performance; 114 pgs.
14 ISO 13788:2012 — Hygrothermal performance of building components and building elements -- Internal surface temperature to avoid critical surface humidity and interstitial condensation -- Calculation methods
the IGU. In the simulations the IGU is replaced by the insulation panel (as prescribed by the aforementioned calculation standards and guidelines), and the temperature index on the panel is about 0.817. Only for rather poor systems will the temperature be lower. In practice, condensation also typically occurs at the spacer of the IGU, and not on the curtain wall system itself. Finally, the linear thermal transmittance ψ of every simulation is also reported, i.e., the heat flux divided by the length.
3. Collection of Typical Sections of North-American and
European Commercial Curtain Wall Systems
To design generic curtain walls systems, an overview of typical sections of North American and European commercial curtain wall systems is first required. Technical information on typical aluminum curtain wall systems was gathered from company websites, industry guidelines, public test reports, CE-marking databases and local technical approval documents.
3.1 Commercial European curtain wall systems
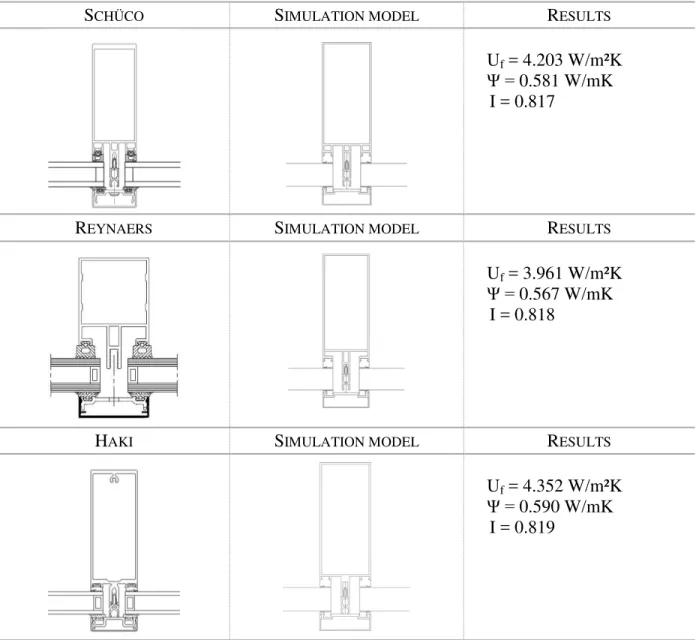
In Europe, a variety of curtain wall systems can be found. In general, the width of the frame varies between 50 and 60 mm, depending on the specific application. The length of the total frame varies as well; but only the interior frame will have a major influence on the thermal performance. In Figure 4, the horizontal sectional details and the configurations used in the simulations are provided for 3 frames (Manufacturers: Schüco; Reynaers; Haki) of 60mm width, 200 mm length and a glass thickness of 28 mm. As required by NBN ISO EN 10077-2 [2], the IGU length during simulations was 190 mm, as measured from the outer surface of the aluminum frame.
The results of the simulation amongst the three curtain wall systems are given in terms of the frame thermal transmittance (Uf), the linear thermal transmittance (Ψ), and the Temperature Index (I) of the respective curtain wall systems. The values for Temperature Index (I) are all essentially, the same at ~ 0.82 whereas values for the linear thermal transmittance (Ψ) vary between 0.567 to 0.590 W/mK (4%) and that of the frame thermal transmittance (Uf), between 3.961 and 4.352 W/m²K (10%); as such, there is not much difference in thermal performance amongst these different commercial European curtain wall systems.
TASK 3—THERMAL OPTIMIZATION IN CURTAIN WALL DESIGN
REPORT A1-002844.03 12
SCHÜCO SIMULATION MODEL RESULTS
Uf = 4.203 W/m²K Ψ = 0.581 W/mK
I = 0.817
REYNAERS SIMULATION MODEL RESULTS
Uf = 3.961 W/m²K Ψ = 0.567 W/mK
I = 0.818
HAKI SIMULATION MODEL RESULTS
Uf = 4.352 W/m²K Ψ = 0.590 W/mK
I = 0.819
Figure 4 – Three Commercial European Curtain Wall Systems showing horizontal sectional details and the configuration detail used in simulations as well as results from simulation
3.2 Commercial North-American curtain wall systems
In general, North-American curtain wall systems do not differ much from European frames, except for the shape of the aluminum frame itself. In most cases, the frame width is equal to 60 mm. In both Europe and North-America the mullions and transoms of curtain wall frames consist of an aluminum structural member on the inside, an aluminum pressure plate on the outside, and for reasons of esthetics an aluminum cap to finish the exterior. The IGU’s are installed with dry seals (typically EPDM). The most important difference between systems is the way the pressure plate is mechanically fixed to the structural member. To optimize the thermal performance of the system, the continuity of the insulation should be maintained in the space between the IGU’s, by avoiding materials with high conductivity, and reducing the section of
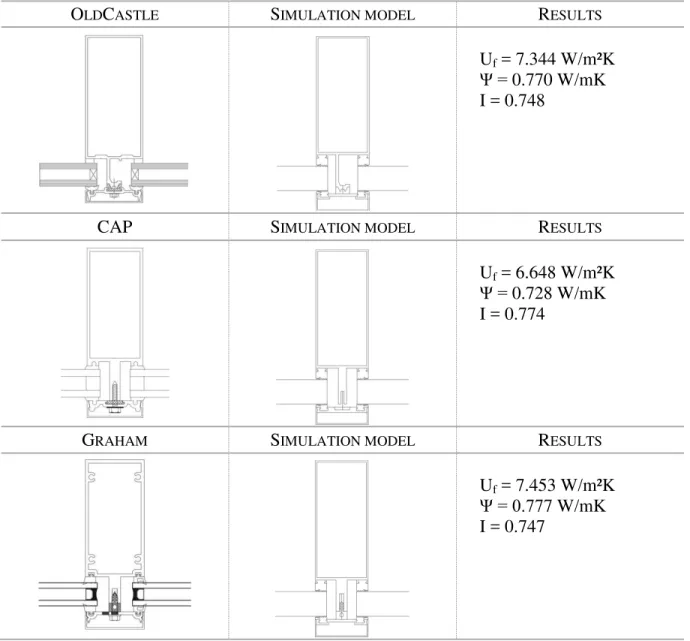
these components. In Figure 5, the horizontal sectional details and configurations used in the simulations are provided for 3 frames (Manufacturers: Oldcastle; Caps; Graham) of 60 mm width, 200 mm length and a glass thickness of 28 mm. As required by NBN ISO EN 10077-2 [2], the IGU length during simulations is 190 mm, as measured from the outer surface of the aluminum frame.
OLDCASTLE SIMULATION MODEL RESULTS
Uf = 7.344 W/m²K Ψ = 0.770 W/mK I = 0.748
CAP SIMULATION MODEL RESULTS
Uf = 6.648 W/m²K Ψ = 0.728 W/mK I = 0.774
GRAHAM SIMULATION MODEL RESULTS
Uf = 7.453 W/m²K Ψ = 0.777 W/mK I = 0.747
Figure 5 – Three Commercial North American Curtain Wall Systems showing horizontal sectional details and the configuration detail used in simulations as well as results from simulation The results of the simulation amongst the three representative North American curtain wall systems are given, as before, in terms of Uf, Ψ and I of the respective curtain wall systems. The values for I vary between 0.747 and 0.774 (4%), whereas values for Ψ vary between 0.728 to 0.777 W/mK (7%) and that of Uf, between 6.648 and 7.453 W/m²K (12%); as such, there is not much difference in thermal performance amongst these different commercial curtain wall systems
TASK 3—THERMAL OPTIMIZATION IN CURTAIN WALL DESIGN
REPORT A1-002844.03 14
representative of North American design. What can be stated is that the thermal performance of the North American curtain wall systems is not performing as that of the series representing the European curtain wall designs.
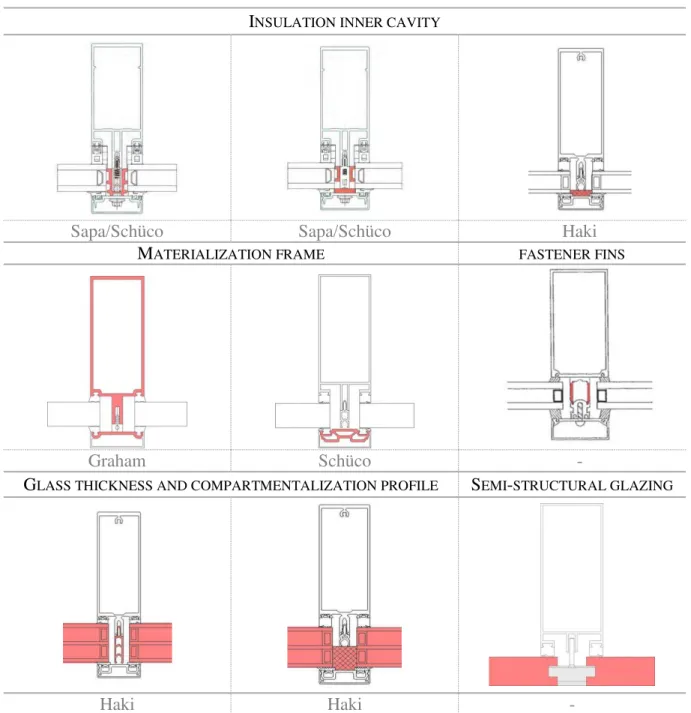
3.3 Thermal improvement of curtain wall systems
During the analysis of both European and North-American curtain wall systems, several options to improve the thermal performances of the frames could be discerned as indicated in Figure 6. Such improvements could be due to insulation provided to the inner cavity, due to changes to the
INSULATION INNER CAVITY
Sapa/Schüco Sapa/Schüco Haki
MATERIALIZATION FRAME FASTENER FINS
Graham Schüco -
GLASS THICKNESS AND COMPARTMENTALIZATION PROFILE SEMI-STRUCTURAL GLAZING
Haki Haki -
Figure 6 – Horizontal sectional details of commercial European and North American curtain wall systems highlighting locations and components to provide improvements in thermal performance
fastener fins, to changes in glass or spacer thickness or the use of semi-structural glazing. In § 5 the influence on thermal performance of different design features will be provided that includes: Width and depth of frame profile; length of fastener fins; position of the insulating glass units; distance between mechanical fixings; glass unit thickness, and; length of snap cover. In the subsequent section the development of generic curtain wall systems permitted comparing the thermal performance of European and North-American curtain wall frames.
4. Development of Generic Curtain Wall Systems
The development of a generic curtain wall system allows for an analysis that is independent of specific products and manufacturers. A generic model is representative of current building practice and allows for the implementation of all relevant thermal enhancements. In a first analysis, common techniques in curtain wall design were investigated and evaluated. The reference profile should act as a basis for further development and should leave sufficient room for improvement. Design parameters were chosen to be rather poor, creating possibilities for optimization.
• Profile lengths usually vary from 100 mm up to 300 mm. A representative length of 200 mm was chosen as a starting point, leaving room for increasing and decreasing the profile length. • The width of the curtain wall frame is commonly 50 or 60 mm. A representative width of
60 mm was chosen as a starting point, leaving room for increasing or decreasing the profile width.
• The glazing panel was chosen to be double glazed, resulting in an IGU width of 28 mm. • The outer point of the IGU was positioned just below the inner side of the gaskets. In this
way, the effect of positioning the IGU towards the inside and the outside of the frame could be investigated.
After a first analysis, it was evident that the length of the fastener fins could have a major effect on the overall thermal performance of the frame. The length of the fastener fins was chosen to be on the poor side (30 mm), as a result of which the influence of a decrease in length could be investigated.
After analyzing both European and North-American curtain wall systems, two generic curtain wall frames were proposed as shown in Figure 7.
4.1 European versus North-American generic curtain wall frame
Two systematic differences that are evident from analyzing a series of European and North-American curtain wall systems are: (i) the location of the interior gasket, and; (ii) the somewhat solid fastener connection. In European systems there is an additional member in the interior aluminum profile that secures the gasket in place, whereas in North-America the gasket is often
TASK 3—THERMAL OPTIMIZATION IN CURTAIN WALL DESIGN
REPORT A1-002844.03 16
Figure 7 – (a) European and (b) North-American generic curtain wall frame
installed directly into the aluminum structural member. Note that this difference in design does not originate from a thermal point of view, but from that of watertightness. Given that curtain walls are designed as drained and pressure equalized systems, the drainage plane is located at the back of the cavity between the IGU’s. During rain events, water reaches that plane and drains to the bottom and to the exterior by means of weep holes. Due to the use of pressure equalization, the larger portion of the wind gust loads will be transferred to the interior gaskets. Consequently, if some water does in fact infiltrate into the system and reach the back of the cavity, it will be subjected to significant driving forces to infiltrate into the interior.
In European systems the additional member that secures the gasket ensures that the gaskets are not located at the drainage plane. Moreover, in North-American systems the water will run down along the gasket of the mullion, and due to surface tension the water will be partly redirected horizontally where the vertical gasket connects with the horizontal gasket of the transom. It is well known in the industry that this specific location is the primary source of water leakage in laboratory test conditions as well as in practice.
To compare the thermal performance of generic curtain wall frames, simulations were performed to assess the (linear) thermal transmittance and the temperature index. The results of these simulations are provided in Table 2 it is evident that there is little difference can be discerned between frames; the North-American frame performs slightly better. Similar results are evident when simulating a generic European frame with a solid fastener fin connection; where the U-value only increased with 0.021 Wm²K.
Table 2 – Performance of generic curtain wall frames Uf [W/m²K] Ψ [W/mK] I [-] Europe 3.947 0.566 0.818 North-America 3.792 0.557 0.817
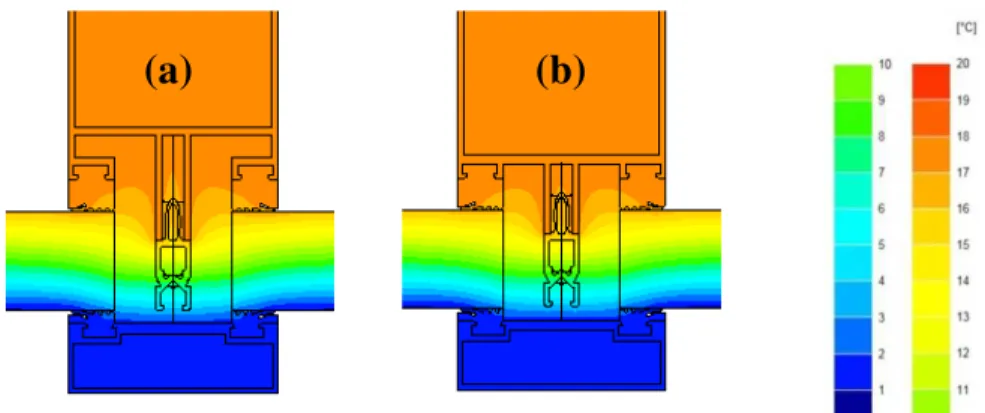
Figure 8 shows the temperature gradients over generic European and North American curtain wall frames, whereas Figure 9 shows the heat fluxes through both curtain wall frames. It can be seen that the profile member that holds the gasket, which is only present in the European frame, does not have a major influence on the heat loss. The lower Uf-value of the North-American frame can be linked to the shorter length of the fastener fins.
Figure 8 – Temperature gradient of generic curtain wall frames (a) European; (b) North-American The absence of the profile member holding the gaskets in the North-American reference frame, leads to different heat flux pathways in both frames (see Figure 9). A shorter fastener fin length results in less heat loss through these fins, although more heat will pass through the pressure plate below the outer gaskets. Similarly, the solid fastener connection does not have a significant impact on the heat fluxes through the curtain wall frame.
Figure 9 – Heat flux profile of generic curtain wall frames (a) European; (b) North-American
(a)
(b)
TASK 3—THERMAL OPTIMIZATION IN CURTAIN WALL DESIGN
REPORT A1-002844.03 18
4.2 Thermal transmittance: European versus North-American curtain wall frame
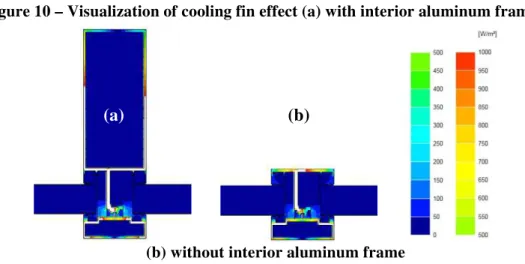
It was previously shown that the thermal transmittance of standard North-American curtain wall frames is consistently higher than the thermal transmittance of European curtain wall frames. When executing 1D simulations, the overall surface resistance would be equal to 0.04 + 0.13 = 0.17 m²K/W, resulting in a U-value of 5.88 W/m²K. Nevertheless, the 2D simulations show results of approximately 7 W/m²K. This difference is generated by discarding the material of influence in 1D simulations. In 2D simulations, the cooling fin effect results in an increase of thermal transmittance given that the most influential parameter for heat loss in highly conducting components is ∑ �� ∗ ���. A larger interior surface necessarily results in a higher U-value, because the interior heat transfer coefficient is in fact the bottleneck for the overall heat flux, whereas in typical building constructions this is the thermal resistance of the component itself; this can be visualized in Figure 10 in which the effect of the cooling fin is apparent. When discarding the interior aluminum frame, the U-value decreases from 7.344 to 5.274 W/m²K.
Figure 10 – Visualization of cooling fin effect (a) with interior aluminum frame and
(b) without interior aluminum frame
5. Thermal Performance Analysis of Curtain Wall Frames
A series of simulations were executed to analyze the influence on thermal performance of the design parameters shown in Figure 11 and Table 3. Boundary conditions that were simulated are: (1) profile width and (2) depth, (3) length of the fastener fins, (4) position of the insulating glass units, (5) influence of intermediate distance between mechanical fixings, (6) glass unit thickness and (7) length of the snap cover. Furthermore, the influence of the conductivity of fasteners and compartmentalization of profiles was also investigated. To achieve a thermally optimized curtain wall frame, several techniques to insulate the inner gasket were simulated and their results compared.
Figure 11 – Visualization of sensitive parameters Table 3 – Sensitive parameters
1 Profile width 6 Glass unit thickness 2 Profile length 7 Snap cover length 3 Length of the fastener fins 8 λ-value of fasteners 4 Position of the IGU 9 λ-value of
compartmentalization profile 5 Intermediate distance
between mechanical fixings 10 Insulating interior gasket
In Table 4 is a list of the materials used in the simulations and their respective conductivity (thermal conductivity). If this value was varied for a specific part of the parameter study in the simulations, the specific conductivities are given further in the report. The values reported in Table 4 originate from annex 1 of EN ISO 10077-2 [2].
Table 4 –Conductivity of materials
Material λ
[W/mK] Aluminum frame 160 Insulation panel (glass) 0.035
EPDM gaskets 0.25 Fiber Reinforced Polyamid
(compartmentalization profile) 0.3 Stainless steel (fastener) 17
TASK 3—THERMAL OPTIMIZATION IN CURTAIN WALL DESIGN
REPORT A1-002844.03 20
Output results from the simulations include values for the thermal transmittance of the frame (Uf), the linear thermal transmittance (ψ) and the temperature index (I). Results of the simulations are discussed below.
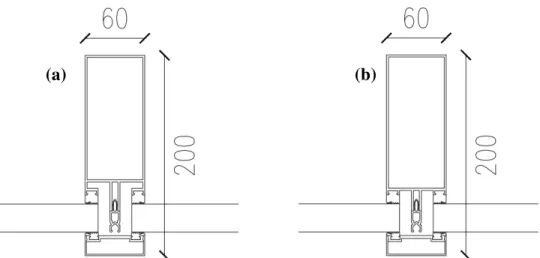
5.1 Profile width and length
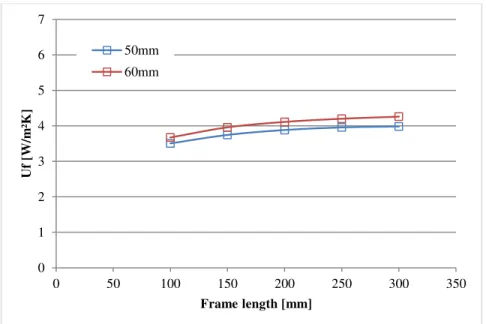
Firstly, the dimensions of the curtain wall frames are linked to its thermal performance. Figure 12 shows the varying parameters that were simulated; X1 indicates a change in profile width, X2 indicates a varying profile length. Simulation results for profile widths of 50 and 60 mm and profile lengths of 100, 150, 200, 250 and 300 mm are provided in Figure 13. From the results it is evident that the 50 mm profiles are accompanied by a slightly lower heat flux as compared to the 60 mm profiles. Similarly, if the depth of a profile increases the thermal performance decreases. Adding more material to a specific configuration typically reduces the heat flux and as such increases the thermal performance by increasing the thermal resistance. However, in the case of aluminum profiles the thermal conductivity of the aluminum is excessively high, which leads to the situation where the material itself is not the most important bottleneck for heat transfer, it is rather the heat transfer coefficient at the interior surface. By increasing the size of the interior aluminum profile, a larger surface area is generated, and the heat transfer from that component to the air is facilitated. The effect is rather similar to the design of cooling fins to facilitate heat transfer. The values vary between 3.5 and 4.5 W/m²K, and the lowest Uf-value is found for a curtain wall frame of 50 mm by 100 mm (the smallest one that was evaluated). In addition, it can be seen that the influence of the profile depth is reduced for increased size in depth of profile. For larger profiles an equilibrium for heat flux through the component is increasingly apparent and maximum heat loss at the interior side (defined by the convective and radiation heat transfer coefficient).
Figure 12 – Profile width and length
Figure 13 – Profile width and length
Figure 14 shows the temperature distribution in a typical curtain wall system of 60 mm wide and 100 mm long. The IGU’s are replaced by solid insulation panels. Another important fact is the absence of a temperature gradient in the interior and exterior aluminum profiles. The thermal conductivity of the aluminum is easily 1000 times higher than the conductivity of the air inside the cavities. As a result, any thermal resistance that may be found in the air in the cavities is simply thermally bypassed by the adjoining aluminum frame members.
Figure 14 – Temperature gradient profile for (a) 100m, (b) 200mm and (c) 300mm profile length and 60mm width
To obtain a better understanding of the thermal behavior of the complex geometry of the curtain wall systems, the heat flux density throughout the section is visualized as well. Figure 15 shows the most important pathways that conduct heat from the interior to the exterior. Given the symmetrical layout of the section, this symmetry is reflected in the reduced heat flux at the central axis of the profile. The high thermal conductivity of the aluminum is likewise evident: the highest heat fluxes can be found at the aluminum parts connecting the interior to the exterior.
0 1 2 3 4 5 6 7 0 50 100 150 200 250 300 350 U f [W /m ²K ] Frame length [mm] 50mm 60mm (a) (b) (c)
TASK 3—THERMAL OPTIMIZATION IN CURTAIN WALL DESIGN
REPORT A1-002844.03 22
Figure 15 – Heat flux profile for (a) 100m, (b) 200mm and (c) 300mm profile length and 60mm width
The fastener that is used to secure the pressure plate to the frame is modeled by means of very slender stainless steel continuous plate located in the center of the frame. Note that the slender plate is colored white in Figure 15: the heat flux density exceeds the scale limit at the right. For reasons of clarity, the flux scale was fixed at 1000 W/m² in the figure. Even though the fasteners do not necessarily make contact with the back of the tubular frame, in practice, this is superseded by the conductivity through the aluminum. Even if the fasteners do not make contact with the back of the frame, it only minimally affects the overall thermal performance. Throughout the parameter study the heat flux density is used to evaluate the effectiveness of specific optimization strategies.
5.2 Length of fastener fins
From Figure 15 it was evident that the two aluminum fins in the central space between the IGU’s are a very important heat flow pathway. It allows the fixation of the fastener that secures the pressure plate, and the width and depth are designed to accommodate the easy installation of fasteners. The thickness of the profile is determined by mechanical strength. Given that the interior and exterior aluminum profiles do not contribute to the overall thermal resistance, the thermal performance of the system basically depends on the configuration of the area between the IGU’s, and between the pressure plate and the onset of the aluminum fins. Consequently, an important step to improve the thermal performance consists of decreasing the length of the aluminum fins; the fin length is shown as parameter X in Figure 16. Fastener fins were simulated for lengths of 15, 20, 25, 30 and 35 mm. Results of the simulations on decreasing fastener fin length are shown in Figure 17 and Figure 18. It can be seen that a smaller fastener fin results in a lower Uf-value. It can be seen that from a certain point, the impact of reducing the fastener fins will stabilize and the influence on the thermal optimization will be negligible.
Figure 16 – Length of fastener fins
Figure 17 – Impact of length fastener fins
Figure 18 – Temperature gradient profile of fastener fins (a) 15mm, (b) 25mm, (c) 35mm In Figure 19, one can easily see that the isotherms are significantly affected by a change in length of the fastener fins for a given configuration of 60 mm width and 200 mm length. Not only the inner part of the aluminum frame is influenced by the length of the fastener fin; the snap cover is affected as well. Longer fastener fins result in more heat loss through the pressure plate bordering the outer gaskets.
(a) (b) (c) 0 1 2 3 4 5 6 7 0 5 10 15 20 25 30 35 40 Uf [ W /m² K ]
TASK 3—THERMAL OPTIMIZATION IN CURTAIN WALL DESIGN
REPORT A1-002844.03 24
Figure 19 – Heat flux profile of fastener fins of (a) 15mm, (b) 25mm, (c) 35mm
5.3 Position of the glass units
As discussed in the previous section, the thermal performance depends primarily on the configuration of the frame between the IGU’s, and between the pressure plate and the aluminum fins. Given that the thermal resistance of that zone is typically significantly lower than that of the IGU’s, one might consider increasing the height and width of the IGU panels. The distance between the glass unit and the fastener fins should be at least 5 mm to ensure a proper drainage of the system, and allow for a practical installation and on site adjustments. On the other hand, there is a minimum contact length between the IGU and gasket as well, for a reliable mechanical contact with the frame to transfer wind loads to the secondary and primary structure. Next to that, from an esthetical point of view the non-transparent edge seal is typically completely covered by the pressure plate. Note that when the IGU is inserted too far into the curtain wall system, the difference in solar exposure of the IGU at the edge increases the risk for thermal breakage of the glass panels. The effect of the IGU spacer is taken into account separately in the normative documents. Figure 20 shows the varying position of the glass unit (X1) and the minimum distance of 7 mm between the glass unit and the fastener fins (X2).
In Figure 21, the position of the glass unit is expressed as opposed to the position of the gaskets. In the simulations, results of which are given in Figure 22, the edge of the IGU was respectively placed 5 mm to the left, central (similar to the reference case) and placed 5 mm to the right. It can be seen that the position of the glass unit as compared to the gaskets has a distinct influence on the thermal performance of the curtain wall frame.
Figure 20 – Position of the glass unit
Figure 21 – Position of the glass units
The increased IGU size narrows the area of the curtain wall where excess heat loss may be found and results in a lower Uf-value of the frame. Hence, this parameter should be considered when comparing different systems with their respective thermal performance. A slight change of IGU size by 5 mm can easily change the thermal performance by 15%.
Figure 22 – Temperature gradient profile for varying IGU positions: (a) -5mm; (b) 0mm, and; (c) +5mm
The temperature gradient that is evident in the air space of the interior aluminum frame does not affect the aforementioned conclusion that the interior frame does not contribute to the overall thermal resistance. Due to the adjusted IGU size the overall performance has changed, leading to a different temperature distribution, and it has led to a shift of the isothermal line that is now running through the profile.
In Figure 23 it can be seen that the position of the IGU mostly affects the heat loss through the inner aluminum frame and the fastener fins; the impact on the snap cover is limited.
0 1 2 3 4 5 6 7 -6 -4 -2 0 2 4 6 Uf [ W /m² K ]
Position glass units [mm]
(b)
TASK 3—THERMAL OPTIMIZATION IN CURTAIN WALL DESIGN
REPORT A1-002844.03 26
Figure 23 – Heat flux profile of IGU positioned towards the inner cavity: (a) -5 mm; (b) 0 mm; (c) +5 mm
Table 5 shows the influence of varying the IGU position on the thermal transmittance. Table 5 – U-values for varying IGU positions
Configuration a Configuration b Configuration c Uf [W/m²K] 4.481 3.958 3.434
5.4 Spacing between fasteners
In practice the pressure plate is fixed to the structural member by means of fasteners every 150 mm up to 300 mm. The distance between the fasteners is set by the maximum loads that the fasteners need to transfer. In turn, this is determined by the size of the IGU, the aspect ratio (height/width of the IGU), and maximum wind loads (suction). Peak negative pressures of building façades are typically higher than the peak positive pressures. The mechanical fixation of the pressure plate also generates a number of secondary effects. First of all, by increasing the pressure a specific effect may arise similar to structural glazing: stress in the glass panes get transferred to the aluminum profiles. Secondly, due to the elastic behavior of the gasket and their low elastic modulus, it is very difficult to acquire a uniform stress on the gasket over the length of the mullion or transom. Most European system manufacturers mention that a specific torque should be applied for the installation of the fasteners. In contrast, on construction sites cordless electrical fastener drivers are used instead of a torque wrench. Even when a torque wrench is used, it typically takes 3 or 4 iterations of adjusting individual fasteners to acquire a uniform torque and pressure within a 10% variance limit. As a result of
Figure 24 – Spacing between screws
(b)
these considerations, the number of fasteners incorporates major safety factors to account for uncertainties that arise in practice.
To evaluate the influence of the mechanical fixings, the distance in between the fasteners was varied from 150 mm up to 300 mm. A visualization of the intermediate fastener distance (X) is shown in Figure 24. Assuming a spacing of 250 mm and a conductivity of 17 W/mK as a reference case, the equivalent conductivity of the fastener in the simulations was changed in proportion to the specific intermediate distance; the values for spacing and corresponding conductivity are given in Table 6 and plotted in Figure 25. For an increase in spacing between fasteners, less material will be available through which heat can pass resulting in a decreasing conductivity of the fastener, and a decreasing Uf-value for an increasing intermediate distance.
Figure 25 – Thermal transmittance as a function of fastener spacing
5.5 Glass unit thickness
As discussed in previous sections, only the space between the IGU’s, pressure plate and aluminum fins contributes significantly to the thermal resistance of the frame. This might be optimized by increasing the thickness of the IGU panels, which will lengthen the pathway and reduce the thermal transmittance.
Figure 26 shows a curtain wall configuration in which the sensitivity of the glass unit thickness X on the overall U-value is assessed. Figure 27 shows the influence of the unit thickness of the glazing on the thermal transmittance of the frame. Increasing the thickness (20, 28, 36, 44, 52, and 60 mm) has a major influence on the thermal performance of the frame, showing that triple glazing can definitely contribute to the thermal optimization in curtain wall design. Due to the large difference in thermal transmittance of the Table 6 – conductivity of the fasteners Spacing [mm] λ [W/mK] 150 28.33 200 21.25 250 17.00 300 14.17
Figure 26 – Glass unit thickness 0 1 2 3 4 5 6 7 0 100 200 300 400 Uf [ W /m² K ]
TASK 3—THERMAL OPTIMIZATION IN CURTAIN WALL DESIGN
REPORT A1-002844.03 28
IGU and the frame, the geometry of the IGU relative to the frame has a very large effect of the thermal performance. Similar to the width and height of the IGU, the thickness of the IGU should always be considered when different systems are compared. In the simulations, no modifications were made to the frame when altering the thickness of the glazing units. In Figure 27, it can be seen that by simply replacing a narrow double glazing by deeper triple glazing, the thermal transmittance of the frame can be reduced by half. This only accounts for the frame; the U-value of the IGU (center or edge) was not considered.
Figure 27 – Thermal transmittance as a function of unit thickness of glazing
the influence of the IGU thickness is shown in relation to the: (i) temperature gradientacross the curtain wall frame in Figure 28, and; (ii), heat flux profiles across the frame in Figure 29. In the simulations, all characteristics of the aluminum frame were maintained; only the IGU thickness was changed.
Figure 28 – Temperature gradient profile for (a) 28mm, (b) 44mm and (c) 60 mm glass thickness
0 1 2 3 4 5 6 7 0 10 20 30 40 50 60 70 Uf [ w /m² K ]
Glass unit thickness [mm]
Figure 29 – Heat flux profile for (a) 28mm, (b) 44mm and (c) 60 mm glass thickness
5.6 Thermal conductivity(Λ)of fasteners and compartmentalization profile
Figure 30 shows the influencing construction parts of which the λ-value were varied for the simulations described below. In previous sections, the impact of the fasteners and spacing of the fasteners on the overall thermal performance of the system was highlighted. In practice, fasteners are stainless steel or galvanized steel. Figure 31 shows that this choice in fastener material already changes the thermal transmittance by 1 W/m²K. As a calculation example, the following materials are considered: rigid polymers (λ-value typically 0.3 W/mK), different types of stainless steel (λ-value 14, 15, 16, 17, 18 W/mK), steel (λ-value 50 W/mK) and aluminum (λ-value 160 W/mK).
Figure 31 indicates that once the thermal conductivity approaches that of the adjoining materials and air cavities, the relative impact decreases. Although the stainless steel fasteners are now considered state-of-the-art, the adoption of, e.g., fiber reinforced fasteners would further reduce the transmittance. Note that carbon fiber reinforced anchors are increasingly used in precast industrial concrete sandwich panels, which already indicates that the material is starting to become more popular in the building industry. Similarly, the thermal conductivity of the compartmentalization profile has an impact on the overall performance. Values for λ of the compartmentalization profile that are considered were: 0.1, 0.2, 0.28, 0.3 and 0.4 W/mK. In this case, a decrease in the conductivity only induced a minor decrease in thermal transmittance.
Figure 30 – Varying conductivity
TASK 3—THERMAL OPTIMIZATION IN CURTAIN WALL DESIGN
REPORT A1-002844.03 30
Figure 31 – Conductivity of different fastener and compartmentalization profile materials
0 1 2 3 4 5 6 7 0 0.05 0.1 0.15 0.2 0.25 0.3 0.35 0.4 0.45 Uf [ W /m² K ] λ compartmentalization [W/mK] 0 1 2 3 4 5 6 7 0.1 1 10 100 1000 Uf [ W /m² K ] λ fastener [W/mK] Polymers Stainless steel Aluminum Galvanized steel
5.7 Snap cover length
Previous simulations revealed that the pressure plate and snap cover had only a minor influence on the overall thermal performance of the curtain wall frame. To investigate whether or not a variation in length of the snap cover has an effect on the thermal transmittance, simulations were executed for snap cover lengths of 13.5, 18.5, 23.5, 28.5 and 33.5 mm, as represented in Figure 32 by the parameter X.
The aforementioned statement is confirmed by the information provided in Figure 33 and shows that the snap cover length had a minor influence on the thermal performance of the frame. A decrease of 20 mm in snap cover length only decreased the thermal transmittance by 0.1 w/m²K. The minor thermal influence of the snap cover on the overall thermal performance is due to a higher value for the exterior heat transfer coefficient (although the snap cover has a limited surface, this is compensated by the high convective heat transfer coefficient).
Figure 33 – Length snap cover
Figure 34 shows that changing the length of the snap cover has only a minor influence on the thermal transmittance for a given frame configuration of 60 mm width. The length of the inner aluminum frame was not changed during these simulations.
Figure 32 – Snap cover length 0 1 2 3 4 5 6 7 0 5 10 15 20 25 30 35 40 45 U f [W /m ²K ]
![Figure 1 – Schematics of cavities; From left to right—H-cavity, L-cavity, and the C-cavity and definitions of cold and hot surfaces and dimensions [6]](https://thumb-eu.123doks.com/thumbv2/123doknet/14087661.464303/20.918.128.803.661.921/figure-schematics-cavities-cavity-cavity-definitions-surfaces-dimensions.webp)
![Table 1 – Simulation results of fasteners in BISCO, TRISCO and SOLIDO Q [W/m] Q [W] U f [W/m²K] Difference % Frame without fastener](https://thumb-eu.123doks.com/thumbv2/123doknet/14087661.464303/26.918.115.788.362.966/table-simulation-results-fasteners-trisco-solido-difference-fastener.webp)