Publisher’s version / Version de l'éditeur:
Vous avez des questions? Nous pouvons vous aider. Pour communiquer directement avec un auteur, consultez la
première page de la revue dans laquelle son article a été publié afin de trouver ses coordonnées. Si vous n’arrivez pas à les repérer, communiquez avec nous à [email protected].
Questions? Contact the NRC Publications Archive team at
[email protected]. If you wish to email the authors directly, please see the first page of the publication for their contact information.
https://publications-cnrc.canada.ca/fra/droits
L’accès à ce site Web et l’utilisation de son contenu sont assujettis aux conditions présentées dans le site LISEZ CES CONDITIONS ATTENTIVEMENT AVANT D’UTILISER CE SITE WEB.
Greening Rooftops for Sustainable Communities [Proceedings], pp. 1-11,
2005-05-01
READ THESE TERMS AND CONDITIONS CAREFULLY BEFORE USING THIS WEBSITE.
https://nrc-publications.canada.ca/eng/copyright
NRC Publications Archive Record / Notice des Archives des publications du CNRC :
https://nrc-publications.canada.ca/eng/view/object/?id=e10a2c46-5c45-4a9e-8625-d7b0ea46e847 https://publications-cnrc.canada.ca/fra/voir/objet/?id=e10a2c46-5c45-4a9e-8625-d7b0ea46e847
NRC Publications Archive
Archives des publications du CNRC
This publication could be one of several versions: author’s original, accepted manuscript or the publisher’s version. / La version de cette publication peut être l’une des suivantes : la version prépublication de l’auteur, la version acceptée du manuscrit ou la version de l’éditeur.
Access and use of this website and the material on it are subject to the Terms and Conditions set forth at
Performance evaluation of an extensive green roof
Performance evaluation of an extensive green roof
Liu, K.; Minor, J.
NRCC-48204
A version of this document is published in / Une version de ce document se trouve dans :
Greening Rooftops for Sustainable Communities, Washington, D.C.,
May 5-6, 2005, pp. 1-11
Performance Evaluation of an Extensive Green Roof
∗ Karen Liu, John MinorNational Research Council of Canada / City of Toronto
ABSTRACT
This study aims to provide technical data on the performance of green roofs in the City of Toronto, and to illustrate their benefits in an urban context. Two extensive green roof systems were installed on a community centre in Toronto. Both systems contained the same components that differed in materials and designs. The green roofs contained lightweight growing medium, 75 - 100 mm in depth, that supported a variety of vegetation. The green roofs, and a reference roof, were instrumented to provide thermal performance and energy efficiency data, as well as runoff measurements. Although the vegetation was not well established in the first year of monitoring, nevertheless, the extensive green roofs reduced the building’s energy demand by lowering the heat flow through the roof, especially in the summer. The green roofs were shown to be effective in delaying and reducing stormwater runoff and the retention efficiency depended upon the characteristics of the rain event (intensity and amount) and the wetting history of the growing medium. Preliminary observations and membrane temperatures recorded also suggest that green roofs could likely improve membrane durability by reducing heat aging, thermal stresses, ultra-violet radiation and physical damages.
Background of the Study
The City of Toronto, Ontario, is the largest municipality in Canada, with a population of about 2.5 million. Like other urban centres in North America, Toronto is facing various environmental challenges including poor air quality, urban heat island effects and stormwater management issues. The City of Toronto is committed to make the city “clean, green and healthy”. It has established a Roundtable on the Environment, which serves as a forum for information sharing, idea exchange, and the promotion of innovation on environmental sustainability. One of the main issues is to examine the benefits of green roofs to the City and discuss policies and incentives to encourage green roof implementation in the city. The City initiated a 2 year study in 2004 (“Municipal Cost Savings Benefit of Green Roofs”) to examine the quantifiable environmental and social benefits particular to the local environment and climate.
In 2002, the National Research Council and the City of Toronto collaborated to conduct a multi-year study on green roof technology, with additional financial support from the Technology Early Action Measures (TEAM) and the Great Lakes Sustainability Fund. The main objective of the project is to provide local thermal and stormwater runoff data to assist with the evaluation of potential benefits of green roof technology in the City of Toronto. In this study, the National Research Council instrumented an extensive green roof on the Eastview Neighbourhood Community Centre in Toronto to quantify its thermal performance . The City of Toronto installed magnetic flowmeters to measure the roof runoff. Stormwater quality was not tested during this phase of work. This paper will discuss the initial observations and findings of this study.
Experimental Method
∗
The Eastview Neighbourhood Community Centre is situated in a neighbourhood of low-rise residential and commercial buildings, in the City of Toronto. The green roof was established on
top of the gymnasium, which has a low slope industrial roof. The 460m2 roof area was divided
length-wise into two sections where two extensive green roof systems were installed. The roof of the adjacent mechanical room was used for reference purpose.
The green roof installation was done in several stages due to administrative logistics. Various sensors were first embedded in the roofing systems in May 2002. The green roof systems were then installed in late July 2002 and sowed with seeds. Due to slow plant growth, the vegetation coverage was low (about 5%) during the first year of monitoring. The data will provide a baseline comparison for future analysis when the plants have established higher foliage density.
The roofs of the gymnasium and the adjacent mechanical room (Reference Roof) consisted of steel deck, gypsum board, vapor retarder, thermal insulation, fibreboard and modified bituminous membrane. Green Roof System G consists of a composite semi-rigid polymeric drainage and filter mat and a root-anchoring mat. It has 100 mm of lightweight growing medium containing small light-colored granules. Green Roof System S consists of expanded polystyrene drainage panels and a geotextile filter fabric. It has 75 mm of lightweight, dark-colored growing medium containing porous ceramic granules.
The three roof sections were instrumented to measure the temperature profile within and heat flow across the roofing system, microclimate created by the vegetation and stormwater runoff. A weather station was installed on the rooftop to monitor atmospheric conditions. The roof drainage system was retrofitted such that runoffs from the three roof sections are directed into individual magnetic flowmeters for measurement. All sensors were connected to a data acquisition system, which can be remotely accessed via a modem, for continuous monitoring. Figure 1 shows the major components of the roofing systems and the instrumentation locations.
Figure 1 Schematics showing the principle components and the sensor locations within
the roofing systems: Green Roof S, Reference Roof and Green Roof G. Thermocouple
Instrumentation Heat Flux Transducer Relative Humidity Sensor Soil Moisture Sensor
Green Roof System “S”
S1, S2 and S3 G1, G2 and G3
(S1 only) (G1 only)
Green Roof System “G” Reference Roof Growing Medium Drainage Layer Filter Layer Roof Membrane Steel Deck Vegetation Fibreboard Thermal Insulation Gypsum Board Vapour Barrier Growing Medium Drainage/Filter Layer Root Anchoring Layer
Roof Membrane Steel Deck Vegetation Fibreboard Thermal Insulation Gypsum Board Vapour Barrier E5 Layer E4 E3 E1 E0 E2
Results and Findings
Thermal data collection started in May 2002; stormwater data collection started in March 2003. Note that the vegetation coverage was minimal during the observation period, therefore the thermal and stormwater runoff performance observed was due mainly to the growing medium. The network of thermocouple measured the temperature profile while the heat flux transducers (HFT) recorded the heat flow across the roofing systems. The HFT were calibrated such that a positive reading represents heat entering the building while a negative reading shows heat leaving the building. The heat flow across the roofing system depends on the thermal performance of the roofing system, and other factors such as the difference between indoor and outdoor temperatures, snow coverage and solar radiation.
Temperature and Heat Flow Profile Examples
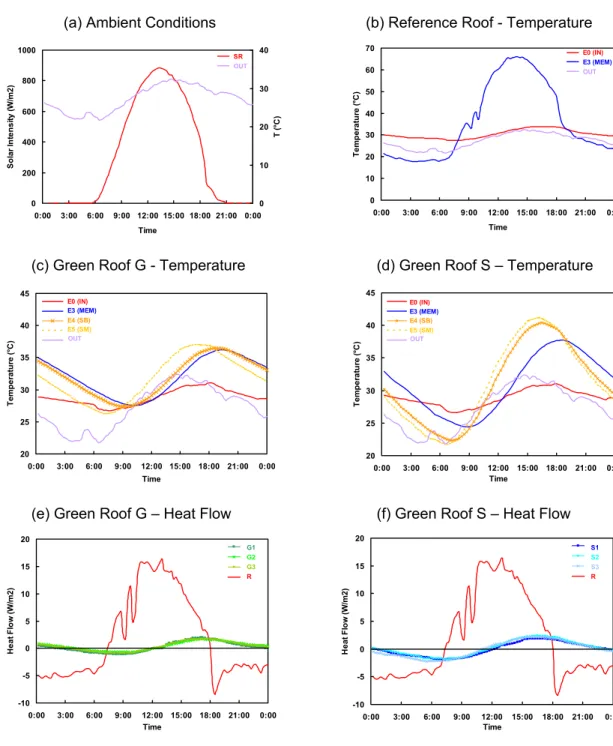
Summer: Figure 2 shows the temperature and heat flow profiles within the roofing systems on
a typical summer day. The roof membrane on the Reference Roof absorbed solar energy and its temperature rose to 66°C at around 14:00 (Figure 2b). The green roofs significantly lowered the roof membrane temperature and delayed the peak (Figure 2c-d). The roof membrane temperature peaked at 38°C at 18:30 for Green Roofs S and 36°C at 19:30 for Green Roof G. Figure 2e-f show the heat flow across the roofing systems. Heat started to enter the building through the Reference Roof not long after sunrise (around 06:00), reaching a maximum
intensity of about 15 W/m2 and continued until the evening before sunset (around 18:00), at
which time heat gain changed to heat loss. The Green Roofs significantly reduced the heat flow
(both gain and loss) through the roofing systems to a peak intensity of less than 2.5 W/m2. Note
that both Green Roofs lost heat in the morning and did not start to gain heat until the afternoon. The green roofs had effectively delayed/reduced heat transfer through the roofing systems. Green Roof G has deeper and lighter coloured growing medium (100 mm) than Green Roof S (75 mm). The temperature of the growing medium in Green Roof S rose higher and more quickly (Figure 2c-d). Heat flow data confirmed that Green Roof G exhibited slightly lower heat gain/loss across the roofing system than Green Roof S (Figure 2e-f). Since there was little contribution from the vegetation, these observations indicate that the deeper growing medium in Green Roof G improved the thermal performance of the green roof system in the summer.
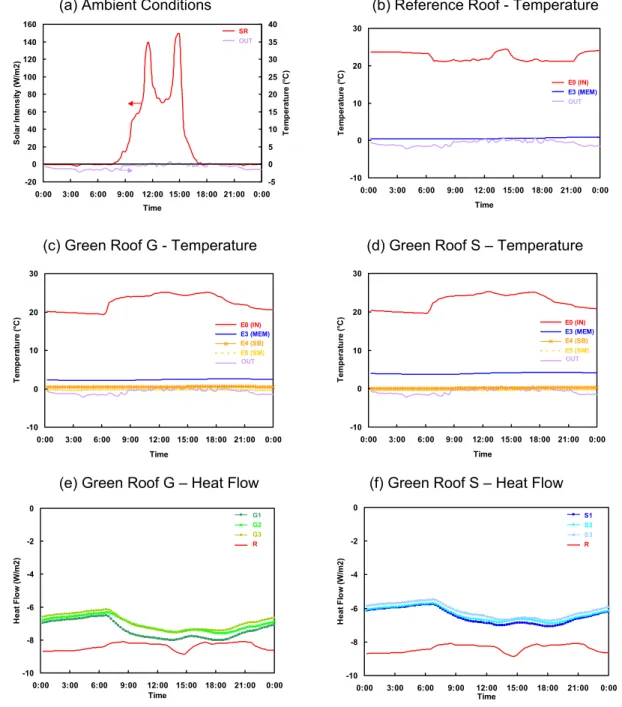
Winter: Figure 3 shows the temperature profile within the roofing systems on a typical winter
day with light snow coverage (less than 25 mm). The roof membrane temperature on the Reference Roof was stable at around 0°C throughout the day (Figure 3b). The growing media in the two green roofs were frozen, as indicated by the growing medium temperature (E4 and E5) (Figure 3c-d). Note that the indoor temperature under the Green Roofs was cooler in the early evening but warmer during the day, due to the operational needs of the gymnasium compared to the more stable indoor temperature in the mechanical room under the Reference Roof. Figure 3e-f shows the heat flow across the roofing systems. All three roof sections lost heat throughout the day. The Reference Roof lost heat at a relatively steady rate of about 8 –
9 W/m2 due to the snow coverage. The Green Roofs reduced the heat loss from the building to
about 6 – 8 W/m2. Note that the slight increase in heat loss during the day was due to the
Figure 2 Temperature and heat flow profiles of the roof sections on a typical summer day (June 26, 2003). Refer to Figure 1 for locations of sensors. Note that the temperature scale of the green roofs have been expanded for clarity in (c) and (d).
Although Green Roof G has deeper growing medium (100 mm) than Green Roof S (75 mm), the growing medium was frozen and did not contribute extra insulation to the roofing system in the winter. However, the polystyrene drainage panel in Green Roof S provided extra insulation value compared to the semi-rigid polymeric drainage mat in Green Roof G, as indicated by the roofing membrane temperatures: 4°C and 2.5°C for Green Roof S and Green Roof G, respectively. Heat flow data confirmed that Green Roof S lost less heat compared to Green
030626, WS-T, SR 0 200 400 600 800 1000 0:00 3:00 6:00 9:00 12:00 15:00 18:00 21:00 0:00 Time S o la r In te n s it y ( W /m 2 ) 0 10 20 30 40 T ( °C ) OUT SR 030626, TC-R 0 10 20 30 40 50 60 70 0:00 3:00 6:00 9:00 12:00 15:00 18:00 21:00 0:00 Time Tem p er a tur e ( °C ) OUT E3 (MEM) E0 (IN) 030626, TC-G2 20 25 30 35 40 45 0:00 3:00 6:00 9:00 12:00 15:00 18:00 21:00 0:00 Time T e m p er a tur e ( °C ) Series1 Series4 Series5 Series6 Series7 E3 (MEM) E0 (IN) E5 (SM) E4 (SB) OUT 030626, TC-S2 20 25 30 35 40 45 0:00 3:00 6:00 9:00 12:00 15:00 18:00 21:00 0:00 Time Tem p er at u re ( °C ) Series1 Series4 Series5 Series6 Series7 E3 (MEM) E0 (IN) E5 (SM) E4 (SB) OUT 030626, HFT-G -10 -5 0 5 10 15 20 0:00 3:00 6:00 9:00 12:00 15:00 18:00 21:00 0:00 Time H eat Fl ow ( W /m 2) Series1 Series2 Series3 Series4 G2 G3 R G1 030626, HFT-S -10 -5 0 5 10 15 20 0:00 3:00 6:00 9:00 12:00 15:00 18:00 21:00 0:00 Time H e a t Fl ow ( W /m 2 ) Series1 Series2 Series3 Series4 S2 S3 R S1
(a) Ambient Conditions (b) Reference Roof - Temperature
(c) Green Roof G - Temperature (d) Green Roof S – Temperature
Roof G – at a rate of 1 W/m2 consistently throughout the day, again confirming the insulation value of the polystyrene drainage panel in Green Roof S.
Figure 3 Temperature and heat flow profiles of the roof sections on a typical winter day with light snow coverage of less than 25 mm (January 5, 2003).
Temperature and Energy Statistics
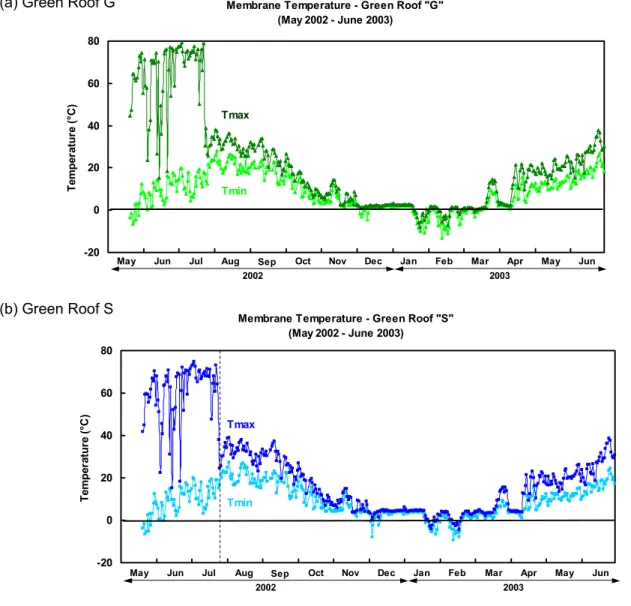
Membrane Temperature and Diurnal Fluctuation: Figure 4 shows the daily temperature
extremes experienced by the roof membrane under the Green Roofs in the first year of monitoring. Before the green roofs were installed (later July 2002), the exposed roof membrane
030105, WS-T, SR -20 0 20 40 60 80 100 120 140 160 0:00 3:00 6:00 9:00 12:00 15:00 18:00 21:00 0:00 Time S o la r In te n s it y (W /m 2 ) -5 0 5 10 15 20 25 30 35 40 Tem p e rat ur e ( °C ) OUT SR 030105, TC-R -10 0 10 20 30 0:00 3:00 6:00 9:00 12:00 15:00 18:00 21:00 0:00 Time Tem p e rat ur e ( °C ) OUT E3 (MEM) E0 (IN) 030105, TC-G2 -10 0 10 20 30 0:00 3:00 6:00 9:00 12:00 15:00 18:00 21:00 0:00 Time Tem p er at u re ( °C ) Series1 Series4 Series5 Series6 Series7 E3 (MEM) E0 (IN) E5 (SM) E4 (SB) OUT 030105, TC-S2 -10 0 10 20 30 0:00 3:00 6:00 9:00 12:00 15:00 18:00 21:00 0:00 Time Te m p e ra tur e ( °C) Series1 Series4 Series5 Series6 Series7 E3 (MEM) E0 (IN) E5 (SM) E4 (SB) OUT 030105, HFT-G -10 -8 -6 -4 -2 0 0:00 3:00 6:00 9:00 12:00 15:00 18:00 21:00 0:00 Time H e a t Fl ow ( W /m 2) Series1 Series2 Series3 Series4 G2 G3 R G1 030105, HFT-S -10 -8 -6 -4 -2 0 0:00 3:00 6:00 9:00 12:00 15:00 18:00 21:00 0:00 Time H e a t Fl ow ( W /m 2 ) Series1 Series2 Series3 Series4 S2 S3 R S1
(a) Ambient Conditions (b) Reference Roof - Temperature
(c) Green Roof G - Temperature (d) Green Roof S – Temperature
absorbed solar energy during the day and its temperature rose. The daily maximum membrane temperature reached over 70°C for Green Roof S (light grey coloured membrane), and close to 80°C for Green Roof G due to the dark coloured membrane. After the green roof systems had been installed, the daily maximum membrane temperature dropped significantly – by about 30°C for Green Roof S (light coloured) and about 40°C for Green Roof G (dark coloured).
Figure 4 Daily maximum and minimum membrane temperatures on the green roofs. The green roofs were installed late July 2002, as marked by the dotted line on the graphs.
The green roofs also reduced the difference between the daily maximum and minimum temperatures (the diurnal temperature fluctuation) experienced by the roof membrane: from over 50°C to about 10°C, after green roof installation in late July during summer 2002 (Figure 4). High temperature accelerates the ageing process while diurnal temperature fluctuations create thermal stresses in the roof membrane, thus affecting its long-term performance. The green roofs reduced the temperature and fluctuations experienced by the roof membrane, thus
Membrane Temperature - Green Roof "G" (May 2002 - June 2003) -20 0 20 40 60 80 T e mp er at u re ( °C ) Tmax Tmin
May Jun Jul Aug Sep Oct Nov Dec Jan Feb Mar Apr May Jun
2002 2003
Membrane Temperature - Green Roof "S" (May 2002 - June 2003) -20 0 20 40 60 80 T e mp er at u re ( °C ) Tmax Tmin
May Jun Jul Aug Sep Oct Nov Dec Jan Feb Mar Apr May Jun
2002 2003
(a) Green Roof G
contributing positively to its durability. The daily membrane temperature extremes were minimal in the winter due to snow coverage.
Heat Flow and Energy Demand: Assuming the temperature inside the building was to be kept
constant, then any heat flow between a building and its environment creates energy demand for space conditioning. Therefore, the energy demand for space conditioning due to the roof can be estimated by the sum of the heat entering and leaving through the roof. The heat flow through the roof was obtained by integrating the heat flux over time or computing the area under
the heat flux curve (kWh/m2/day). The daily heat flow through the roof section was further
averaged over each month to smooth out day-to-day variations.
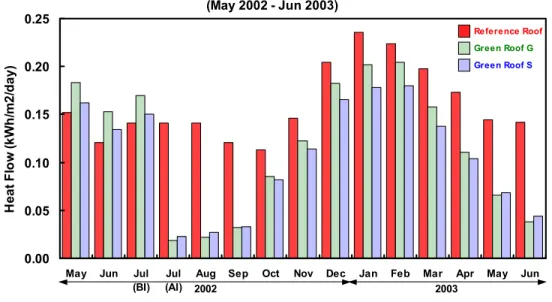
The normalized average daily heat flow through the roof sections over the observation period are summarized in Figure 5. Note that the roof membranes on the three roof sections were bare during May – July 2002 before the green roofs were installed. The Green Roofs consistently reduced the average daily heat flow through the roof throughout the year – more in the summer (70-90%) and less in the winter (10-30%). This again confirmed that extensive green roofs could improve the energy efficiency of the roofing system, particularly effectively in reducing heat gain in the summer. In the first year of monitoring, the green roofs reduced the total annual heat gain through the roof by 95% but the heat loss by only 23%.
Figure 5 Comparison of the average daily heat flow through the green roofs and reference roof. Note that the green roofs were installed late July 2002 (BI = before installation of green roof, AI = after installation of green roof).
Green Roof G was more effective in reducing heat gain in the summer. Green Roof G has a deeper growing medium (100 mm) compared to Green Roof S (75 mm). Figure 5 shows that in the warmer months (August – September, 2002 and May – June 2003), the heat flow through Green Roof G was slightly less (about 3%) less than Green Roof S. The extra growing medium
Average Daily Heat Flow Through Roof Surfaces (May 2002 - Jun 2003) 0.00 0.05 0.10 0.15 0.20 0.25
May Jun Jul
(BI) Jul (AI)
Aug Sep Oct Nov Dec Jan Feb Mar Apr May Jun
H eat Fl o w ( k W h /m 2/ day) Green Roof G Green Roof S 2002 2003 Reference Roof
Figure 6 Piping and MAGmeter layout provided higher insulation, thermal mass and retention of moisture for evaporative cooling to reduce heat gain in the summer.
Green Roof S was more effective in reducing heat loss in the winter due to the extra insulation value of the expanded polystyrene drainage panel. Figure 5 shows that in the colder months (October – April, 2002), the heat flow through Green Roof S was less (about 10%) than Green Roof G. The insulation value of the growing medium diminished as it became frozen in the winter but the expanded polystyrene drainage panel in Green Roof S provided extra insulation and improved the system’s energy efficiency in the winter.
Note that the analysis was based solely on heat flow through the roofs; it did not take into account of heat flow through the other parts of the building envelope (e.g. walls and windows), which could contribute a much higher fraction of the energy demand of the whole building. Also, the actual dollar saving depends on the type and efficiency of the heating and cooling equipment and the heating/cooling distribution systems, which are building specific.
Stormwater Runoff Monitoring
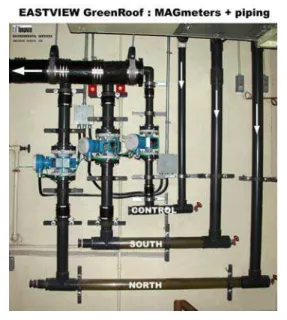
Drainage pipes from the three roof plots were separated from each other under the roof deck.
All three pipes ( original 6 inch for each of the 200 m2 test plots; 4 inch for the 100 m2 control
roof) were diverted to the adjacent mechanical room where individual flow meters were installed in each pipe (Figure 6).
The flow meters chosen for this application were magnetic induction instruments (MAGmeters). They provided minimal flow restriction compared to positive displacement meters, and provided an output signal of 4-20ma current loop which was fed to a data acquisition system. Rainfall was measured using a “tipping-bucket” rain gauge mounted between the two test plots. All data was collected and recorded on a 1-minute time interval.
The sizing of the MAGmeters was conservatively chosen to provide maximum resolution at low flows, yet avoid peak flow restrictions, which might cause back-ups and ponding on the roof. Each test plot received a 3” Endress and Hauser ‘Promag’ meter having a maximum flow of 100 US gal/min. The
smaller control roof received a 2½” Promag meter
having a maximum flow of 50 US gal/min. Post installation calibration verified the accuracy to be better than ± 2%.
The maximum flow rate measured over a two year
time period never exceeded 28.5 US gal/min for either size of meter (maximum rainfall intensity measured was 12.2 mm/5 min interval). No restrictions, blockages or back-ups were detected. It was concluded that in the future, the meter size could be safely reduced for the test plots to achieve improved low flow accuracy.
Stormwater Runoff Results
A reduction in runoff volume and/or runoff flow rate from the test plots, compared to the control roof, was expected. Such reductions could benefit stormwater management on both a lot-level and on a municipal sewershed basis.
Flow volumes, from both test plots, provided an average annual reduction of 57% compared to the control roof.
Maximum volume reduction (on an event by event basis) occurred during summer months when 100% reduction was achieved for certain rain events that totalled less than 15mm , and that were preceded by six days of dry weather. Both test plots behaved similarly during these conditions, however, the SOUTH plot (Roof S) exhibited less of a reduction as the interceding dry period became shorter. During the typically wet spring and fall conditions, the NORTH plot (Roof G) consistently exhibited a reduction in volume, while the SOUTH plot (Roof S) periodically saturated and responded similar to the control roof. This may be the result of the thinner growing medium on the SOUTH plot (Roof S).
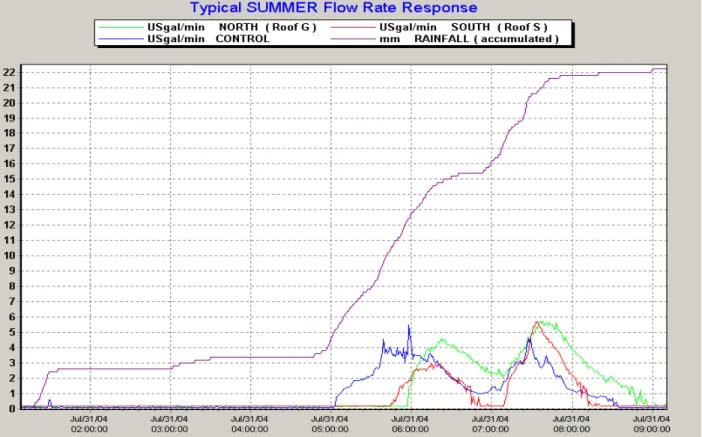
Flow rates, from both test plots, were significantly reduced during all seasons compared to the control roof. Flow rates from the test plots during summer (Figure 7) typically showed a lag time (detention time) of 20 to 40 minutes, with a calculated peak flow rate reduction of 25% to 60%
(when adjusted on a per m2 basis).
Figure 7 Typical SUMMER Flow Rate Response to an 18.8 mm rain event following 10 days of dry weather . Note that the Y axis shows the runoff in US gal/minute; the rainfall is shown as mm (accumulated).
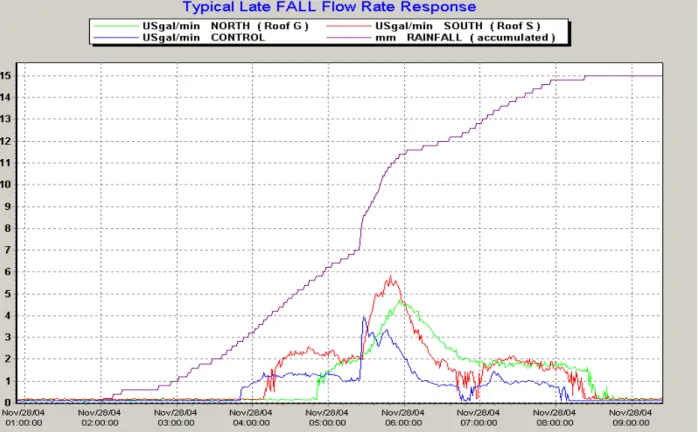
During late fall conditions (Figure 8), flow rates from the test plots showed a shorter lag time compared to summer. As the green roof media became saturated, the response rates behaved similar to the control roof. The peak flows rate reductions were not as dramatic, compared to summer conditions, but still exhibited a calculated peak flow rate reduction of 10% to 30%
(when adjusted on a per m2 basis).
Conclusions
Monitoring of two in-service extensive green roofs in Toronto showed that green roofs are effective in reducing heat flow through the roofing system, thus lowering the energy demand for space conditioning in the building. Although the vegetation coverage was minimal during the first year of establishment, the two green roof systems, with 75-100 mm of lightweight growing medium, reduced the heat flow through the roof by 70-90% in the summer and 10-30% in the winter. Green Roof G was more thermally effective (about 3% extra) in the summer due to its deeper and lighter coloured growing medium. However, Green Roof S was more thermally effective (about 10% extra) in the winter due to the extra insulation value of its component. The green roofs also reduced the maximum roof membrane temperature in the summer by more than 20°C and daily temperature fluctuations experienced by the roof membranes by about
Figure 8 Typical late FALL Flow Rate Response to a 15.0 mm rain event following 7
days of stormy weather with multiple small rain events. Note that the Y axis shows the runoff in US gal/minute; the rainfall is shown as mm (accumulated).
30°C. These reductions will lower the ageing and thermal stresses associated with temperature fluctuations, thus contributing positively to membrane durability.
Monitoring the stormwater runoff characteristics of the two test plot green roofs has shown that a significant reduction in both runoff volume and rates of flow can be achieved compared to the control roof. The Green Roof G response was more consistent throughout all seasons, compared to the Green Roof S, however both extensive green roof systems provided measurable reductions throughout the year. The annual average reduction in volume of 57% is a significant reduction when viewed as a lot-level control. The reductions of peak flow and detention time may provide some sewershed benefits in the form of reduced infrastructure capacity needs. Evaluating sewershed benefits will require intensive stormwater modelling in the future.
Acknowledgement
The authors would like to thank the Technology Early Action Measures and the City of Toronto for their financial support. We would like to acknowledge Jim Kamstra and Susan Neal of the City of Toronto for providing operational and administrative assistance at the Eastview Neighbourhood Community Centre. We would also gratefully acknowledge the colleagues at NRC/IRC – Dr. Bas Baskaran, Ron Bruce, Ray Demers, Dan Guenter, Chris Ladubec, William Lei and Dr. Ralph Paroli for their support in this project; and colleagues at the City of Toronto – Ted Bowering and Gary Stinson.