HAL Id: hal-01907047
https://hal.archives-ouvertes.fr/hal-01907047
Submitted on 28 Oct 2018
HAL is a multi-disciplinary open access
archive for the deposit and dissemination of sci-entific research documents, whether they are pub-lished or not. The documents may come from teaching and research institutions in France or abroad, or from public or private research centers.
L’archive ouverte pluridisciplinaire HAL, est destinée au dépôt et à la diffusion de documents scientifiques de niveau recherche, publiés ou non, émanant des établissements d’enseignement et de recherche français ou étrangers, des laboratoires publics ou privés.
by tannery wastewaters. Part 1: Understanding
chromium accumulation by indigenous chironomids
Davide Vignati, Benoît J.D. Ferrari, Jean-Louis Roulier, Marina Coquery,
Ewa Szalinska, Andrzej Bobrowski, Anna Czaplicka, Andrzej Kownacki,
Janusz Dominik
To cite this version:
Davide Vignati, Benoît J.D. Ferrari, Jean-Louis Roulier, Marina Coquery, Ewa Szalinska, et al.. Chromium bioavailability in aquatic systems impacted by tannery wastewaters. Part 1: Understanding chromium accumulation by indigenous chironomids. Science of the Total Environment, Elsevier, 2019, 653 (653), pp.401-408. �10.1016/j.scitotenv.2018.10.259�. �hal-01907047�
1
This is the final peer-reviewed version of the article:
1
Chromium bioavailability in aquatic systems impacted by tannery wastewaters. Part 1:
2
understanding chromium accumulation by indigenous chironomids
3 4
Published in Science of the Total Environment, doi: 5
https://doi.org/10.1016/j.scitotenv.2018.10.259
6 7
Vignati D.AL.a,b*, Ferrari B.J.D.a,c, Roulier J.-L.d, Coquery M.d, Szalinska E.e, Bobrowski A.f, 8
Czaplicka A.g, Kownacki A.h, Dominik, J.a,i 9
10
a) Department F.-A. Forel for Environmental and Aquatic Sciences, University of Geneva, 11
Uni Carl Vogt, 66 boulevard Carl-Vogt CH-1211 Geneva, Switzerland 12
13
b) Université de Lorraine, CNRS, LIEC, F-57000 Metz, France 14
15
c) Swiss Centre for Applied Ecotoxicology Eawag-EPFL (Centre Ecotox), EPFL-ENAC-16
IIE-GE, Station 2, 1015 Lausanne, Switzerland 17
18
d) Irstea, UR RiverLy, centre de Lyon-Villeurbanne, F-69625 Villeurbanne, France 19
20
e) Department of Environment Protection, Faculty of Geology, Geophysics and 21
Environmental Protection, AGH University of Science and Technology, 30 A. 22
Mickiewicza Av. , 30-059 Krakow, Poland. 23
2 f) Department of Building Materials Technology Faculty of Materials Science and Ceramics, 25
AGH University of Science and Technology, 30 A. Mickiewicza Av. , 30-059 Krakow, 26
Poland 27
28
g) Department of Water Supply, Sewerage and Environmental Monitoring, Cracow 29
University of Technology, 24 Warszawska ul., 31-155 Krakow, Poland 30
31
h) Karol Starmach Department of Freshwater Biology, Institute of Nature Conservation,
32
Polish Academy of Sciences, 33 A. Mickiewicza Av., 31-120 Krakow, Poland
33 34
i) Institute of Marine Science - National Research Council (ISMAR-CNR) Arsenale - Tesa 35
104, Castello 2737/F, 30122 Venice, Italy 36 37 *Corresponding Author: 38 [email protected] 39
Postal address: LIEC UMR7360, Campus Bridoux, UFR SciFa, Bât Ibise, 8 rue Delestraint, 40 57070 Metz, France 41 42 43 44 45 46 47 48 49
3
Abstract
50
The tanning industry uses large quantities of Cr whose contribution to the contaminant burden 51
of aquatic organisms is not yet fully understood. The present study investigated Cr 52
bioaccumulation by indigenous chironomids in a freshwater ecosystem impacted by tannery 53
effluents. Total Cr content in sediments and in chironomids was determined on several 54
occasions. Chromium distribution among sediments and pore waters, and Cr speciation in 55
overlying and pore waters were studied in detail to understand possible factors controlling Cr 56
bioavailability to chironomids. Total chromium concentration ranged from 69 to over 3000 µg 57
g-1 dry weight in sediments and from negligible to over 300 µg-1 dry weight in chironomids 58
(values corrected for sediment gut content). Filterable (<0.45 µm) Cr concentration in 59
overlying waters and pore waters from the surface sediment layers (upper 2 cm) ranged from 60
3 to 120 µg L-1, with Cr(VI) representing 0.5–28% of the total filterable Cr. Chromium 61
profiles in pore waters as determined by diffusive equilibration in thin films (DET) and 62
diffusive gradient in thin films (DGT) were comparable. DGT-labile Cr accounted for less 63
than 2% of the total Cr measured by DET. Although Cr concentrations in sedimentary and 64
aqueous matrices were not directly proportional to Cr levels measured in chironomids, the 65
available findings suggested that Cr inputs from tanneries were bioavailable to resident 66
chironomids. These observations are of particular importance considering that Cr(III), 67
putatively of limited bioavailability and ecotoxicological concern, is the predominant redox 68
form of Cr in bed sediments impacted by tannery discharges. The companion paper provides 69
further insight into Cr bioavailability and effects in tannery impacted ecosystems using a 70
combination of in situ and laboratory approaches. 71
72
Keywords. Chromium speciation; bioaccumulation; DGT; DET; voltammery; sediment cores
4
Introduction
74
Chromium has a complex biogeochemical cycle which is essentially controlled by the 75
simultaneous environmental occurrence of two redox forms, Cr(III) and Cr(VI), having 76
contrasting (geo)chemical and (eco)toxicological properties (2016). Hexavalent Cr is 77
considered of most concern due to its ecotoxicity and proven carcinogenicity in humans, 78
while trivalent Cr is usually regarded as relatively harmless (WHO, 2009; 2013). Hexavalent 79
Cr also has high environmental mobility, while Cr(III) tends to bind to suspended particulate 80
matter and colloids and eventually accumulates in bed sediments (de Sousa et al., 2016; 81
Dominik et al., 2007; Gunkel-Grillon et al., 2014; Hayzoun et al., 2015). Remobilization of 82
Cr(III) from bed sediments is however possible following re-oxidation to Cr(VI) (Gorny et al., 83
2016; Gunkel-Grillon et al., 2014). While the concern about Cr(VI) is justified, increasing 84
evidence points to a possible underestimation of the ecotoxicological risks posed by Cr(III) 85
for unicellular organisms (Bencheikh-Latmani et al., 2007; Jasso-Chávez et al., 2010; Lira-86
Silva et al., 2011; Vignati et al., 2010), crustaceans (Ponti et al., 2014), aquatic plants (Dazy 87
et al., 2008) and terrestrial plants and organisms (Bigorgne et al., 2010; Speranza et al., 2007). 88
The implications of a possible underestimation of Cr(III) ecotoxicity would be particularly 89
relevant in aquatic ecosystems directly impacted by tannery wastewaters. 90
Leather tanning uses large quantities of Cr(III), generally as the basic chromium sulphate 91
Cr2(OH)2(SO4)2. Chromium inputs from tanneries can markedly affect Cr concentrations and
92
fluxes in aquatic environments at local scales (Alves and Rietzler, 2015; Dominik et al., 2007; 93
Hayzoun et al., 2015; Sanyal et al., 2015) and the toxicological impact of tannery wastewaters 94
containing numerous potentially harmful compounds was recently reviewed by Saxena et al. 95
(2017). However, understanding the contribution of Cr(III) to the overall biological response 96
is far from straightforward because tannery effluents contain several toxicologically active 97
substances. The difficulties in apportioning the observed effects to the presence of Cr(III) are 98
5 especially big in the case of bed sediments where Cr preferentially accumulates and Cr(III) 99
tends to be the predominant redox form associated with the solid phase (Pereira et al., 2012; 100
Rosales et al., 2017). 101
Research on the bioavailability and effects of Cr(III) to benthic organism under realistic 102
exposure conditions or field scenarios is actually very limited. Authoritative risk assessment 103
documents (WHO, 2009; European Union, 2005) focus on ecotoxicity data from water-only 104
exposure; neglecting that sediment ingestion can be a major uptake route of Cr(III) for benthic 105
deposit feeders (Baumann and Fisher, 2011). Furthermore, studying the ecotoxicity of Cr(III) 106
to benthic organisms by spiking sediment-water systems with soluble Cr(III) salts is difficult, 107
because the spiked soluble Cr(III) undergoes hydrolysis within seconds and forms scarcely 108
bioavailable Cr(III) oxy-hydroxides that, in turn, undergo polymerization reaction on the time 109
scale of minutes (Pettine et al., 2008). The formation of such precipitates was actually 110
reported in laboratory studies on the relative ecotoxicity of Cr(VI) and Cr(III) on various 111
amphipod species (Berry et al., 2004; Besser et al., 2004); studies that did not highlight 112
measurable effects of Cr(III) on the test organisms. Assessing the possible ecotoxicity of 113
Cr(III) in sediments containing chromite ore processing residues, Becker et al. (2006) 114
concluded that Cr(III) did not impact survival and growth of two amphipods for 115
concentrations as high as 1,310 µg Cr g-1. However, both Cr oxy-hydroxides formed during 116
spiking with Cr(III) salts and chromite ore processing residues poorly mimic the organic-117
Cr(III) forms usually discharged from tannery effluents (Outridge and Scheuhammer, 1993; 118
Walsh and O'Halloran, 1996; Wang et al., 2016). Furthermore, Bervoets et al. (2016) 119
determined that Cr body burdens as low as 10 µg g-1 d.w. (range 10–69 µg g-1 d.w. ) in 120
specimen of Chironomus sp. collected at several field locations in the Flanders (Belgium) can 121
be associated with changes in the macroinvertebrate community composition. Studies 122
simultaneously assessing Cr geochemistry including redox speciation and the corresponding 123
6 Cr bioavailability to benthic organisms in tannery impacted environments are therefore 124
required to understand the bioavailability and possible biological effects associated with Cr in 125
such specific environmental settings. 126
The present work studies Cr bioaccumulation by indigenous chironomids’ assemblages in 127
a river/reservoir system impacted by tannery wastewater discharges (Pawlikowski et al., 2006; 128
Szalinska et al., 2010). Investigations of increasing complexity were carried out during four 129
different sampling periods over four years. A detailed characterization of Cr geochemistry and 130
speciation allows examination of the possible importance of different routes of exposure in 131
contributing to the observed Cr body burden under field conditions. Part two of the present 132
study (Ferrari et al., this issue) compares results from laboratory-based bioaccumulation tests 133
with results obtained using an in situ a customized Sediment-Water Interface Study System 134
(Ferrari et al., 2014) to provide further insight in the bioavailability and effects of Cr in 135
aquatic ecosystems receiving tannery discharges. 136
137 138
2. Methods
139
2.1. Study area and sampling
140
The Dunajec river/Czorsztyn reservoir system (Southern Poland, Fig. 1) is impacted by 141
wastewater discharges from about 300 small tanneries in the Nowy Targ region. Due to 142
inefficient tannery wastewater management, pre-treated or raw wastewaters from these 143
tanneries are discharged into local sewers or directly into nearby watercourses. From late 144
October through February, river sediments in the proximity of tannery effluents are impacted 145
by chromium, while spring and summer floods tend to flush the contaminated sediments into 146
the Czorsztyn reservoir (Pawlikowski et al., 2006; Szalinska et al., 2010). Samples of 147
sediments and indigenous chironomids were collected in June and November 2004, 148
7 November 2006 and June 2007 at two sites. Site 1 (hereinafter Waksmund) was located in a 149
depositional zone of the Dunajec river and directly impacted by untreated tannery discharges. 150
Site 2 (hereinafter Maniowy) was located in the Czorsztyn reservoir in a small bay, locally fed 151
by a small creek which receives the effluent from the local wastewater treatment plant before 152
flowing into the bay (Fig. 1). Tanneries are also present in the region of Maniowy, however 153
only a few of them discharge their waste to the wastewater treatment plant. 154
For all sampling periods, sediment samples (2–10 kg) were collected using a plastic scoop 155
(Waksmund, wading against the river current along the right bank of the river) or a Van Veen 156
grab (Maniowy, the grab was operated from a small boat) and directly homogenised in the 157
field. Larvae of indigenous chironomids were recovered in the field by sieving additional 158
aliquots through 2 and 1 mm sieves. Fourth instar larvae were recovered from the sieves with 159
plastic tweezers, washed in deionised water (5 min), 1 mM EDTA solution (10 min) and again 160
deionised water (5–10 minutes). After blotting with paper towels, 14 to 20 larvae were pooled 161
and placed in cryogenic vials, snap frozen in liquid nitrogen and freeze-dried upon return to 162
the laboratory. The focus being on Cr accumulation in indigenous chironomids’ assemblages, 163
care was taken to select large larvae showing a marked red colour, but no taxonomical 164
identification was performed at this stage. In 2007, samples for a more detailed 165
characterization of the chironomids’ communities were collected at the two sites using a 166
20x20 cm (400 cm2) Surber Sampler (Waksmund) and a 15x15 cm (225 cm2) Ekman Grab 167
Sampler (Maniowy). Chironomids were then recovered for identification by further sieving 168
these samples through a 0.3 mm net. 169
In both 2004 and 2007, independent aliquots of homogenised sediments for analytical 170
determinations were sieved (< 1 mm) in the field and collected into preconditioned 171
polypropylene jars that were kept at 4 °C in the dark and freeze-dried upon return to the 172
laboratory. In November 2006 and June 2007, sediment cores were also collected by short (20 173
8 cm) hand corers either by wading against the river current at 4–5 m from the right bank of the 174
Dunajec River (Waksmund) or by scuba divers in the Czorsztyn reservoir (Maniowy). The 175
corers allowed recovery of sediments (15–25 cm depending on texture and compactness) and 176
associated overlying water (10–15 cm). Further details on core handling are given in section 177
2.2. In 2006, nine cores were collected at each site and analyzed for total Cr content in the 178
uppermost 0.5 cm (see section 2.2). In 2007, one core was collected at each site and sliced for 179
the determination of the following concentration profiles: total Cr in sediments, total Cr in 180
pore waters and Cr(VI) in pore waters (see section 2.2). 181
Diffusive Equilibration in Thin Films (DET) and Diffusive Gradients in Thin Films (DGT) 182
probes were deployed at undisturbed locations close to the sampling sites to obtain 183
information on Cr speciation and lability. The DGT and DET probes (arranged back to back) 184
were recovered after exposures of 46h 25 min (Waksmund) or 45 h (Maniowy). A time-series 185
of Cr-DGT profiles (Maniowy only) was also obtained by exposing DGT probes for 22, 45, 186
68 and 89 h at the same location. 187
188
2.2. Core slicing and pore waters extraction
189
Sediments cores were placed under nitrogen atmosphere in a portable glove box. Overlying 190
waters (OW; height of water column = 10–15 cm) were removed using plastic syringes and 191
taking care to avoid sediment resuspension. Aliquots of OW were filtered (1.2 µm syringe 192
filters, Whatman, Puradisc 30, cellulose acetate), collected into acid washed polypropylene 193
ICP tubes and acidified to 1% (v/v) with concentrated HNO3 (VWR, Suprapur). Prior to use,
194
filters were prewashed with 10 mL of diluted (10% v/v) HCl followed by three rinses with 195
MilliQ water and then kept individually in plastic zip bags. After removing OW, sediment 196
sections from 0.5 to 1 cm thick were transferred to acid washed 100 mL polypropylene 197
centrifuge tubes. Tubes were capped and sealed with Parafilm™ inside the glove box and 198
9 centrifuged at 4000 rpm for 15 + 15 minutes. Tubes showing visible sediment compaction 199
after the second centrifugation cycle were further centrifuged for an additional 30 minutes. 200
Tubes were then re-introduced into the glove box and the pore waters filtered and handled in 201
the same way as OW. Centrifuge tubes, syringes and filters were purged with N2 immediately
202
before core slicing. 203
204
2.3. DET and DGT methodologies
205
Total dissolved metal profiles were assessed by the DET technique (Davison et al., 1994), 206
which is based on the equilibration between solutes and a hydrogel casted in a sampling 207
device. The DET probes consisted of a base plate with a window of 1.8 cm 15 cm and a set 208
of 1 mm slits with 1 mm interval between the slits. The slits were filled with 1.5 % agarose 209
gel (Leermakers et al., 2005). 210
Free and labile metal species were determined using the DGT technique (Davison et al., 211
1994; Zhang and Davison, 1995). The DGT sediment probes consisted of a plastic base (155 212
cm) loaded with a “sandwich” of 3 layers: a resin gel (Chelex 100), covered by a 213
polyacrylamide gel (0.8 mm thickness) and a protective 0.45 µm cellulose nitrate filter (0.13 214
mm thickness, Millipore). Materials for the DGT and DET probes were purchased from DGT 215
Research Ltd. (Lancaster, UK). 216
Before deployment, all the probes were deoxygenated, transported to the field in 217
deoxygenated water and rapidly inserted into the sediment to avoid the co-precipitation of 218
iron (Fe) and other metal ions from pore waters within the gel. After retrieving, the DET and 219
DGT probes were processed in a laminar flow hood. Both the DET gel and Chelex resins 220
from DGT were removed from selected slits, transferred to preweighed plastic tubes and 221
eluted with 2.5 mL of 1 M HNO3 (VWR, Suprapur).
10 Average DGT-labile metal concentrations (CDGT,in µg L-1) were calculated according to
223 the formula: 224 CDGT = (1) 225 226
where: M is the accumulated mass of metal (ng), D is the diffusive coefficient of the metal 227
(cm2 s-1) in the diffusive gel of thickness Δg (cm) for a resin surface A (cm2) and t is the 228
deployment time (s). Chelex 100-loaded DGT cannot complex anionic Cr(VI) species and 229
therefore allow the selective measurement of labile Cr(III) species, while generally excluding 230
organic complexes and colloidal species (Ernstberger et al., 2002; Giusti and Barakat, 2005). 231
The diffusive coefficient of Crwas obtained from the temperature-dependent values tabulated 232 by DGT Research Ltd (http://www.dgtresearch.com/diffusion-coefficients/). 233 234 2.4. Chemical analyses 235
Chromium was assayed by ICP-MS (HP4500, Agilent) using external calibration and internal 236
standard correction in overlying waters, pore waters, DET and DGT eluates, sediment and 237
chironomids. Prior to analysis, sediment aliquots (about 60–300 mg d.w.) and chironomids 238
(about 15–40 mg d.w.) were mineralized with a 5:1 (v/v) mixture of concentrated HNO3
239
(65%) and H2O2 (30%), both from VWR, Suprapur grade. Overall accuracy of the digestion
240
procedures was evaluated using reference materials LKSD-1 (lake sediments) and STSD-2 241
(stream sediments) (Lynch, 1990) for sediments and TORT-2 (lobster hepatopancreas, NRC 242
Canada) for chironomids. Reference waters SLRS-3 from NRC and 1643e from NIST were 243
used to verify instrumental accuracy, with material 1643e being analyzed after a 10-fold 244
dilution. 245
The potentially bioavailable fraction of sediment-bound Cr liable to be released during 246
transit of ingested sediments through chironomids’ gut was estimated using the biomimetic 247 A t D g M
11 approach (Chen and Mayer, 1999), consisting in a cold extraction of sediments aliquots with 248
synthetic Bovine Serum Albumin (BSA). Because BSA was supplied in a 3% NaCl matrix, 249
additional aliquots were extracted with a 3% solution of NaCl to account for salt-related 250
matrix effects. The results of ‘biomimetic Cr’ concentrations are corrected for Cr 251
remobilization due to NaCl. Sediment Loss on Ignition (LOI) at 550°C was performed to 252
estimate the content of total organic matter (OM). 253
In overlying and pore waters (June 2007), Cr(VI) was quantified by Catalytic Adsorptive 254
Stripping Voltammetry (CAdSV) using the differential pulse mode (DPV) and standard 255
addition procedure (Bobrowski et al., 2004). In some cases, pore waters from different 256
sediment layers were combined to obtain enough volume for voltammetric measurements that 257
were performed in triplicate for all samples. To reduce possible interferences due to the 258
presence of large quantities of dissolved organic carbon (DOC) in pore waters, Amberlite 259
XAD-7 resin was added to the (stirred) voltammetric cell five minutes before Cr(VI) 260
determination (Bobrowski et al., 2012). 261
262 263
3. Results
264
3.1. Quality control procedures
265
For analysis of waters and DGT/DET eluates, typical detection and quantification limits for 266
total chromium (calculated as 3 and 10 times the standard deviation of analytical blanks) were 267
0.015 µg L-1 and 0.049 µg L-1, respectively. Four analytical replicates were measured for each 268
sample and the typical precision (for concentrations above the quantification limit) was 5% or 269
better. Measured values for certified reference waters (arithmetic means±1 standard deviation) 270
were 0.29±0.02 µg L-1 for SLRS-3 (n=7) and 21.3±0.1 µg L-1 (n=7) for 1643e; comparing 271
favourably with the corresponding certified values of 0.30±0.04 µg L-1 (uncertainty expressed 272
12 as 95% confidence interval) and 20.4±0.24 µg L-1 (uncertainty expressed as expanded 273
uncertainty). Triplicate measurements for Cr(VI) agreed to 25% or better. Recovery of Cr(VI) 274
from spiked samples was 93% or higher (Bobrowski et al., 2012). 275
Percentage Cr recovery from certified sediments was about 130% for both materials with 276
measured absolute values of 16±2.5 µg g-1 (arithmetic mean±[Abs(range/√2)]; n=2) for 277
LKSD-1 and 64±3.7 µg g-1 (arithmetic mean±1s.d.; n=3) for STSD-2. Our extraction 278
procedure consisted of concentrated HNO3 + H2O2 while certified values (12±2 µg g-1 for
279
LKSD-1 and 50±9 µg g-1 for STSD-2, uncertainties expressed as±1 s.d.) are given for an 280
extraction with concentrated HNO3 and concentrated HCl. Sediments LKSD-1 and STSD-2
281
have a total certified Cr content (based on extraction with HF or analysis by XRF or 282
analogous techniques) of 31±3 and 116±13 µg g-1, respectively. For biological materials, 283
percentage recoveries from TORT-2 were between 77% and 98% of the certified value 284
(0.77±0.15 µg g-1; uncertainty given as 95% confidence limits) and the averaged measured 285
concentration was 0.69±0.1 µg g-1 (arithmetic mean±1s.d.; n=5). 286
287
3.2. Chromium content in bulk sediments and indigenous chironomids
288
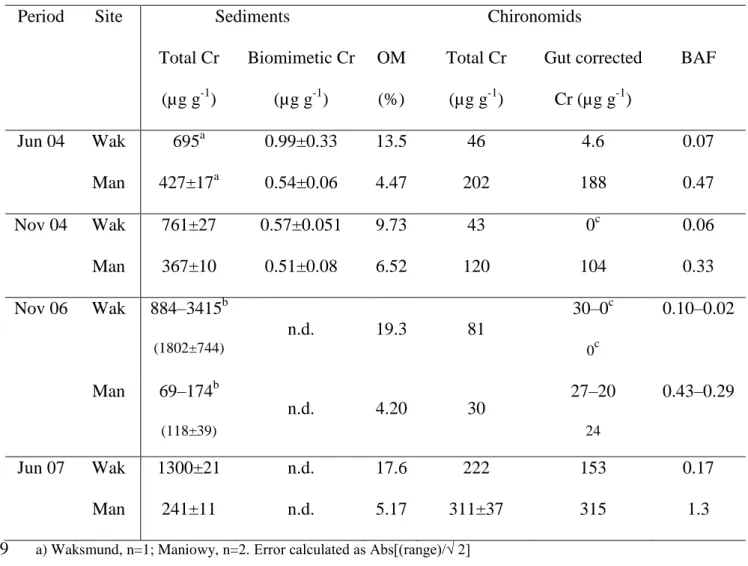
In the 2004 and 2007 sampling periods, Cr concentrations in chironomids tended to be 289
inversely related to those in sediments (Table 1). Biomimetic extractable Cr levels (2004 290
samples only) were about 0.1–0.2 % of total Cr in sediments at both sites and were 291
comparable between sampling periods and sampling sites (Table 1). In November 2006, 292
surface sediment samples at Waksmund were more contaminated (mean±1 s.d. = 1802±744 293
µg g-1, n=9) than at Maniowy (118±39 µg g-1; n=9). In this sampling period, concentration in 294
chironomids increased with increasing concentration in sediments; organisms from Maniowy 295
having lower Cr concentrations than those from Waksmund. However, based on average 296
13 values, Cr concentrations differed by 17-fold in sediments, but less than 3-fold in 297
chironomids. 298
299
3.3. Chromium concentration, distribution and speciation in sediment cores
300
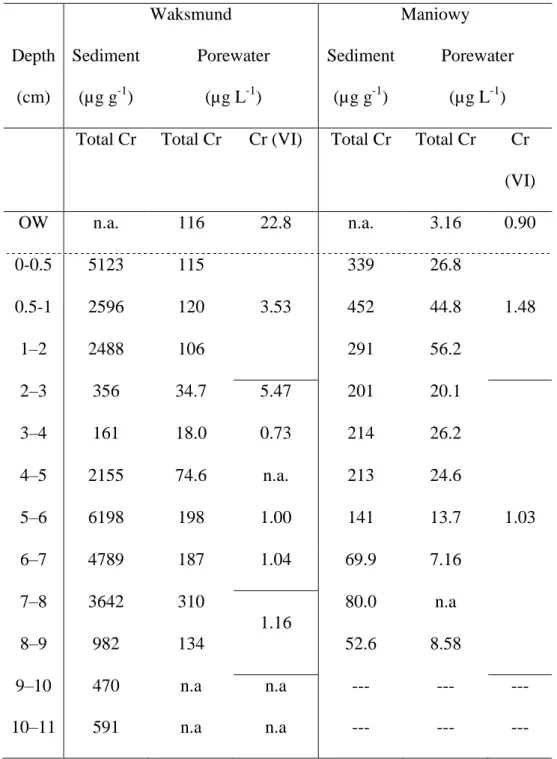
Total Cr concentration in sediments from the 2007 cores was higher at Waksmund than at 301
Maniowy (Table 2). The upper 2 cm of the Waksmund core had Cr concentrations in excess 302
of 2500 µg g-1 and overlaid three layers (2–4 cm, 4–9 cm, and 9–11 cm) with fluctuating 303
levels of Cr contamination. In the core layer between 5 and 8 cm, we visually noticed the 304
presence of fibers and hairs, which is indicative of material originating from tanneries 305
(Pawlikowski et al., 2006). The alternation of sediment layers with different levels of Cr 306
contamination reflects the seasonality of tanning activities (which are concentrated during 307
winter time — the cold season in the boreal hemisphere) coupled with the deposition of spring 308
and summer flood sediments linked to river hydrology (Szalinska et al., 2010). At Maniowy, 309
Cr concentration was highest (452 µg g-1) in the subsurface layer (0.5–1 cm) and then 310
decreased progressively towards the bottom of the core. Considering the upper 2 cm of 311
sediment, which are the most relevant for many chironomids (Stief and de Beer, 2006), Cr 312
concentrations at Waksmund were about 10-fold higher than those at Maniowy. 313
A similar situation was observed in overlying and pore waters. At Waksmund, total Cr 314
concentrations in pore waters were very stable in the first 2 cm (114±7 µg L-1, n=3) and 315
fluctuated markedly (30–300 µg L-1) in the deeper layers. In the Maniowy core, Cr 316
concentrations in pore waters from the uppermost 2 cm were more variable (43±15 µg L-1, 317
n=3), but decreased below this depth (Table 2). The proportion of Cr(VI) relative to total Cr 318
could not be measured for all the pore water samples collected from the various layers due to 319
the water volume required for voltammetric measurements (Bobrowski et al., 2012). Based on 320
the available ‘combined values’ (Table 2), the proportion of Cr(VI) relative to the total Cr 321
14 content of pore waters varied between 0.5% and 15% at Waksmund and between 5% and 15% 322
at Maniowy. At both sites, the proportion of Cr(VI) was higher in overlying waters (20 % and 323
28 % at Waksmund and Maniowy, respectively) than in interstitial waters. In absolute terms, 324
Cr(VI) concentrations were always higher at Waksmund than at Maniowy (Table 2). 325
326
3.4. Chromium concentration by DET and DGT
327
In June 2007, the mean dissolved Cr concentration estimated by DET in interstitial waters at 328
Waksmund was 284±85 µg L-1 (n=11; range 178–437 µg L-1) and the corresponding mean 329
DGT-labile concentration was 4.9±1.7 µg L-1 (n=11; range 2.9–9.0) (Fig. 2). Based on these 330
data, DGTs trapped about 1.7% of the total dissolved species (as measured by DETs) present 331
in pore waters. At Maniowy, average Cr concentrations measured by DET and DGT were 332
74±21 µg L-1 (n=12; range 39–113 µg L-1) and 1.0±0.54 µg L-1 (n=13; range 0.33–2.02 µg L -333
1
), respectively; with DGT trapping 1.3% of the total dissolved concentrations. Chromium 334
concentrations measured by DET were higher than the corresponding Cr levels determined in 335
pore waters after centrifugation (Table 2): 130±86 µg L-1 (n=10) and 25±16 µg L-1 (n=9) for 336
Waksmund and Maniowy, respectively. These difference are linked to the predominance of 337
colloidal Cr(III) (Bobrowski et al., 2004; Dominik et al., 2007) that can be partly removed 338
during centrifugation but is caught by the DET probe. Despite all precautions, precipitation of 339
Fe and Mn oxides may have occurred during core slicing and sediment centrifugation. 340
Regardless of the methodological aspects, Cr concentrations at Maniowy were lower than 341
those at Waksmund for the same period, but the average proportion of dissolved concentration 342
which was labile (DGT with respect to DET) was small (1 to 2 %) and roughly similar for the 343
2 sites. 344
Finally, Cr concentrations in overlying waters were comparable with those in pore waters 345
from the uppermost 2 cm at Waksmund, while they were lower than the values in pore waters 346
15 at Maniowy. A flux of chromium from sediments to the water column is therefore possible at 347
Maniowy, while the situation at Waksmund is more variable and no definite conclusions can 348 be drawn (Fig. 2). 349 350 351 4. Discussion 352
4.1. Chromium levels in environmental matrices and chironomids
353
At Waksmund, the bioaccumulation factor (BAF – calculated as the ratio between total Cr 354
content in sediments vs. total Cr content in indigenous chironomids) ranged from less than 0.1 355
in 2004 and 2006 to 0.17 in June 2007. The same calculation for Maniowy gives values one 356
order of magnitude higher with a maximum of 1.3 for June 2007 (Table 1). Assuming that 357
ingested sediments represent 6% of the chironomids’ body weight (Ferrari et al. (2014), 358
correction for the sediment contained in the organisms’ gut (Hare et al., 1989) decreases Cr 359
concentration in chironomids by 60–100% at Waksmund and by, at most, 30% at Maniowy 360
(Table 1). Calculation of BAFs using Cr gut-corrected concentrations (data not shown) 361
therefore confirms that Cr bioavailability is higher at Maniowy than at Waksmund. 362
Pawlikowski et al. (2006) reported the presence of microscopic pieces of tanned leather in 363
sediments from Waksmund; a situation which increases the total Cr content of sediments, but 364
not its bioavailable fraction. However, the biomimetic analysis performed in 2004 suggests 365
that the quantity of bioavailable Cr (sensu Chen and Mayer, 1999) is comparable for the two 366
sites (Table 1). Because no major changes in river/reservoir hydrodynamics or tanning 367
operations occurred between 2004 and 2007, the amount of bioavailable, sediment-bound Cr 368
at the two sites should have remained similar also for the 2006 and 2007 sampling periods. 369
Another possible explanation for the observed discrepancies between sediment 370
contamination and Cr accumulation by chironomids is that pore waters and/or overlying 371
16 waters contribute most of the bioavailable Cr for uptake by living organisms. However, 372
concentrations of filterable Cr in pore waters (Table 2) and concentrations obtained by 373
DET/DGT (Fig. 2) were systematically higher at Waksmund than at Maniowy; contrary to 374
what was observed in chironomids (Table 1). Even the bioavailable Cr(VI) form was more 375
abundant in pore- and overlying waters from Waksmund than in those from Maniowy. 376
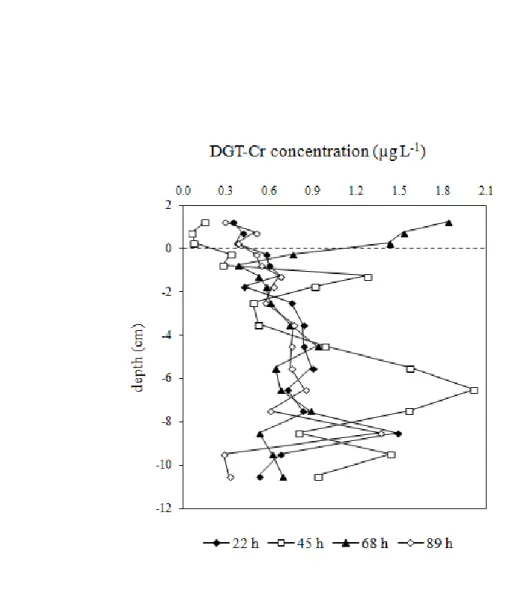
Although these analyses (Table 2) and the results of DET/DGT (Fig. 2) represent a snapshot 377
of the variable aqueous concentrations experienced by chironomids at the sediment-water 378
interface, Cr accumulation by DGT probes exposed for different times at Maniowy was 379
similar (Fig. S1). These additional findings indicate that the sediments’ particulate phase was 380
able to constantly resupply Cr to the pore waters (Roulier et al., 2008), thus ensuring a certain 381
stability of DGT-labile Cr concentrations (assumed as a proxy of bioavailable Cr) is this 382
compartment. 383
On the other hand, direct comparisons between Cr concentrations in aqueous/sedimentary 384
matrices vs. indigenous chironomids do not capture the actual dynamic nature of contaminant 385
accumulation by living organisms. Contaminant accumulation is the net result of uptake from 386
different exposure routes, excretion and growth dilution, as formalized by e.g. the biodynamic 387
modelling approach (Baumann and Fisher, 2011; Luoma and Rainbow, 2005; Wang et al., 388
1997). In the present study, the use of biodynamic modelling to estimate the relative 389
contribution of different routes of exposure to the Cr burden of indigenous chironomids is not 390
straightforward because the model’s parameters vary among species, food types and 391
contaminants. To the best of our knowledge, only a handful of studies have examined Cr 392
uptake by aquatic organisms from aqueous and dietary exposure routes (Baumann and Fisher, 393
2011; Roditi and Fisher, 1999; Roditi et al., 2000; Wang et al., 1997). With the exception of 394
Roditi et al. (2000), who estimated that only 9–45% of Cr accumulation by zebra mussel 395
originated from particle ingestion, these studies identified uptake from food ingestion 396
17 (sediments, suspended particles or algae) as the predominant contributor to the total Cr body 397
burden. None of these studies used chironomids as model organisms, but the predominance of 398
contaminant uptake via food ingestion has been confirmed for chironomids in the case of 399
other trace elements (De Jonge et al., 2010; Martin et al., 2008). It is therefore important to 400
examine more in detail the possible factors that can influence the bioavailability of sediment-401
bound Cr at the study sites. 402
403
4.2. Factors affecting the bioavailability of sedimentary Cr
404
Given the similar concentrations of biomimetic extractable Cr measured at the two sampling 405
sites (Table 1), a similar Cr burden in indigenous chironomids would be expected under the 406
assumption that uptake from sediments determines most of the Cr body burden and that 407
contaminant desorption from sediments is the limiting factor for their subsequent absorption 408
(Wang and Fisher, 1999). These expectations not being confirmed by experimental data, other 409
aspects of Cr geochemistry (not captured by the biomimetic approach) may make Cr more 410
bioavailable at Maniowy than at Waksmund or limit Cr bioavailability in the highly 411
contaminated Waksmund sediments. 412
In the cores collected in June 2007 and in November 2006 (Table 2 and Tables S1a, S1b), 413
a relationship between sedimentary Cr and Fe existed at Maniowy (r=0.88, n=10, p<0.01 in 414
2007 and r=0.69, n=11, p<0.05 in 2006; Spearman Rank Correlation test), but not at 415
Waksmund. The Cr correlation is indicative of an association between Cr and Fe-416
oxyhydroxides that is often highlighted using sequential extraction procedures of sedimentary 417
Cr in aquatic systems impacted by tannery wastewaters (Hursthouse et al., 2001; Khwaja et 418
al., 2001; Rodrigues and Formoso, 2006). However, in such procedures, the Fe-Mn oxides 419
extraction step usually employs hydroxylamine hydrochloride at pH values around 2; much 420
lower than those of 6–7 typical of the chironomids’ gut (Crozier, 1924). Nonetheless, anoxic 421
18 conditions in the chironomids’ gut could favour reductive dissolution of Fe oxides with 422
subsequent liberation of Cr directly in the gut lumen (Stief and Eller, 2006). The redox 423
potential (Eh) in the gut lumen of chironomids is about -50 mV (Stief and Eller, 2006); low
424
enough to allow for the dissolution of amorphous Fe(OH)3 given the Eh value of 14 mV at pH
425
7 for the redox couple Fe(OH)3/Fe(II) (Weber et al., 2006). The kinetics of Fe oxy-hydroxides
426
dissolution can also be fast enough for the whole process to become important during feeding. 427
Larval gut-passage time (GPT) for chironomids ingesting natural sediments varies from less 428
than 1 hour for assemblages of indigenous chironomids (Romito et al., 2010) to about 2 to 4 429
hours for Chironomus riparius (Wästlund, 1999); the variability in the latter case being linked 430
to sediment characteristics. Under some conditions (pH=7 and partial H2S pressure of 10-4
431
atm), dissolution of Fe oxy-hydroxides is fast enough to occur during GPT (Dos Santos 432
Afonso and Stumm, 1992). All these physiological factors and kinetics aspects of sediment 433
digestion by chironomids would not be captured by the in vitro biomimetic approach. A more 434
effective chromium liberation in the gut lumen following dissolution of Fe oxy-hydroxides 435
could then be responsible for the higher level of Cr bioaccumulation at Maniowy. 436
The presence of heterogeneous levels of Cr contamination in sediments and the possible 437
preference of chironomids for relatively clean sediment patches could also contribute to the 438
observed discrepancies between Cr concentrations in water and sediment vs. accumulation by 439
chironomids. Chromium concentrations in sediments did vary markedly in time and space. 440
Results from November 2006 show that Cr concentrations from surface sediment layers (0– 441
0.5 cm) can vary 3–4-fold inside both sampling zones (Table 1). Surface sediment samples 442
collected at Waksmund in September 2005 from 9 sub-sites arranged in a regular grid 443
covering an area of 1 m2 had a Cr content ranging between 132 and 1497 µg g-1 (arithmetic 444
mean±1 standard deviation = 431±379 µg g-1; Table S2). Other samples from Waksmund 445
collected in March, May, August 2005 showed a 38-fold variability of total Cr concentrations 446
19 (Table S2). However, only a 4-fold change in Cr levels was measured in indigenous 447
chironomids recovered from these sediments at the same time (Table S2) and organisms from 448
the cleanest sediments were those with the highest Cr burden after correction for the sediment 449
gut content (Table S2). Whether this may be indicative of a decreased Cr availability in highly 450
contaminated sediments or avoidance of such sediments by benthic organisms remains to be 451
ascertained. 452
In any case, it is worth noting that the gut-corrected Cr concentrations measured in the 453
pools of indigenous chironomids at Waksmund and Maniowy (Table 1 and Table S2) often 454
exceeded the range of 10–69 µg g-1 d.w. associated with a decrease in the presence of other 455
less tolerant taxonomic groups (Bervoets et al., 2016). In June 2004, chironomids were also 456
sampled at two sites not directly impacted by tannery discharges: the Bialka river before its 457
entrance in the Czorsztyn reservoir (Figure 1) and a small sandy beach located east of the 458
mouth of the same river. Chromium levels in sediments from these sites were 44 µg g-1 and 32 459
µg g-1, respectively, and the corresponding gut-corrected Cr concentrations in chironomids 460
were 2.8 µg g-1 and 11.3 µg g-1. The latter values compare favourably with Cr levels that 461
should not negatively affect the structure of benthic communities according to Bervoets et al. 462
(2016). Under this assumption, Cr accumulation at Waksmund and Maniowy (Table 1 and S2) 463
could therefore be high enough to cause adverse effects on the benthic community structure. 464
Finally, the actual species composition of the organisms we described under the generic 465
name of ‘indigenous chironomids’ may also contribute to the observed discrepancies between 466
ambient Cr concentrations and Cr body burdens. Because different species of chironomids 467
accumulate contaminants to different extents (Martin et al., 2008), we compared our 468
simplified sampling method with a more inclusive procedure of organism collection to 469
identify the taxonomic groups dwelling at each site in June 2007 (see section 2.1). The 470
chironomids’ community at Waksmund turned out to be more abundant and more 471
20 heterogeneous than at Maniowy, where the community included only specimen of the genus 472
Chironomus (Fig. 3 and Table S3). This situation reflects typical differences between
473
piedmont streams (i.e., Waksmund) where biodiversity is typically high (Kownacki, 1995) 474
and reservoirs (i.e., Rożnów reservoir on the Dunajec River) where larvae of the genus 475
Chironomus usually dominate (Dumicka et al., 1986). Practically speaking, our simplified
476
sampling procedure did not alter the community pattern at Maniowy, but selectively sampled 477
individuals of the genera Chironomus and Stictochironomus, representing only 20 % of the 478
total species, at Waksmund (Fig. 3 and Table S3). Stictochironomus can actively migrate 479
along the sediment column (Kiyashko et al., 2004) and feed on less contaminated sediments 480
(see the sediment profile in Table 2). This scenario may then explain why observed Cr 481
concentrations at Waksmund were lower than those expected from the concentration in 482
sediments. The differences in species composition also indicate that chironomids at Maniowy 483
may accumulate higher body burdens of Cr because of their feeding strategy (i.e., surface 484
sediment feeders); a situation similar to that reported by Martin et al. (2008) for two 485
sympatric species of Chironomus. 486
Given their ecological traits (McLachlan, 1977; Stief and de Beer, 2006), chironomids may 487
indeed accumulate part of their Cr burden from freshly deposited suspended particulate matter 488
which, in the Dunajec river, is highly variable in both concentration and Cr content (Szalinska 489
et al., 2010; Szalinska et al., 2013). The companion paper (Ferrari et al., this issue) will 490
present evidence supporting the hypothesis that ingestion of freshly deposited suspended 491
matter at the sediment water interface can constitute a prominent route of exposure for surface 492
deposit feeders such as Chironomus spp. (i.e. the predominant genus occurring at Maniowy). 493
494 495 496
21
5. Conclusions
497
High Cr concentrations in sedimentary and aqueous matrices impacted by tannery discharges 498
were not systematically accompanied by high Cr body burdens in surface deposit feeders 499
dwelling at the two sampling locations. However, Cr accumulation by indigenous 500
chironomids did occur despite the low proportion of sediment-bound Cr liable to desorption 501
during gut passage (about 0.1% as estimated using a biomimetic approach). Concentrations of 502
DGT-labile Cr, considered as a proxy for bioavailable Cr(III), and Cr(VI) in pore waters were 503
less than 1% of the total Cr levels. On the other hand, Cr(VI) accounted for 20 to 30% of the 504
total in the overlying water confirming that oxidation of Cr(III) used in the tanning process to 505
Cr(VI) occurred and suggesting that sediments can act as a source of Cr(VI) to the overlying 506
water column. While there is a consensus that deposit feeders get most of their contaminant 507
body burden from sediment ingestion, the possible contribution of water born Cr species to 508
the element body burden in chironomids requires further study. 509
Although Cr accumulation by assemblages of indigenous chironomids is potentially 510
affected by numerous factors (from spatial patchiness in sediment contamination to specific 511
traits of various chironomids genera and species), the present work confirms that Cr released 512
by tannery discharges can accumulate in benthic organisms. These findings are particularly 513
important considering that Cr(III), usually regarded as of little environmental concern, is 514
expected to be the predominant redox form of Cr in sediments impacted by tannery 515
discharges. Metal-tolerant organisms such as chironomids were apparently able to cope with 516
total Cr content exceeding 1000 µg g-1 in the bulk sediment phase. However, such levels of 517
contamination may be high enough to exclude more sensitive taxa, resulting in a simplified 518
community composition and, eventually, non compliance with good ecological quality as 519
required by the Water Framework Directive. 520
22
Acknowledgments
522
This research was supported by the Swiss National Fund (grants 101844 and 200020-523
117942). The authors express their sincerest thanks to Michal Krzyszkowski and the direction 524
of the Niedzica Hydro-Electric Power Plant (Poland) for their precious cooperation. We also 525
thank our colleagues Vincent Chanudet, Régis Kottelat and Stephanie Jüstrich from the 526
Institute F.-A. Forel for their help in field work. Ewa Szalinska thanks the Université de 527
Lorraine (Bourse Chercheurs Invités) for supporting a scientific visit to LIEC. 528
529 530
References
531
Alves RH, Rietzler AC. 2015. Ecotoxicological evaluation of sediments applied to 532
environmental forensic investigation. Brazilian Journal of Biology. 75:886-893. 533
Baumann Z, Fisher NS. 2011. Modeling metal bioaccumulation in a deposit-feeding 534
polychaete from labile sediment fractions and from pore water. Science of The Total 535
Environment. 409(13):2607-2615. 536
Becker DS, Long ER, Proctor DM, Ginn TC. 2006. Evaluation of potential toxicity and 537
bioavailability of chromium in sediments associated with chromite ore processing 538
residue. Environ Toxicol Chem. 25(10):2576-2583. 539
Bencheikh-Latmani R, Obraztsova A, Mackey MR, Ellisman MH, Tebo BM. 2007. Toxicity 540
of Cr(III) to Shewanella sp. strain mr-4 during Cr(VI) reduction. Environ Sci Technol. 541
41:214-220. 542
Berry WJ, Boothman WS, Serbst JR, Edwards PA. 2004. Predicting the toxicity of chromium 543
in sediments. Environ Toxicol Chem. 23:2981-2992. 544
23 Bervoets L, De Jonge M, Blust R. 2016. Identification of threshold body burdens of metals for 545
the protection of the aquatic ecological status using two benthic invertebrates. 546
Environmental Pollution. 210(Supplement C):76-84. 547
Besser JM, Brumbaugh WG, Kemble NE, May TW, Ingersoll CG. 2004. Effects of sediment 548
characteristics on the toxicity of chromium(III) and chromium(VI) to the amphipod, 549
Hyalella azteca. Environ Sci Technol. 38:6210-6216.
550
Bigorgne E, Cossu-Leguille C, Bonnard M, Nahmani J. 2010. Genotoxic effects of nickel, 551
trivalent and hexavalent chromium on the Eisenia fetida earthworm. Chemosphere. 552
80(9):1109-1112. 553
Bobrowski A, Bas B, Dominik J, Niewiara E, Szalinska E, Vignati D, Zarebski J. 2004. 554
Chromium speciation study in polluted waters using catalytic adsorptive stripping 555
voltammetry and tangential flow filtration. Talanta. 63:1003-1012. 556
Bobrowski A, Kapturski P, Zarębski J, Dominik J, Vignati DAL. 2012. Catalytic adsorptive 557
stripping voltammetric determination of chromium(VI) in overlying and interstitial 558
waters isolated from sediments contaminated by tannery waste. Analytical Letters. 559
45(5-6):495-507. 560
Chen Z, Mayer MM. 1999. Assessment of sedimentary Cu availability: A comparison of 561
biomimetic and AVS approaches. Environ Sci Technol. 33(4):650-652. 562
Croizier WJ. 1924. Hydrogen ion concentration within the alimentary tract of insects. The 563
Journal of General Physiology. 6(3):289-293. 564
Davison W, Zhang H, Grime GW. 1994. Performance characteristics of gel probes used for 565
measuring the chemistry of pore waters. Environ Sci Technol. 28(9):1623-1632. 566
Dazy M, Béraud E, Cotelle S, Meux E, Masfaraud J-F, Férard J-F. 2008. Antioxidant enzyme 567
activities as affected by trivalent and hexavalent chromium species in Fontinalis 568
antipyretica hedw. Chemosphere. 73:281-290.
24 De Jonge M, Blust R, Bervoets L. 2010. The relation between acid volatile sulfides (AVS) 570
and metal accumulation in aquatic invertebrates: Implications of feeding behavior and 571
ecology. Environmental Pollution. 158(5):1381-1391. 572
de Sousa EA, Luz CC, de Carvalho DP, Dorea CC, de Holanda IBB, Manzatto ÂG, Bastos 573
WR. 2016. Chromium distribution in an amazonian river exposed to tannery effluent. 574
Environmental Science and Pollution Research. 23(21):22019-22026. 575
Dominik J, Vignati DAL, Koukal B, de Abreu MHP, Kottelat R, Szalinska E, Bas B, 576
Bobrowski A. 2007. Speciation and environmental fate of chromium in rivers 577
contaminated with tannery effluents. Engineering in Life Sciences. 7(2):155-169. 578
Dos Santos Afonso M, Stumm W. 1992. Reductive dissolution of iron(III) (hydr)oxides by 579
hydrogen sulfide. Langmuir. 8(6):1671-1675. 580
Dumicka E, Zieba J, Zurek R. 1986. Characteristics of zooplankton and macrobenthos in the 581
Rożnów dam reservoir (southern poland). Acta Hydrobiologica. 28(3/4):393-413. 582
Ernstberger H, Zhang H, Davison W. 2002. Determination of chromium speciation in natural 583
systems using DGT. Anal Biochem Chem. 373:873-879. 584
European Union 2005. European Risk Assessment Report on chromium trioxide, sodium 585
chromate, sodium dichromate, ammonium dichromate and potassium dichromate. 586
Volume 53. 587
Ferrari B, Vignati D, Roulier J-L, Coquery M, Szalinska E, Bobrowski A, Czaplicka A, 588
Dominik J. submitted. Chromium bioavailability in aquatic systems impacted by 589
tannery wastewaters. Part 2: New insights from laboratory and in situ testing with 590
Chironomus riparius. Science of The Total Environment.
591
Ferrari BJD, Vignati DAL, Dominik J. 2014. Bioaccumulation kinetics and effects of 592
sediment-bound contaminants on chironomids in deep waters: New insights using a 593
low-disturbance in situ system. Environmental Technology. 35(4):456-469. 594
25 Giusti L, Barakat S. 2005. The monitoring of Cr(III) and Cr(VI) in natural water and
595
synthetic solutions: An assessment of the performance of the dgt and dpc methods. 596
Wat Air Soil Poll. 161:313-334. 597
Gorny J, Billon G, Noiriel C, Dumoulin D, Lesven L, Madé B. 2016. Chromium behavior in 598
aquatic environments: A review. Environmental Reviews. 24(4):503-516. 599
Gunkel-Grillon P, Laporte-Magoni C, Lemestre M, Bazire N. 2014. Toxic chromium release 600
from nickel mining sediments in surface waters, New Caledonia. Environ Chem Lett. 601
12(4):511-516. 602
Hare L, Campbell PGC, Tessier A, Belzile N. 1989. Gut sediment in a burrowing mayfly 603
(ephemeroptera, Hexagenia limbata): Their contribution to animal trace element 604
burderns, their removal, and the efficacy of a correction for their presence. Can J Fish 605
Aquat Sci. 46:451-456. 606
Hayzoun H, Garnier C, Durrieu G, Lenoble V, Le Poupon C, Angeletti B, Ouammou A, 607
Mounier S. 2015. Organic carbon, and major and trace element dynamic and fate in a 608
large river subjected to poorly-regulated urban and industrial pressures (Sebou river, 609
Morocco). Science of The Total Environment. 502(Supplement C):296-308. 610
Hursthouse AS, Matthews J, Figures J, Iqbal-Zahid P, Davies IM, Vaughan DH. 2001. 611
Chromium behaviour in intertidal sediments and pore waters, R. Clyde, UK. 612
Environmental Geochemistry and Health. 23(3):253-259. 613
Jasso-Chávez R, Pacheco-Rosales A, Lira-Silva E, Gallardo-Pérez JC, García N, Moreno-614
Sánchez R. 2010. Toxic effects of Cr(VI) and Cr(III) on energy metabolism of 615
heterotrophic Euglena gracilis. Aquatic Toxicology. 100(4):329-338. 616
Khwaja AR, Singh R, Tandon SN. 2001. Monitoring of Ganga water and sediments vis-à-vis 617
tannery pollution at Kanpur (India): A case study. Environmental Monitoring and 618
Assessment. 68(1):19-35. 619
26 Kiyashko SI, Imbs AB, Narita T, Svetashev VI, Wada E. 2004. Fatty acid composition of 620
aquatic insect larvae Stictochironomus pictulus (Diptera: Chironomidae): evidence of 621
feeding upon methonotrophic bacteria. Comp Biochem Physiol Part B. 139:705-711. 622
Kownacki A. 1995. The use of chironomid pupal exuviae for ecological characterization of 623
the Upper Vistula (Southern Poland). Acta Hydrobiologica. 37(1). 624
Leermakers M, Gao Y, Gabelle C, Lojen S, Ouddane B, Wartel M, Baeyens W. 2005. 625
Determination of high resolution pore water profiles of trace metals in sediments of 626
the Rupel River (Belgium) using DET (Diffusive Equilibrium in Thin Films) and DGT 627
(Diffusive Gradients in Thin Films) techniques. Water Air Soil Pollut. 166(1-4):265-628
286. 629
Lira-Silva E, Ramírez-Lima IS, Olín-Sandoval V, García-García JD, García-Contreras R, 630
Moreno-Sánchez R, Jasso-Chávez R. 2011. Removal, accumulation and resistance to 631
chromium in heterotrophic Euglena gracilis. Journal of Hazardous Materials. 193:216-632
224. 633
Luoma SN, Rainbow PS. 2005. Why is metal bioaccumulation so variable? Biodynamics as 634
unifying concept. Environ Sci Technol. 39:1921-1931. 635
Lynch J. 1990. Provisional elemental composition values for eight new geochemical lake 636
sediment and stream sediment reference materials LKSD-1, LKSD -2, LKSD -3, 637
LKSD -4, STSD-1, STSD -2, STSD -3, STSD -4. Geostandards Newsletter. 638
14(1):153-167. 639
Martin S, Proulx I, Hare L. 2008. Explaining metal concentrations in sympatric Chironomus 640
species. Limnology and Oceanography. 53(2):411-419. 641
McLachlan AJ. 1977. Some effects of tube shape on the feeding of Chironomus plumosus L. 642
(Diptera: Chironomidae). J Anim Ecol. 46:139-146. 643
27 Outridge PM, Scheuhammer AM. 1993. Bioaccumulation and toxicology of chromium: 644
Implications for wildlife. Rev Environ Contam Toxicol. 130:31-77. 645
Pawlikowski M, Szalinska E, Wardas M, Dominik J. 2006. Chromium originating from 646
tanneries in river sediments: A preliminary investigation from the upper Dunajec 647
River (Poland). Polish Journal of Environmental Studies. 15(6):885-894. 648
Pereira CD, Techy JG, Ganzarolli EM, Quinaia SP. 2012. Chromium fractionation and 649
speciation in natural waters. Journal of Environmental Monitoring. 14(6):1559-1564. 650
Pettine M, Genneri F, Campanella L, Millero FJ. 2008. The effect of organic compounds in 651
the oxidation kinetics of Cr(III) by H2O2. Geochim Cosmochim Acta. 72:5692-5707.
652
Ponti B, Bettinetti R, Dossi C, Vignati DAL. 2014. How reliable are data for the ecotoxicity 653
of trivalent chromium to Daphnia magna? Environmental Toxicology and Chemistry. 654
33(10):2280-2287. 655
Roditi HA, Fisher NS. 1999. Rates and routes of trace elements uptake in zebra mussel. 656
Limnol Oceanogr. 44(7):1730-1749. 657
Roditi HA, Fisher NS, Sañudo-Wilhelmy SA. 2000. Field testing a metal bioaccumulation 658
model for zebra mussels. Environ Sci Technol. 34(13):2817-2825. 659
Rodrigues M, Formoso M. 2006. Geochemical distribution of selected heavy metals in stream 660
sediments affected by tannery activities. Water, Air, & Soil Pollution. 169(1):167-184. 661
Romito AM, Eggert SL, Diez JM, Wallace JB. 2010. Effects of seasonality and resource 662
limitation on organic matter turnover by Chironomidae (Diptera) in southern 663
Appalachian headwater streams. Limnology and Oceanography. 55(3):1083-1092. 664
Rosales RM, Faz A, Gómez-Garrido M, Muñoz MA, Murcia FJ, González V, Acosta JA. 665
2016. Geochemical speciation of chromium related to sediments properties in the 666
riverbed contaminated by tannery effluents. J Soils Sediments.1-12. 667
28 Roulier JL, Tusseau-Vuillemin MH, Coquery M, Geffard O, Garric J. 2008. Measurement of 668
dynamic mobilization of trace metals in sediments using DGT and comparison with 669
bioaccumulation in Chironomus riparius: first results of an experimental study. 670
Chemosphere. 70(5):925-932. 671
Sanyal T, Kaviraj A, Saha S. 2015. Deposition of chromium in aquatic ecosystem from 672
effluents of handloom textile industries in Ranaghat–Fulia region of West Bengal, 673
India. Journal of Advanced Research. 6(6):995-1002. 674
Saxena G, Chandra R, Bharagava RN. 2017. Environmental pollution, toxicity profile and 675
treatment approaches for tannery wastewater and its chemical pollutants. In: de Voogt 676
P, editor. Reviews of environmental contamination and toxicology. 240 :31-69. 677
Speranza A, Ferri P, Battistelli M, Falcieri E, Crinelli R, Scoccianti V. 2007. Both trivalent 678
and hexavalent chromium strongly alter in vitro germination and ultrastructure of 679
kiwifruit pollen. Chemosphere. 66:1165-1174. 680
Stief P, de Beer D. 2006. Probing the microenvironment of freshwater sediment macrofauna: 681
Implications of deposit-feeding and bioirrigation for nitrogen cycling. Limnology and 682
Oceanography. 51(6):2538-2548. 683
Stief P, Eller G. 2006. The gut microenvironment of sediment-dwelling Chironomus 684
plumosus larvae as characterised with O2, pH, and redox microsensors. J Comp
685
Physiol B. 176(7):673-683. 686
Szalinska E, Dominik J, Vignati DAL, Bobrowski A, Bas B. 2010. Seasonal transport pattern 687
of chromium(III and VI) in a stream receiving wastewater from tanneries. Applied 688
Geochemistry. 25(1):116-122. 689
Szalinska E, Smolicka A, Dominik J. 2013. Discrete and time-integrated sampling for 690
chromium load calculations in a watershed with an impoundment reservoir at an 691
29 exceptionally low water level. Environmental Science and Pollution Research.
692
20(6):4059-4066. 693
Vignati DAL, Dominik J, Beye ML, Pettine M, Ferrari BJD. 2010. Chromium(VI) is more 694
toxic than chromium(III) to freshwater algae: A paradigm to revise? Ecotoxicology 695
and Environmental Safety. 73(5):743-749. 696
Walsh AR, O'Halloran J. 1996. Chromium speciation in tannery effluent - II. Speciation in the 697
effluent and receiving estuary. Water Research. 30(10):2401-2412. 698
Wang D, He S, Shan C, Ye Y, Ma H, Zhang X, Zhang W, Pan B. 2016. Chromium speciation 699
in tannery effluent after alkaline precipitation: Isolation and characterization. Journal 700
of Hazardous Materials. 316:169-177. 701
Wang W-X, Fisher NS. 1999. Assimilation efficiencies of chemical contaminants in aquatic 702
invertebrates: a synthesis. Environ Toxicol Chem. 18(9):2034-2045. 703
Wang W-X, Griscom SB, Fisher NS. 1997. Bioavailability of Cr(III) and Cr(VI) to marine 704
mussels from solute and particulate pathways. Environ Sci Technol. 31:603-611. 705
Wästlund D. 1999. The role of sediment characteristics and food regimen in a toxicity test 706
with Chironomus riparius. Swedish University of Agricultural Sciences. 707
Weber KA, Achenbach LA, Coates JD. 2006. Microorganisms pumping iron: anaerobic 708
microbial iron oxidation and reduction. Nature Reviews Microbiology. 4:752. 709
World Health Organization. 2009. Inorganic Chromium(III) Compounds. Geneva, 710
Switzerland. 711
World Health Organization. 2013. Inorganic Chromium(VI) Compounds. Geneva, 712
Switzerland. 713
Zhang H, Davison W. 1995. Performance characteristics of diffusion gradients in thin films 714
for the in situ measurement of trace metals in aqueous solution. Anal Chem. 67:3391-715
3400. 716
30
Figure captions
717 718
Figure 1. Study area (Dunajec River and Czorsztyn Reservoir; southern Poland) and location 719
of the two sampling sites of Waksmund and Maniowy. The region of Nowy Targ, 720
characterized by the presence of numerous small tanneries, is also indicated. 721
722
Figure 2. Vertical profiles of dissolved and labile Cr concentrations (in µg L-1) as estimated 723
by DET and DGT probes exposed in the field at Waksmund (top panel) and Maniowy (bottom 724
panel) for 45 hours in June 2007. Dashed lines represent the sediment-water interface. Note 725
that DET and DGT depth do not exactly match. 726
727
Figure 3. Relative percentage abundance of different taxomic groups in samples at Waksmund 728
(Wak) and Maniowy (Man) following a full procedure (Wak and Man) or a simplified 729
procedure (WakA and ManA). Grey bars, Chironomus spp.; White bars, Stictochironomus 730
spp.; Black bars, other (see Table S3 for details). 731 732 733 734 735 736 737 738 739 740 741
31 Figure 1 742 743 744 745 746 747 748 749 750 751 752 753 754 755 756 757
32 Figure 2 758 759 760 761 762 763 764 765 766
33 Figure 3 767 768 769 770 771 772 773 774 775 776 777 778 779 780 781 782 783 784 785 786
34
Table 1. Chromium concentrations (µg g-1) in field sediment and indigenous chironomids collected at
787
Waksmund and Maniowy during different periods. For samples collected in 2004 and 2007, concentrations in
788
sediments are arithmetic means (± 1 standard deviation; s.d.) of triplicate measures of homogenised sediment
789
aliquots (unless otherwise indicated in the footnotes). For samples collected in 2006, the range and the
790
arithmetic mean ± 1 s.d. of Cr concentration in sediments were obtained from analysis of surface sediment layers
791
(0–0.5 cm) obtained from sediment cores (see footnotes for details). Chromium concentrations extracted from
792
sediments using the biomimetic approach (see section 2.4 for more details) are also reported for the 2004
793
campaigns. Total and gut corrected Cr concentrations are for pooled chironomids samples (n=1, except for June
794
2007 where n=2). Correction for sediment gut content was done according to Hare et al. (1989) assuming a
795
sediment gut content equal to 6% of the organisms’ weight (Ferrari et al. 2014). BAF, Bioaccumulation
796
Factor=total Cr in Chironomids/total Cr in sediments; Wak, Waksmund; Man, Maniowy; OM, Organic Matter;
797
n.d., not determined.
798
Period Site Sediments Chironomids
Total Cr (µg g-1) Biomimetic Cr (µg g-1) OM (%) Total Cr (µg g-1) Gut corrected Cr (µg g-1) BAF Jun 04 Wak 695a 0.99±0.33 13.5 46 4.6 0.07 Man 427±17a 0.54±0.06 4.47 202 188 0.47 Nov 04 Wak 761±27 0.57±0.051 9.73 43 0c 0.06 Man 367±10 0.51±0.08 6.52 120 104 0.33 Nov 06 Wak 884–3415b (1802±744) n.d. 19.3 81 30–0c 0c 0.10–0.02 Man 69–174b (118±39) n.d. 4.20 30 27–20 24 0.43–0.29 Jun 07 Wak 1300±21 n.d. 17.6 222 153 0.17 Man 241±11 n.d. 5.17 311±37 315 1.3
a) Waksmund, n=1; Maniowy, n=2. Error calculated as Abs[(range)/√ 2]
799
b) Range and, in parenthesis, arithmetic mean ± one standard deviation of Cr concentration measured in surface
800
sediment layers (0–0.5 cm) from 9 independent cores.
35
c) Correction for sediment content in the gut yielded a negative value that was reported as zero in the table.
802 803
Table 2. Concentrations of total chromium in sediments, overlying water (OW) and porewaters from cores
804
collected at Waksmund and Maniowy in June 2007. Cr(VI) concentrations in OW and porewaters are also
805
reported. For Cr(VI) determinations, porewaters recovered from different sediment layers were sometimes
806
combined due to analytical constraints (see Material and Methods and Bobrowski et al., 2012). n.a., porewater
807
could not be recovered from these layers; ---, Maniowy core was sliced down to 9 cm.
808 Waksmund Maniowy Depth (cm) Sediment (µg g-1) Porewater (µg L-1) Sediment (µg g-1) Porewater (µg L-1)
Total Cr Total Cr Cr (VI) Total Cr Total Cr Cr
(VI) OW n.a. 116 22.8 n.a. 3.16 0.90 0-0.5 5123 115 3.53 339 26.8 1.48 0.5-1 2596 120 452 44.8 1–2 2488 106 291 56.2 2–3 356 34.7 5.47 201 20.1 1.03 3–4 161 18.0 0.73 214 26.2 4–5 2155 74.6 n.a. 213 24.6 5–6 6198 198 1.00 141 13.7 6–7 4789 187 1.04 69.9 7.16 7–8 3642 310 1.16 80.0 n.a 8–9 982 134 52.6 8.58 9–10 470 n.a n.a --- --- --- 10–11 591 n.a n.a --- --- --- 809
36
Supplementary information for:
810
Chromium bioavailability in aquatic systems impacted by tannery wastewaters. Part 1:
811
understanding chromium accumulation by indigenous chironomids
812 813 814 815 816 817 818 819 820 821 822 823 824 825 826 827 828 829 830 831 832 833 834 835 836 837 838 839 840 841
Figure S1. Depth profiles of DGT-labile Cr (µg L-1) in pore waters obtained in June 2007 for 842
different exposure periods at Maniowy. 843 844 845 846 847 848 849 850
37 Table S1a. Vertical profiles of total concentrations of Cr, Fe, and Mn (all in µg g-1 d.w.) in 851
two sediment cores collected in June 2007 at Waksmund and Maniowy. Raw data were 852
centred and reduced before performing the correlation statistics presented in section 4.3 of the 853 main text. 854 Waksmund Maniowy Depth (cm) Cr Fe Mn Cr Fe Mn 0–0.5 5123 37,333 860 339 18,870 219 0.5–1 2596 40,268 943 452 22,209 238 1–2 2488 36,503 974 291 17,111 197 2–3 356 42,301 1371 201 15,487 206 3–4 161 42,321 1513 214 19,146 238 4–5 2155 32,965 1106 213 17,980 214 5–6 6198 29,898 774 141 13,868 186 6–7 4789 22,590 392 69.9 14,847 181 7–8 3642 27,691 405 80.0 15,917 212 8–9 982 15,254 199 52.6 12,879 167
9–10 470 10,247 140 n.a. n.a. n.a.
10–11 591 11,983 143 n.a. n.a. n.a.
855 856 857 858 859 860 861 862 863 864 865 866 867 868 869 870 871 872 873