HAL Id: hal-00316438
https://hal.archives-ouvertes.fr/hal-00316438
Submitted on 1 Jan 1998HAL is a multi-disciplinary open access
archive for the deposit and dissemination of sci-entific research documents, whether they are pub-lished or not. The documents may come from teaching and research institutions in France or abroad, or from public or private research centers.
L’archive ouverte pluridisciplinaire HAL, est destinée au dépôt et à la diffusion de documents scientifiques de niveau recherche, publiés ou non, émanant des établissements d’enseignement et de recherche français ou étrangers, des laboratoires publics ou privés.
Letter to the Editor: Solar-cycle variation of the daily
foF2 and M(3000)F2
S. S. Kouris, P. A. Bradley, P. Dominici
To cite this version:
S. S. Kouris, P. A. Bradley, P. Dominici. Letter to the Editor: Solar-cycle variation of the daily foF2 and M(3000)F2. Annales Geophysicae, European Geosciences Union, 1998, 16 (8), pp.1039-1042. �hal-00316438�
solar or ionospheric indices. One step towards optimis-ing that adjustment is to examine the extent to which daily values depend on daily solar activity. The present inves-tigations therefore consider the correlation with daily sunspot number R, whereas monthly median values are known to correlate best with 12-month running mean sun-spot number R12.
2 Data and analyses
Measured characteristics values for the seven mid-latitude European locations of Moscow (55.5°N 37.3°E), Kalinin-grad (54.7°N 20.6°E), Juliusruh (54.6°N 13.4°E), Slough (51.5°N 0.6°W), Lannion (48.7°N 3.5°W), Poitiers (46.6°N 0.3°E) and Rome (41.9°N 12.5°E) for 30 days of each of 12 months and 24 h over the period 1974–1984 have been fitted to polynomial functions of the form: foF2 = a0+ a1R + a2R 2 + a3R 3 + … (1) M(3000)F2 = b0+ b1R + b2R 2 + b3R 3 + … . (2)
In particular, Student’s t-test and Fisher’s F-test have been applied to determine the significance of the higher-order polynomial coefficients and at what points truncation should be introduced.
3 Results
For foF2 these tests show that a3is significant at the 95%
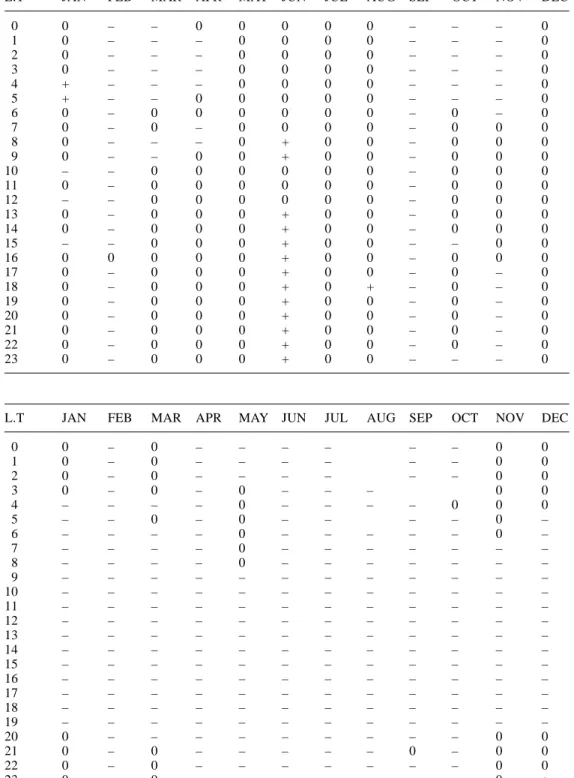
level in about 40% of the regressions examined, being neg-ative in winter and the equinoxes, and positive in summer. Moreover, this same general pattern of variation is expe-rienced at all stations considered. As an example, Table 1 for Slough shows the months and hours for which the term a3is significant and for these whether it is positive or
neg-ative. Retention of a2results in substantial improvement,
being significantly different from zero in 85% of cases (Table 2). a2 is negative in all seasons and exhibits this
same pattern at all stations, i.e. tending towards saturation at the higher R. By contrast, in the case of M(3000)F2, b3
Letter to the Editor
Solar-cycle variation of the daily foF2 and M(3000)F2
S. S. Kouris1, P. A. Bradley2, P. Dominici3
1Aristotle University of Thessaloniki, Department of Electrical Engineering and Computer Engineering, Telecommunications Division, GR-540 06 Thessaloniki, Greece
2Consultant, formerly Rutherford Appleton Laboratory, Chilton, Didcot, Oxon, UK 3
Physics Department, University of Rome “La Sapienza”, Italy Received: 1 December 1997 / Accepted: 6 March 1998
Abstract. Daily values of the ionospheric characteristics
fo F2 and M(3000)F2 for a given hour and month are cor-related with the corresponding daily values of sunspot number using measured data collected at seven European locations. The significance of applying different-order polynomials is considered and the times are confirmed when the higher-order terms are important. Mean correla-tion coefficients for combined data sets over all hours, months and stations are determined, together with the stan-dard errors of estimates. Comparisons are made with cor-responding figures for monthly median values derived from the same data sets.
Key words. Electromagnetics (Guided waves) ·
Iono-sphere (Ionospheric disturbances) · Radio Science (Radio wave propagation)
1 Introduction
Many research workers have investigated the solar-cycle variation of the monthly median critical frequency foF2 using different solar and ionospheric indices (ITU-R, 1990; Bradley, 1993). Similar studies for the monthly median propagation factor M(3000)F2 have been more limited, but some exist (Kouris et al., 1994). On the other hand, to date the present authors are not aware of any cor-responding analysis applied to the daily values of these two quantities. This is understandable, in view of the facts that long-term propagation predictions in support of communications circuit planning seek to define me-dian trends, and that changes from day to day, not nec-essarily due to solar variability, must inevitably degrade the degrees of correlation. However, it is clear that means are needed to be able to forecast ionospheric conditions on any given day of interest. According to Wilkinson (1995) daily values may be estimated by using “adjusted”
is found to be significant in only 12% of the cases, with little pattern consistence between stations. But b2is
sig-nificantly different from zero in 60% of cases (Table 3) and unlike a2is positive in all seasons for all stations, in
the sense which gives an increasing rate of rise for the higher R.
To compare the calculated correlation coefficients (Crow et al., 1960), distributions of this parameter have been generated over all hours, days, months and stations (60480 values) and a Fisher’s z-transformation has been applied to convert these from highly skew to
approxi-mately normal form. The usual tests of significance for a normal distribution confirmed, indeed, that the samples could then be regarded as drawn from the same normal population; hence it is valid to quote averaged combined correlation coefficients (Table 4), together with their as-sociated standard errors. It is evident from these results that there is little difference, both for foF2 and for M(3000)F2, between the correlation coefficients for the second and third-order relationships, and the usual test of differences shows that these are not statistically signifi-cant. But the correlation coefficients are significantly
1040 S. S. Kouris et al.: Solar cycle variation of the daily foF2 and
L.T JAN FEB MAR APR MAY JUN JUL AUG SEP OCT NOV DEC
0 0 – – 0 0 0 0 0 – – – 0 1 0 – – – 0 0 0 0 – – – 0 2 0 – – – 0 0 0 0 – – – 0 3 0 – – – 0 0 0 0 – – – 0 4 + – – – 0 0 0 0 – – – 0 5 + – – 0 0 0 0 0 – – – 0 6 0 – 0 0 0 0 0 0 – 0 – 0 7 0 – 0 – 0 0 0 0 – 0 0 0 8 0 – – – 0 + 0 0 – 0 0 0 9 0 – – 0 0 + 0 0 – 0 0 0 10 – – 0 0 0 0 0 0 – 0 0 0 11 0 – 0 0 0 0 0 0 – 0 0 0 12 – – 0 0 0 0 0 0 – 0 0 0 13 0 – 0 0 0 + 0 0 – 0 0 0 14 0 – 0 0 0 + 0 0 – 0 0 0 15 – – 0 0 0 + 0 0 – – 0 0 16 0 0 0 0 0 + 0 0 – 0 0 0 17 0 – 0 0 0 + 0 0 – 0 – 0 18 0 – 0 0 0 + 0 + – 0 – 0 19 0 – 0 0 0 + 0 0 – 0 – 0 20 0 – 0 0 0 + 0 0 – 0 – 0 21 0 – 0 0 0 + 0 0 – 0 – 0 22 0 – 0 0 0 + 0 0 – 0 – 0 23 0 – 0 0 0 + 0 0 – – – 0
Table 1. Hours and months for which the coefficient a3 of the cubic polynomial term for foF2 is significant in the case of Slough data, +: a3positive, –: a3negative, 0: a3zero
L.T JAN FEB MAR APR MAY JUN JUL AUG SEP OCT NOV DEC
0 0 – 0 – – – – – – 0 0 1 0 – 0 – – – – – – 0 0 2 0 – 0 – – – – – – 0 0 3 0 – 0 – 0 – – – 0 0 4 – – – – 0 – – – – 0 0 0 5 – – 0 – 0 – – – – 0 – 6 – – – – 0 – – – – – 0 – 7 – – – – 0 – – – – – – – 8 – – – – 0 – – – – – – – 9 – – – – – – – – – – – – 10 – – – – – – – – – – – – 11 – – – – – – – – – – – – 12 – – – – – – – – – – – – 13 – – – – – – – – – – – – 14 – – – – – – – – – – – – 15 – – – – – – – – – – – – 16 – – – – – – – – – – – – 17 – – – – – – – – – – – – 18 – – – – – – – – – – – – 19 – – – – – – – – – – – – 20 0 – – – – – – – – – 0 0 21 0 – 0 – – – – – 0 – 0 0 22 0 – 0 – – – – – – – 0 0 23 0 – 0 – – – – – – – 0 +
Table 2. Hours and months for which the coefficient a2 of the quadratic term for foF2 is significant in the case of Slough data, +: a2positive, –: a2negative, 0: a2zero
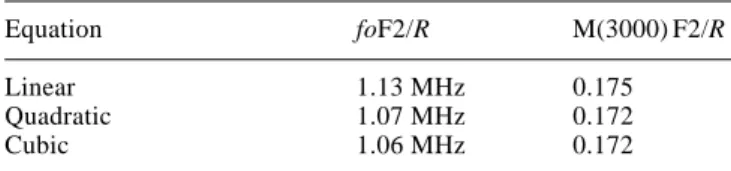
greater when a quadratic as opposed to a linear dependence is adopted, and so the quadratic relationship is recom-mended be used. On the other hand, the reduction in stan-dard error of estimate (Table 5) between the quadratic and linear relationships remains relatively small, particularly so in the case of foF2 for which, as already noted, the a2
term was significant in 85% of cases.
4 Discussion
Table 4 also shows for comparison, using the same meas-urement data sets, the combined correlation coefficients for a linear and a quadratic dependence when considering monthly median values. There are marked differences,
with monthly median values close to unity in the case of foF2, and likewise for M(3000)F2 some 25% greater than for daily results. On the other hand, the diurnal and sea-sonal trends in the correlation coefficients are found to be in the same sense whether dealing with daily or monthly median values, and this fact prompts us to attribute the ob-served differences to the influences of other effects than ionisation production in dominating the day-to-day vari-ability of these two ionospheric characteristics. For exam-ple, at middle latitudes ionospheric disturbances can de-press or enhance foF2 by more than 50% in some partic-ular days (Kouris et al., 1998) such that a multiple regres-sion of two variables, for instance R and the geomagnetic Ap index as advocated for the monthly median values by Kane (1992), might substantially improve the daily corre-lation. If so, this suggests that formulations based also on magnetic activity could be valuable in improving short-term ionospheric forecasts.
5 Conclusions
For European middle latitudes, daily values of both foF2 and M(3000)F2 a second-degree relationship is shown to
L.T JAN FEB MAR APR MAY JUN JUL AUG SEP OCT NOV DEC
0 + 0 + + + + 0 + + + + + 1 + + + + + + 0 + + + 0 + 2 + + + + + + + 0 + + + + 3 0 + + 0 + + + 0 + + + + 4 0 + + + + + 0 0 + + + 0 5 0 0 + + 0 0 + + 0 + + 0 6 0 0 + + + 0 0 0 + + + + 7 + 0 + 0 0 0 0 0 + + + + 8 + 0 + 0 + 0 0 0 0 0 + + 9 + + + + + 0 0 0 0 + + + 10 + 0 0 0 + 0 0 0 + + + + 11 + + + + 0 0 0 0 + + + + 12 + + + + + 0 0 0 + + + + 13 + + + + 0 0 0 0 + + + + 14 + + + + 0 0 0 0 + + + + 15 0 + + 0 0 0 0 0 + + 0 + 16 0 0 + 0 0 0 + 0 + 0 0 0 17 0 0 0 0 0 0 + – + 0 0 0 18 0 0 0 0 + 0 + 0 + 0 0 0 19 0 0 0 + + + + 0 0 + 0 + 20 0 0 + 0 + + 0 0 + + + + 21 0 0 + + + + 0 + + + + + 22 + + + + + + + + + + + + 23 + + + + + + + + + + + +
Table 3. Hours and months for which the coefficient b2 of the quadratic term for M(3000)F2 is significant in the case of Juliusruh data, +: b2positive, –: b2negative, 0: b2zero
Polynomial foF2/R M(3000)F2/R foF2/R M(3000)F2/R daily daily monthly median monthly median
Linear r 0.743 0.617 0.95 0.87 r ± s.e. 0.742–0.744 0.615–0.618 0.946–0.951 0.869–0.874 Quadratic r 0.768 0.637 0.96 0.89 r ± s.e. 0.767–0.769 0.635–0.638 0.955–0.960 0.888–0.892 Cubic r 0.773 0.640 0.96 0.89 r ± s.e. 0.772–0.774 0.638–0.641 0.959–0.963 0.890–0.893
Table 4. Averaged combined correlation coefficients and their standard errors over all station-time data sets given by daily and monthly median analyses when different poly-nomial orders are adopted
Table 5. Overall standard errors of estimate given by daily analyses when different polynomial orders are adopted
Equation foF2/R M(3000) F2/R Linear 1.13 MHz 0.175 Quadratic 1.07 MHz 0.172 Cubic 1.06 MHz 0.172
exist with daily sunspot number, though the degree of cor-relation is not as high as in the case of the monthly me-dian values. This difference is attributed to the effects of ionospheric day-to-day variability not associated with ion-isation production. Therefore, in day-to-day predictions daily sunspot numbers are not a good parameter and an ad-justed solar or ionospherically derived index might give better results.
References
Bradley, P. A., Indices of ionospheric response to solar-cycle epoch,
Adv. Space Res., 13, 25–28, 1993.
Crow, E. L., F. A. Davis, and M. W. Maxfield, Statistics Manual, chapter 6, Dover Publications, New York, 1960.
ITU-R, Choice of indices for long-term ionospheric predictions, Recommendation 371, ITU, Geneva, 1990.
Kane, R. P., Solar cycle variation of foF2, J. Atmos. Terr. Phys., 54, 1201–1205, 1992.
Kouris, S. S., P. A. Bradley, and I. K. Nissopoulos, The relation-ships of foF2 and M(3000)F2 versus R12, in Proceedings COST
238/PRIME Workshop, Eindhoven, The Netherlands, pp 155–
167, 1994.
Kouris, S. S., D. N. Fotiadis, and T. D. Xenos, On the day-to-day variation of foF2 and M(3000)F2, Adv. Space Res., in press, 1998. Wilkinson, P. J., Predictability of ionospheric variations for quiet and disturbed conditions, J. Atmos. Terr. Phys., 57, 1469–1481, 1995.