HAL Id: hal-00305617
https://hal.archives-ouvertes.fr/hal-00305617
Submitted on 17 Jan 2007HAL is a multi-disciplinary open access archive for the deposit and dissemination of sci-entific research documents, whether they are pub-lished or not. The documents may come from teaching and research institutions in France or abroad, or from public or private research centers.
L’archive ouverte pluridisciplinaire HAL, est destinée au dépôt et à la diffusion de documents scientifiques de niveau recherche, publiés ou non, émanant des établissements d’enseignement et de recherche français ou étrangers, des laboratoires publics ou privés.
Chalk rivers
J. Griffiths, J. Nutter, A. Binley, N. Crook, A. Young, J. Pates
To cite this version:
J. Griffiths, J. Nutter, A. Binley, N. Crook, A. Young, et al.. Variability of dissolved CO2 in the Pang and Lambourn Chalk rivers. Hydrology and Earth System Sciences Discussions, European Geosciences Union, 2007, 11 (1), pp.328-339. �hal-00305617�
© Author(s) 2007. This work is licensed under a Creative Commons License.
Variability of dissolved CO
2in the Pang and Lambourn Chalk
rivers
J. Griffiths
1, J. Nutter
2, A. Binley
3, N. Crook
4, A. Young
1and J. Pates
31Centre for Ecology and Hydrology, Wallingford, UK 2Wallingford Hydrological Solutions, Wallingford, UK 3Department of Environmental Science, Lancaster University, UK 4Department of Geophysics, Stanford University. California, USA
Email for corresponding author: [email protected]
Abstract
This paper presents the results of a two-year field campaign to determine the spatial and temporal variability of groundwater interaction with surface waters in two Cretaceous Chalk catchments (the Pang and Lambourn) in the Upper Thames in Berkshire, UK, based on measurement of dissolved carbon dioxide (CO2). Average stream water concentrations of dissolved CO2 were up to 35 times the concentration at atmospheric
equilibrium. Mean groundwater concentrations of 85 and 70 times the atmospheric equilibrium were determined from borehole water sampled in the Pang and Lambourn respectively. Diurnal and seasonal variation of in-stream concentration of dissolved CO2 is not significant enough
to mask the signal from groundwater inputs.
Keywords: chalk, river, groundwater, alkalinity, pH, carbon dioxide, Pang, Lambourn, LOCAR
Introduction
Analysis of stream and groundwater chemistry has been used to assess the extent of groundwater interaction with surface waters (Neal et al., 1990; Hill and Neal, 1997; James et al., 2000; Cook et al., 2003; Malcolm et al., 2004; Rodgers et
al., 2004). Such methods provide relatively quick and
inexpensive descriptions of the spatial and temporal distribution of surface-groundwater interactions. For a naturally occurring substance to be used as an indicator of groundwater, its concentration in groundwater must be relatively consistent over both space and time, as well as significantly different from that of stream water. Initially, dissolved CO2 is captured from the atmosphere by rainfall.
Processes of organic material decomposition in the soil column further increase the CO2 concentration of this water
as it percolates through the soil. Resulting levels of dissolved CO2 in groundwater are, therefore, higher than those found
in surface waters (Neal et al., 2000), making it a good candidate for use as a groundwater tracer.
When groundwater emerges at an interface with a surface-water body, dissolved CO2 in the groundwater starts to degas
at a rate determined by the dimensional characteristics of the water-body, the amount of disturbance or turbulence in the water and external interferences such as wind-speed (Genereux and Hemond, 1992; Raymond and Cole, 2001). Once at the surface, the concentration of CO2 in the water
may be affected by photosynthetic and respirative processes of biological organisms in surface sediments and in the water column. Such processes make the interpretation of surface-water CO2 concentrations for calculation of the rate and
extent of groundwater inputs more difficult (Schurr and Ruchti, 1977; Simonsen and Harremoes, 1978). For measurements of dissolved CO2 to be useful as reliable
indicators of surface-groundwater interaction therefore, the potential magnitude of extraneous sources and sinks of CO2
must first be quantified.
Worrall and Lancaster (2005), observed significant intra-annual variation in groundwater-dissolved CO2, and between
different aquifers. While physically-based models for simulation of conservative natural tracers may be used as a starting point in the context of CO2 (e.g. Choi et al., 1998),
Hemond, 1992) and extraneous processes of CO2
production, CO2 degassing and carbonate precipitation are
still not addressed. Indeed, Finlay (2003), suggests that even the presence of canopy cover above streams can affect the temporal dynamics of dissolved CO2 significantly.
This paper investigates the potential of using simple surface/groundwater ratios of dissolved CO2 to describe the
spatial and temporal distribution of surfacegroundwater interaction in groundwater catchments. The influence of streamflow and in-stream vegetation on the seasonal and diurnal variability of in-stream dissolved CO2 has been
assessed using water sampled at nine surface water and five groundwater locations, over a three-year period in the Pang and Lambourn Chalk catchments in Berkshire, UK.
The Pang and Lambourn catchments are key sites of the Lowland Catchment Research project (LOCAR) which aims to develop a better understanding of hydrological, geo-chemical and ecological processes in permeable lowland catchments. In this research new interdisciplinary science and improved modelling tools were developed to meet the challenges of integrated catchment management as defined by the Water Framework Directive (Wheater and Peach, 2004).
Site description
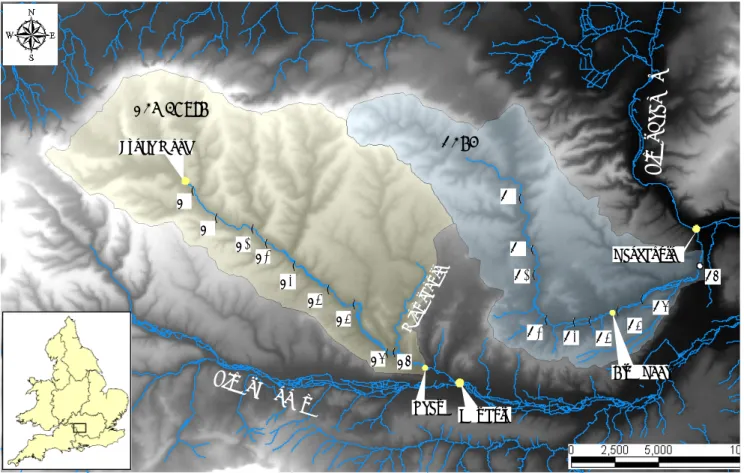
Covering areas of 170.9 km2 and 234.1 km2 respectively,
the Pang and Lambourn catchments are located on the northern side of the Thames basin (Fig. 1) and each catchment consists of predominantly Upper and Middle Cretaceous Chalk. The Upper Chalk is approximately 75 m thick and outcrops extensively on the dip slopes of both catchments. The Middle Chalk is up to 60 m thick and is slightly more argillaceous than the Upper Chalk, (Allen et
al., 1997; Aldiss et al., 2002). Due to the highly permeable
nature of Chalk aquifers, rivers in both catchments are groundwater fed. The Lambourn, for example, has an average stream gauge baseflow index (BFI) of 0.93, whilst the Pang has average BFI of 0.867 (Gustard et al., 1992). In addition to groundwater springs, there are several sink holes in both catchments, the most significant one being in the lower Pang catchment (Banks et al., 1995; Maurice et al., 2006). Significant impermeable Tertiary (Eocene) formations are also found in the lower Pang, including Reading Beds and London Clay. Geological variation between the two catchments is reflected in contrasting landscape features and topography. The river valley of the
! ( ! ( ! ( ! ( !( ! ( ! ( ! ( ! ( ! ( ! ( ! ( ! ( ! ( ! ( !( ! ( Lynch Wood Newbury Lambourn Pang R iver Tha mes River K ennet Win terb ourn e L1 Blue Pool P9 Shaw L6 L2 P2 P8 L7 Pangbourne L3 L9 P7 L5 P6 L8 L4 P1 P5 P3 P4
Fig. 1. Location of water sampling sites within the Pang and Lambourn catchments.
Lambourn, for example, is relatively narrow (typically 250500 m) with sharp gradient sides. The Pang, by comparison, is characterised by wide river valleys (up to 2 km width) with less-defined sides of lower topographic gradient. Consequently, dry-valley landscape-features that intersect the main river-valley, and which are thought to promote convergence of subsurface flow (Grapes et al., 2005), are more prevalent in the Lambourn catchment. Grapes et al. (2006) also identified a localised alluvial gravel aquifer in the Lambourn valley which is probably associated with a number of small wetland areas in the main river valley. Larger regional-scale controls on groundwater movement in the two catchments include major hydrological sinks (the Thames and Kennet valleys), geological boundaries (Pewsey Anticline) and the stratigraphic position relative to sea level (Bradford, 2002). Hard-grounds and harder bands in the Chalk, associated with more cleanly fractured areas of deeper Chalk, may also promote the formation of preferential flow pathways (Brettal, 1971).
The River Lambourn flows in a predominantly south-easterly direction throughout its course and covers a distance of 20 km from its source at Lynch Wood to its confluence with the larger River Kennet at Newbury. The River Lambourn has a mean annual flow of 1.76 m3 s1 (1962
2003), at the Shaw gauging station, situated 2 km upstream of Newbury (NRFA, 2004a). From spring to summer, the seasonal head of the river rises from outcrops of Middle Chalk in Lynch Wood at the top of the catchment. Stream levels generally peak and begin to recede from the end of May. Summer streamflow recession is then followed by a period, usually between August and January depending on rainfall, in which the stream becomes ephemeral in its upper reaches between Lynch Wood and L4 (Fig. 1). At such times, the head of the river may occur as far as 6 km downstream of its winter location.
The Pang flows north-south for its first 10 km and then turns east for 7 km, before turning north to meet the Thames at Pangbourne 22 km downstream from its winter head (Fig. 1). The river has a mean annual flow of 0.65 m3 s1 (1962
2003) at Pangbourne (NRFA, 2004b). In late winter, the river rises from the Upper Chalk in the northern half of the catchment, flow is then supported by springs at a number of downstream locations (Maurice et. al., 2006). The largest of these occurs at an area known locally as the Blue Pool (between P6 and P7). In average rainfall years, the river channel becomes ephemeral between P1 and P2 and between P3 and P6, whence perennial springs are insufficient to support flow. Such conditions may prevail from September/ November to as late as the following April.
Dissolved CO
2in Chalk streams
In Chalk catchments, CO2 in groundwater is the result of
calcium carbonate (calcite) acid dissolution due to microbiological activity; this generates carbonic acid and nitrogen transformations. The rates of these reactions are determined by CO2 concentrations and the degree of mineral
unsaturation in the water, and the availability of individual minerals, especially those that dissolve rapidly, such as calcite and other carbonate-based minerals. Upper and middle Chalk consists of relatively pure calcium carbonate such as the mineral calcite but may still contain impurities, including Mg, Sr, Mn and Fe.
The chemistry of percolating rainwater in Chalk catchments will change gradually as it passes through different subsurface layers. Chalk soils are typically less than one metre in depth and, whilst well drained, have relatively slow infiltration times of about a metre per year. The production of CO2 by biological activity in such soils
results in the CO2 concentration of percolating rainfall
increasing from 340 ppm in the open-air to up to 6000 ppm (Edmunds et al., 1992). The rate of CO2 production through
biological activity in the soil is linearly related to temperature, but the relationship is also dependent on the type of vegetation and will be greater for natural vegetation than for wheat crops, for example.
Beneath the soil layer, in the unsaturated zone of the Chalk, moisture moves in what is essentially a dual-porosity medium comprising the saturated micro-pores of the Chalk rock matrix, and a largely unsaturated fissure network that runs through the Chalk. Due to processes of CO2 dissolution
in the upper soil layers, infiltrating water is already close to equilibrium with the groundwater held in the Chalk matrix in this zone. Water is gradually displaced downwards under gravity according to the piston-flow model, allowing the liberation and transfer of bicarbonate and calcium ions from the Chalk. Variation in calcium and bicarbonate concentrations and, hence, in dissolution and precipitation rates will be related to the variation in dissolved CO2 in
percolating water.
Under normal diffuse recharge conditions in the saturated zone, calcite saturation is rapidly established near bedrock outcrops (Edmunds et al., 1992). As a marine limestone however, Chalk will continue to undergo diagenetic changes, especially where younger influent water comes into contact with older water stored in the Chalk matrix. Groundwater chemistry may thus be modified slowly as it flows through the Chalk, resulting in increases in Mg/Ca and Sr/Ca ratios (Elliot et al., 1999). These ratios are useful in determining water to rock contact times, but because of the heterogeneity of groundwater movement and mixing in the subsurface
(Younger and Elliot, 1995), may be difficult to use in estimating groundwater residence times. Deeper ground-water in the Chalk may undergo mineral dissolution, precipitation and cation exchange at a slower rate than groundwater nearer the surface. The salinity of deep groundwater may also be higher, depending on the extent of system flushing with freshwater that has occurred since formation. Both of the above factors will produce a distinct geochemical zonation of groundwater with depth. In general, groundwaters are approximately calcite saturated in the Chalk, at least in the present study area (Neal et al., 2002b). Elevated concentrations of dissolved CO2 in groundwater
entering surface-water drainage systems will result in accelerated rates of CO2 degassing which can significantly
affect stream water-chemistry (Jacobson and Usdowski, 1975). Degassing of CO2 will take place at a rate determined
by stream dimensions, turbulence and wind-speed, but will invariably be susceptible to modification through biogeochemical processes (Wilcock et al., 1999). For example, processes of photosynthesis and respiration by benthic algae, phytoplankton and macrophytes, will generate or remove CO2 from the water column depending on
temperature and daylight available. Biological photosynthesis and respiration processes described by Neal
et al. (1998a, 2002a) in long-term studies in the Kennet
Valley, suggest a diurnal variation in dissolved CO2 of up to
150% in summer but just 50% in winter (maximum CO2
occurs at night). The breakdown of dissolved or particulate organic carbon will occur in the surface and near-subsurface environment and will, thus, also promote increased levels of dissolved CO2 in the aquifer in summer.
Methods and analysis
The variability of pH and dissolved CO2 have often been
used as an indicator of groundwater interaction with surface waters to characterise water quality in lowland rivers (Neal
et al., 1998a,b,c, 2000). Similarly, variation of in-stream
alkalinity and silica have been used as groundwater tracers in upland rivers (Neal et al., 1990; Rodgers et al., 2004). In the present study, pH and Gran alkalinity were used to calculate dissolved CO2 from water samples of 200 ml from
up to ten locations in each catchment (Fig. 1 and Table 1), at weekly intervals from Dec 2002 to June 2005. Unfiltered samples were retrieved in sealed glass bottles for measurement of pH and of Gran alkalinity determined using a method derived from Neal (1988, 2001a).
The partial pressure of dissolved CO2 (EpCO2) was
determined from Gran alkalinity and pH using a method described by Neal et al. (1998b). The method assumes that the effect of other ions on Gran alkalinity will be negligible
and that EpCO2 does not vary under different meteorological
conditions. EpCO2 represents the number of times that the
sampled water is oversaturated with CO2, with respect to a
similar sample that has reached equilibrium with the atmosphere. Thus, for example, the CO2 concentration of a
sample with an EpCO2 equal to ten, will be ten times that of
a sample that has been given time to equilibrate with atmospheric conditions.
River water chemistry of the Pang and Lambourn is characteristic of most Chalk streams in the UK; it is both calcium-rich and of high alkalinity (Neal et al., 2000, 2002b, 2004a). As precipitation of carbonate material in the river is minimal (Neal, 2002), CO2 gas exchange to the
atmosphere will cause an increase in pH, but a negligible change in alkalinity. Variation in pH therefore, can also be used as a surrogate measure of changes in dissolved CO2
when linked to average alkalinity values (Neal et al., 2002a). Previous studies illustrate a strong inverse relationship between pH and EpCO2 (Neal et al., 1998b,c; Howland et
al., 2000). To assess the degree of diurnal variation in
dissolved CO2, in-stream EpCO2 was also calculated from
pH data sampled at 15 minute intervals from October 2002 to June 2004. Measurements of pH were obtained at sites P3, P5, P7 and P9 in the Pang catchment and at site L5 and the streamflow gauge at Shaw in the Lambourn catchment. The method of calculation used (Neal et al., 1998b), also required alkalinity/Gran alkalinity and, preferably,
Table 1. Sample sites location and downstream distances in the Lambourn and Pang catchments.
Location Site Name National Grid Distance
ref. (km)
Riverside Cottage L1 SU 328 792 0.1
Eastbury L2 SU 343 775 2.75
East Garston L3 SU 366 768 4.95
Maidencourt Farm L4 SU 373 759 6.45
East Shefford House L5 SU 389 747 7.8
Welford Park L6 SU 410 732 10.45
Westbrook Farm L7SU 426 722 12.75
Woodspeen L8 SU 446 693 16.2 Bagnor L9 SU 451 693 17 Compton P1 SU 528 787 0 St Abbs P2 SU 534 756 4 Frilsham Meadow P3 SU 536 740 6.45 River Barn P4 SU 543 713 8.9 Bucklebury P5 SU 560 711 10.8 Jewells Farm P6 SU 570 711 11.8
Frogmore Farm P7SU 587 719 13.68
Bradfield P8 SU 602 725 15.43
temperature data. For this purpose, in-stream alkalinity was assumed to be constant and calculated for each site from samples analysed previously. Daily temperature data were obtained from the LOCAR weather station at site P3 in the Pang.
Results and discussion
VARIATION IN STREAM EPCO2
Figure 2 illustrates long-term variation of calculated EpCO2
for site P9 in the lower Pang. Data between July 1997 and October 2002, taken from Neal et al. (2000), have been added to measurements from the present study for October 2002 to June 2004. In addition to a marked diurnal variation identified by Neal et al. (2004b), levels of dissolved CO2
dip in the summer months and peak in the winter months. Significant inter-month variation also occurs, perhaps because under wetter conditions the less permeable geology of the site in the lower reaches of the Pang catchment promotes rainfall runoff. If the long term variation in dissolved CO2 at this site is representative of the variation
in the catchments studied, then the period of study was one of increased variability. Catchment averaged EpCO2 over
the studied period was 19.8 in the Pang, compared to 16.8 in the Lambourn.
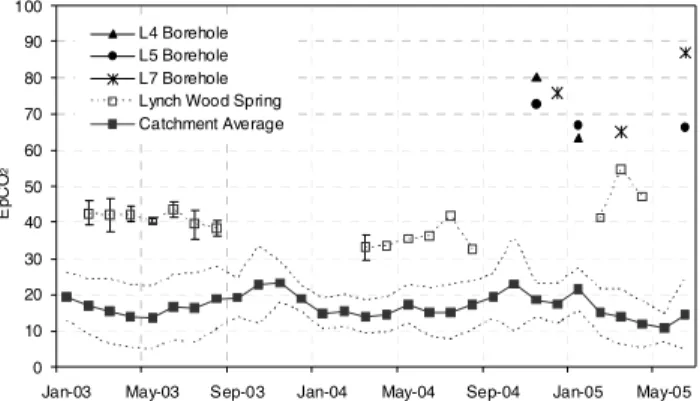
Variation of catchment-averaged monthly EpCO2 for the
Pang and Lambourn is shown in Figs. 3 and 4. These figures represent the mean dissolved CO2 in samples collected at
all sites in a catchment, in a given month. The standard deviation boundaries represent both in-month variability (temporal) and variability between sites (spatial). The higher standard deviation observed for the Pang catchment represents greater spatial variability (mean monthly s.d. between sites = 10.3), as opposed to temporal variability
(mean monthly s.d. of all sites = 3.4). Both temporal and spatial variability is lower in the Lambourn catchment: variability between sites (mean monthly s.d. = 6.9) is still greater than variability in sites (mean monthly s.d. = 2.7), but to a lesser degree than samples taken from the Pang. EpCO2 data for bore-hole and spring water sampled in each
catchment are also shown in Figs. 3 and 4. The EpCO2
calculated for spring-water samples was at least twice that calculated for river water samples (mean EpCO2 of 62.2 at
the Blue Pool spring in the Pang, and 40.3 at Lynch Wood springs in the Lambourn). Groundwater samples retrieved from boreholes at P3 and L7 exhibited mean EpCO2 values
of 81.8 and 76.2, respectively.
For both rivers, catchment averaged in-stream EpCO2 was
minimal in May of 2003, 2004 and 2005, when streamflow in the rivers was near its maximum. Conversely, catchment averaged in-stream EpCO2 was at a maximum between
September and November in 2003 and 2004, when streamflow in both rivers was low. This seasonal variability
0 5 10 15 20 25
Jan-97 Jan-98 Jan-99 Jan-00 Jan-01 Jan-02 Jan-03 Jan-04 Jan-05
Ep C O 2 7-day mean monthly mean
Fig. 2. Monthly and 7-day mean EpCO2 at site P9 in the Pang
catchment. 0 10 20 30 40 50 60 70 80 90 100
Jan-03 May-03 Sep-03 Jan-04 May-04 Sep-04 Jan-05 May-05
Ep
C
O
2
P3 Borehole Blue Pool Spring Catchment Average
Fig. 3. Variation in averaged stream-water dissolved CO2 (s.d.
boundaries indicated), compared to dissolved CO2 in spring and
borehole sampled waters in the Pang catchment.
Fig. 4. Variation in averaged stream-water dissolved CO2 (s.d.
boundaries indicated), compared to dissolved CO2 in spring and
borehole sampled waters in the Lambourn catchment. 0 10 20 30 40 50 60 70 80 90 100
Jan-03 May-03 Sep-03 Jan-04 May-04 Sep-04 Jan-05 May-05
Ep C O 2 L4 Borehole L5 Borehole L7 Borehole Lynch Wood Spring Catchment Average
may also be amplified by increased plant, macrophyte and algal activity in the river-bed in summer months (Neal et
al., 2002a), which promotes the breakdown of dissolved or
particulate organic carbon (Neal et al., 1998a). This seasonal variation is also observed in water samples taken from springs in each catchment, indicating that water being delivered to rivers via springs is also influenced by microbial activity that is more intense in summer.
The temporal variation in EpCO2 at selected sites in the
Lambourn and Pang catchments (Figs. 5 and 6) confirms that the trend of increasing stream EpCO2 through the
summer occurs at most sampled sites. This is particularly obvious for the sites in the Lambourn catchment (Fig. 5) which exhibit a relatively small range of variation between sites throughout the period of study. However, the relative ranking of EpCO2 at sampling sites in each catchment may
change with time relative to the location of the nearest active source of groundwater input. For example, low flow conditions in the upper Lambourn between September 2004
and January 2005 (as indicated by the cessation of flow at L3), led to increased EpCO2 at L5 and L6, as springs in that
area became the dominant source of streamflow. When streamflow in the upper catchment recommenced, EpCO2
at these sites fell again as a higher proportion of streamflow consisted of groundwater from the upper catchment that was closer to atmospheric equilibrium.
In the Pang catchment, larger differences in EpCO2
between sample sites are due to a greater number of groundwater springs contributing to streamflow. Where springs join the stream under low flow conditions, in-stream dissolved CO2 is more significantly affected. For example,
the mean monthly EpCO2 calculated for P3 is ten times the
atmospheric equilibrium than that of P7 (Fig. 6), even though a greater volume of groundwater actually enters the river channel just upstream of P7 (at Blue Pool). In-stream EpCO2
at each site will, therefore, be a function of the distance of the site from the nearest upstream input of groundwater; the volume and CO2 concentration of groundwater entering
the stream; the volume and CO2 concentration of water
already in the stream; and the rate at which CO2 will degas
from the stream into the atmosphere.
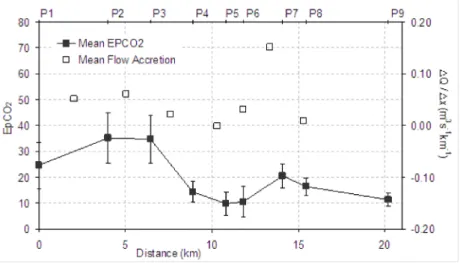
A summary of downstream variation in mean EpCO2 for
the period studied is shown for the Pang and Lambourn in Figs. 7 and 8, respectively. Also shown is the mean flow accretion (m3 s1 km1) between the sites in each catchment.
EpCO2 was generally high at upstream sites in both rivers
(P2 and P3 in the Pang and L1 in the Lambourn). Increases in stream EpCO2 between each site correlate well with
streamflow accretion. The increase in EpCO2 between sites
P6 and P7, representing the input from the Blue Pool springs, for example, corresponds to a streamflow accretion of approximately 0.15 m3 s1 km1. Similarly, Fig. 8 shows an
increase in EpCO2 between L3 and L4 in the Lambourn.
This level of dissolved CO2 is conserved through sites L5
and L6, representing a more diffused input of groundwater to the river, which is characteristic of this catchment. This is reflected by mean flow accretion of between 0.07 and 0.18 m3 s1km1,between L3 and L7
. These findings are
consistent with previous studies in this area (Bradford, 2002; Grapes et al., 2005; Grapes et al., 2006; Griffiths et al., 2006).
For both rivers, EpCO2 reaches its maximum in November
and its minimum in May. The summer rise in EpCO2
coincides with the fall in streamflow, which reduces the dilution of the CO2-rich groundwater as it enters the stream.
This result is similar to that of Pinol and Avila (1992) who found an inverse relationship between dissolved CO2 and
discharge in Mediterranean catchments, though lowest flows tended to exhibit greater variation in EpCO2 and degassing
of EpCO2 tended to precipitate calcite. They also found, as
0 10 20 30 40 50 60 70
Jan-03 May-03 Sep-03 Jan-04 May-04 Sep-04 Jan-05 May-05
Ep C O 2 L3 L5 L6 L7 0 10 20 30 40 50 60 70
Jan-03 May-03 Sep-03 Jan-04 May-04 Sep-04 Jan-05 May-05
Ep C O 2 P3 P4 P6 P7
Fig. 5. Monthly average measured EpCO2 for the sites at East
Garston (L3), East Shefford House (L5), Welford Park (L6), and Westbrook Farm (L7) in the Lambourn catchment.
Fig. 6. Monthly average measured EpCO2 for the in-stream sites at
Frilsham Meadow (P3), River Barn (P4), Jewells Farm (P6) and Frogmore Farm (P7) in the Pang catchment.
in this study, that this pattern is disrupted during large storm events when EpCO2 increased with the storm hydrograph,
in response to greater shallow groundwater delivery to the main channel system.
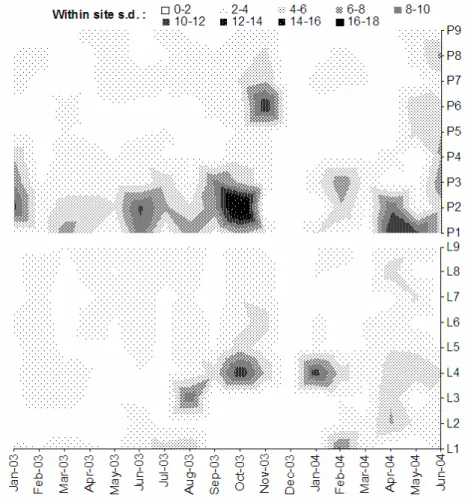
Standard deviation of EpCO2 was higher at sites of
significant but intermittent surface-groundwater interactions. This occurred, for example, at L4 in the Lambourn catchment and at P2 and P3 in the Pang catchment, where the groundwater to surface water ratio varies throughout the year in response to seasonal groundwater recharge of streams. In addition to annual variation, Fig. 9 illustrates the monthly standard deviation (n=4) of calculated EpCO2 at each site for 2003 to 2004.
The higher variability when streamflow is at its annual minimum and stream EpCO2 is at its annual maximum,
indicates that stream water-chemistry is extremely sensitive to even small increases in groundwater delivery (the variation is certainly above that expected in relation to
analytical chemistry errors). The standard deviation at the sampling site just downstream of the Blue Pool springs (P7) is small, underlining the consistency of its contribution to streamflow of the Pang as identified by Neal et al. (2000).
DIURNAL VARIATION
Average Gran alkalinity values determined for the Pang and Lambourn (4986 and 4532 mEq l1, respectively), were used
with 15-minute resolution pH data collected from L5 and Shaw in the Lambourn catchment, and at P3, P5, P7 and P9 in the Pang catchment, to examine diurnal variation in EpCO2. The method used follows one akin to that described
by Neal et al. (2002a). At all of the sites, diurnal variation in EpCO2 was a maximum between 03:00 and 10:00, and a
minimum between 14:00 and 15:00. Though both catchments had the same annual average pH (6.7), temporal variability in pH (and thus EpCO2) tended to differ between
Fig. 7. Average calculated EpCO2 and mean flow accretion between sample points on
the River Pang in the period Jan 2003 to Feb 2005.
Fig. 8. Average calculated EpCO2 and mean flow accretion between sample points on
the catchments. For example, the maximum amplitude of diurnal variation occurred in the summer at sites in the Lambourn, but in spring at sites in the Pang. Catchment-averaged changes in stream EpCO2 are shown in Fig. 10
and Fig. 11. The flatter shape of the profile between evening and morning represents the duration of lower light levels and thus lower photosynthetic activity. Whilst the size of the diurnal variation is related to the amount of biological activity in the stream channel, the maximum percentage change in EpCO2 (relative to the catchment average) was
lower in the Lambourn, reflecting not only lower concentrations of groundwater EpCO2 at many sites, but
also higher volumes and velocity of streamflow, which tended to keep sites more free of vegetation.
In addition to the effect of increased biological activity, variations in stream EpCO2 may be related to river flow.
Seasonal trends in streamflow were similar in both catchments. In the Lambourn, high flows (>3 m3 s1)
occurred in January 2003, then decreased throughout the year to an autumn minimum of 0.38 m3 s1. Flow then
increased into the spring of 2004. In the Pang, flows
Fig. 9. Spatial variation in standard deviation of monthly calculated EpCO2 at sampling sites within
the Pang and Lambourn catchment (20032004).
>1.21 m3 s1 in January decreased to a minimum of
0.06 m3s1 in October and, following this minima, flows
began to increase into spring of 2004. These trends of low flows in the spring/summer due to decreased precipitation, coincide with values of high EpCO2. This suggests that high
summer in-stream EpCO2 is due both to increased biological
activity and lower flows. The lower volume of degassed water in the channel results in higher values of in-stream EpCO2 if inputs from local groundwater sources remain
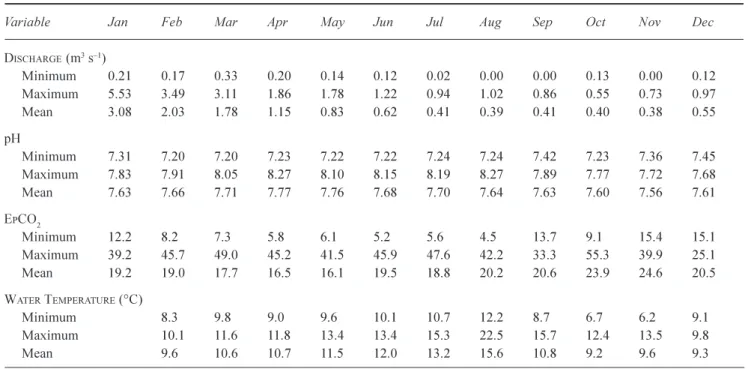
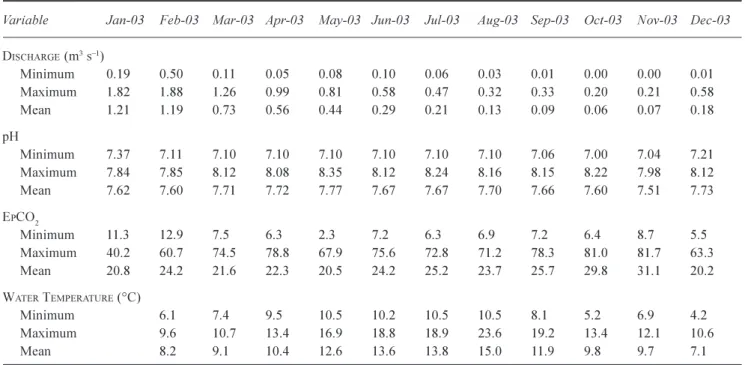
constant throughout the year (such as at Blue Pool). Under such conditions, biological activity will result in higher diurnal variation than is seen at sites with lower mean in-stream concentrations of EpCO2. Tables 2 and 3 show the
mean, minimum and maximum seasonal (monthly) values for streamflow, pH, EpCO2 and water temperature values
for the Lambourn and Pang catchments during 2003. Whilst streamflow, EpCO2 and pH reach their seasonal maximum
and minimum turning points around May and November, maximum water temperatures (representative of photosynthetic and respirative activity) occur mid-way between these months, in August. Seasonal variability in
Table 2. The monthly physio-chemical variables for the Lambourn catchment (January-December 2003)
Variable Jan Feb Mar Apr May Jun Jul Aug Sep Oct Nov Dec
DISCHARGE (m3s1) Minimum 0.21 0.170.33 0.20 0.14 0.12 0.02 0.00 0.00 0.13 0.00 0.12 Maximum 5.53 3.49 3.11 1.86 1.78 1.22 0.94 1.02 0.86 0.55 0.73 0.97 Mean 3.08 2.03 1.78 1.15 0.83 0.62 0.41 0.39 0.41 0.40 0.38 0.55 pH Minimum 7.31 7.20 7.20 7.23 7.22 7.22 7.24 7.24 7.42 7.23 7.36 7.45 Maximum 7.83 7.91 8.05 8.27 8.10 8.15 8.19 8.27 7.89 7.77 7.72 7.68 Mean 7.63 7.66 7.71 7.77 7.76 7.68 7.70 7.64 7.63 7.60 7.56 7.61 EPCO2 Minimum 12.2 8.2 7.3 5.8 6.1 5.2 5.6 4.5 13.7 9.1 15.4 15.1 Maximum 39.2 45.749.0 45.2 41.5 45.9 47.6 42.2 33.3 55.3 39.9 25.1 Mean 19.2 19.0 17.7 16.5 16.1 19.5 18.8 20.2 20.6 23.9 24.6 20.5 WATER TEMPERATURE (°C) Minimum 8.3 9.8 9.0 9.6 10.1 10.712.2 8.76.76.2 9.1 Maximum 10.1 11.6 11.8 13.4 13.4 15.3 22.5 15.712.4 13.5 9.8 Mean 9.6 10.6 10.711.5 12.0 13.2 15.6 10.8 9.2 9.6 9.3
the standard deviation of the monthly averaged pH (and thus EpCO2) are greater in the Lambourn than in the Pang,
with the standard deviation increasing during low flow spring/summer conditions.
GROUNDWATER EPCO2
Values of the EpCO2 of groundwater, sampled from
boreholes adjacent to the rivers studied, are similar in both catchments, ranging between 65 and 90 times the concentration at atmospheric equilibrium (Figs. 3 and 4). In contrast, a mean magnitude of EpCO2 in water sampled
from the Lynch Wood spring in the upper Lambourn (c. 100 m upstream of L1) of 40.3 (s.d.= 5.7), suggests that these springs are derived from a groundwater environment different from that of the groundwater sampled from boreholes. Mean EpCO2 of Blue Pool spring water in the
lower Pang (c. 100 m upstream of P7) was 62.6 (s.d.= 7.6). A more detailed description of the variability of shallow groundwater was obtained by sampling groundwater from a set of boreholes at L4 and at L5 (Fig. 12). Variability in EpCO2 decreased with depth at both sites and the highest
levels of EpCO2 occurred at depths between 2 and 6 m below
ground level in surveys conducted in November. This result agrees with the pattern seen in the streams and suggests that there may be some connectivity between the surface water and shallow groundwater at this site.
Catchment-averaged increases of in-stream EpCO2
correspond with increases in shallow groundwater EpCO2,
as indicated by samples obtained from spring water and
Fig 10. Seasonally averaged diurnal change in EpCO2 as calculated
from 15 minute resolution pH data measured at P3, P5, P7 and P9 in the Pang.
Fig. 11. Seasonally averaged diurnal change in EpCO2 as
calculated from 15 minute resolution pH data measured at L5 and Shaw gauging station in the Lambourn.
-6 -4 -2 0 2 4 6 00 02 04 06 08 10 12 14 16 18 20 22 p Winter Autumn Summer Spring -6 -4 -2 0 2 4 6 00 02 04 06 08 10 12 14 16 18 20 22 H Winter Autumn Summer Spring D EpCO 2 D EpCO 2 Hours Hours
Table 3. The monthly physio-chemical variables for the Pang catchment (January-December 2003)
Variable Jan-03 Feb-03 Mar-03 Apr-03 May-03 Jun-03 Jul-03 Aug-03 Sep-03 Oct-03 Nov-03 Dec-03
DISCHARGE (m3s1) Minimum 0.19 0.50 0.11 0.05 0.08 0.10 0.06 0.03 0.01 0.00 0.00 0.01 Maximum 1.82 1.88 1.26 0.99 0.81 0.58 0.470.32 0.33 0.20 0.21 0.58 Mean 1.21 1.19 0.73 0.56 0.44 0.29 0.21 0.13 0.09 0.06 0.07 0.18 pH Minimum 7.37 7.11 7.10 7.10 7.10 7.10 7.10 7.10 7.06 7.00 7.04 7.21 Maximum 7.84 7.85 8.12 8.08 8.35 8.12 8.24 8.16 8.15 8.22 7.98 8.12 Mean 7.62 7.60 7.71 7.72 7.77 7.67 7.67 7.70 7.66 7.60 7.51 7.73 EPCO2 Minimum 11.3 12.9 7.5 6.3 2.3 7.2 6.3 6.9 7.2 6.4 8.7 5.5 Maximum 40.2 60.7 74.5 78.8 67.9 75.6 72.8 71.2 78.3 81.0 81.7 63.3 Mean 20.8 24.2 21.6 22.3 20.5 24.2 25.2 23.725.729.8 31.1 20.2 WATER TEMPERATURE (°C) Minimum 6.1 7.4 9.5 10.5 10.2 10.5 10.5 8.1 5.2 6.9 4.2 Maximum 9.6 10.713.4 16.9 18.8 18.9 23.6 19.2 13.4 12.1 10.6 Mean 8.2 9.1 10.4 12.6 13.6 13.8 15.0 11.9 9.8 9.77.1 0 2 4 6 8 10 12 14 0 50EpCO2 100 150 De pt h B G L (m ) 04/11/2004 21/01/2005 20/05/2005 20/09/2005 Site L5 0 2 4 6 8 10 12 14 0 50EpCO2 100 150 De pt h B G L ( m ) 22/11/2004 21/01/2005 Site L4
Fig. 12. EpCO2 sampled from borehole at site L4 and L5 in the Lambourn between winter 2004 and autumn 2005.
shallow boreholes in both catchments. The Blue Pool spring, for example, shows an increase in EpCO2 of approximately ten times the atmospheric equilibrium between May and September in 2004, a period in which mean river EpCO2
saw a comparable increase. This pattern is repeated in the Lambourn, where stream EpCO2 between L1 and L5 shows
good correlation with EpCO2 at Lynch Wood spring. This
effect may be due to mixing of surface and groundwater, and microbial activity within the hyporheic zone. The groundwater samples obtained from shallow boreholes at sites L4 and L5 in November 2004 (Fig. 10), indicate greater variability at depths of between 2 and 6 m at this time of year.
Conclusion
A better understanding of surface-groundwater interactions is crucial for the effective management of groundwater-fed rivers. To date, the description of such interactions has been limited by a lack of readily available data regarding the extent and nature of such interactions. In this study, it is suggested that a simple sampling strategy, together with a laboratory analysis method for calculation of EpCO2, could
improve understanding of surface-groundwater interaction in riparian areas of permeable lowland catchments.
Using measurements of river flow, pH, and average Gran alkalinity, semi-quantitative analysis to characterise the extent of surface-groundwater interaction in a catchment was achieved. The spatial variation in surface-water EpCO2
was related predominantly to flow accretion due to the inflow of CO2 rich groundwater. CO2 production and
consumption due to biological photosynthetic activity was not significant enough to mask the net difference in dissolved CO2 between most sites (max. diurnal variation in EpCO2 =
5.25). Changes in EpCO2 between sample sites could
therefore be related directly to the delivery of groundwater from diffuse or point-source locations in both the Lambourn and the Pang. The results indicate that the source of groundwater in these two catchments is of different origin. The Pang for example, exhibits higher levels of EpCO2 in
groundwater, spring water and stream water.
Seasonal variation of in-stream EpCO2 due to biotic
photosynthetic activity was greater in the Pang, but followed groundwater EpCO2 closely in both the Lambourn and Pang
again confirming a high level of surfacegroundwater interaction in these catchments. The assessment of the diurnal EpCO2 variation using high-resolution pH data
showed an early morning maximum and a mid-afternoon minimum. This is consistent with maximum respiration (release of CO2 into the water column) during darkness, and
photosynthesis (removal of CO2 from the water column)
during the daytime. Diurnal variation is at its highest in the spring/summer; which is consistent with the study by Neal
et al. (2002a) which shows that large diurnal patterns of
change in dissolved CO2 were maximal during the summer
months.
This paper assesses the dynamics of surfacegroundwater interactions, and thus, the extent of processes related to changes in dissolved CO2 in the Pang and Lambourn. This
new information on the spatial and temporal variability of EpCO2 in the Pang and Lambourn catchments at a number
of different scales may help in assessing the variability in calcite saturation of the rivers studied, which in turn may be used to describe the potential for phosphorous co-precipitation and the so-called self-cleansing potential of
Chalk rivers (Neal, 2001b, 2002). Similarly, as CO2
degassing affects the pH of water bodies, the estimates of dissolved CO2 may be a measure of the propensity of a
stream to carry metal contaminants relative to processes of dissolution and precipitation (Runkel et al., 1996).
This paper confirms the appropriateness of using a simple water sampling strategy to identify areas of increased surface-groundwater interaction in Chalk catchments. Such a method may well be a simple but effective tool in improving scientific understanding of catchment-scale processes of major aquifers in the UK, a need identified in the main objectives of the LOCAR project. This is particularly relevant for the study and management of water resources in lowland permeable catchments where competition in socio-economic demands can lead to increased stress on water-dependent ecology.
Acknowledgements
This work was funded by NERC under the LOCAR programme (grant reference NER/T/S/2001/00948). The authors are grateful to Prof. Colin Neal (CEH Wallingford) for assistance in laboratory analysis and provision of historic pH and alkalinity data for Tidmarsh.
References
Aldiss, D.T, Marks, R.J., Newell, A.J., Royse, K.A., Hopson, P.M, Farrant, A.R., Aspden, J.A., Napier, B., Wilkinson, I.P. and Woods, M.A., 2002. The geology of the Pang-Lambourn Catchment, Berkshire. British Geological Survey Commissioned Report, CR/02/298N. 38pp.
Allen,, D.J., Brewerton, L.J., Coleby, L.M., Gibbs, B.R., Lewis, M.A., MacDonald, A.M., Wagstaff, S.J. and Williams, A.T., 1997. The physical properties of major aquifers in England and Wales. British Geological Survey Technical Report WD/97/34, p 312, EA R&D Publication 8.
Banks, D., Davies, C. and Davies, W., 1995. The Chalk as a karstic aquifer: evidence from a tracer test at Stanford Dingley, Berkshire, UK. Quart. J. Eng. Geol., 28, S31S38.
Bradford, R.B., 2002. Controls on the discharge of Chalk streams of the Berkshire Downs, UK. Sci. Total Envir., 282/283, 6580. Brettal, E.J., 1971. Report on the Lambourn Valley Pilot Scheme
1967-1969. Thames Conservancy, Reading, UK.
Choi, J., Hulseapple, S.M., Conklin, M.H. and Harvey, J.W., 1998.
Modeling CO2 degassing and pH in a stream-aquifer system. J.
Hydrol., 209, 297310.
Cook, P.G., Favreau, G., Dighton, J.C. and Tickell, S., 2003. Determining natural groundwater influx to a tropical river using radon, chlorofluorocarbons and ionic environmental tracers. J. Hydrol., 277, 7488.
Edmunds, E.M., Darling, W.G., Kinniburgh, D.G., Dever, L. and Vachier, P., 1992. Chalk groundwater in England and France: hydro-geochemistry and water quality. British Geological Survey Research Report SD/92/2.
Elliot, T., Andrews, J.N. and Edmunds, W.M., 1999. Hydrochemical trends, palaeorecharge and groundwater ages in the fissured Chalk aquifer of the London and Berkshire Basins, UK. Appl. Geochem., 14, 333363.
Finlay, J.C., 2003. Controls of streamwater dissolved inorganic carbon dynamics in a forested watershed. Biogeochemistry, 62, 231252.
Genereux, D.P. and Hemond, H.F., 1992. Determination of gas exchange rate constants for a small stream on Walker Branch Watershed, Tennessee. Water Resour. Res., 28, 23652374. Grapes, T.R., Bradley, C. and Petts, G.E., 2005. Dynamics of
river-aquifer interactions along a chalk stream: the River Lambourn, UK. Hydrol. Process., 19, 20352053.
Grapes, T.R., Bradley, C. and Petts, G.E., 2006. Hydrodynamics of floodplain wetlands in a chalk catchment: The River Lambourn, UK. J. Hydrol., 320, 324341.
Griffiths, J., Binley, A., Crook, N., Nutter, J., Young, A. and Fletcher, S., 2006. Streamflow generation in the Pang and Lambourn catchments, Berkshire, UK. J. Hydrol., 330, 7183. Gustard, A., Bullock, A. and Dixon, J.M., 1992. Low flow estimation in the United Kingdom. Institute of Hydrol. Report No. 108, Wallingford, UK.
Hill, T. and Neal, C., 1997. pH, alkalinity and conductivity in runoff and groundwater. Hydrol. Earth Syst. Sci., 3, 381394. Howland, R.J.M., Tappin, A.D., Uncles, R.J., Plummer, D.H. and
Bloomer, N.J., 2002. Distributions and seasonal variability of pH and alkalinity in the Tweed Estuary. UK. Sci. Total Envir.,
251/252, 125138.
James, E.R., Manga, M., Rose, T.P. and Hudson, G.B., 2000. The use of temperature and the isotopes of O, H, C and noble gases to determine the pattern and spatial extent of groundwater flow. J. Hydrol., 237, 12.
Jacobson, R.L. and Usdowski, E., 1975. Geochemical controls on a calcite precipitating spring. Cont. Min. Pet., 51, 6574. Malcolm, I.A., Soulsby, C. Youngson, A.F., Hannah, D.M.,
McLaren, I.S. and Thorne, A., 2004. Hydrological influences on hyporheic water quality: implications for salmon egg survival. Hydrol. Process., 18, 15431560.
Maurice, L., Atkinson, T., Barker, J.A., Bloomfield, J., Farrant, A.R., and Williams, R.J. 2006. Karstic behaviour of groundwater in the English Chalk. J. Hydrol., 330, 6370.
Neal, C., 1988. Determination of dissolved CO2 in upland stream
water. J. Hydrol. Sci., 99, 127142.
Neal, C., 2001a. Alkalinity measurements within natural waters: towards a standardised approach. Sci. Total Envir., 265, 99 113.
Neal, C., 2001b. The potential for phosphorous pollution remediation by calcite precipitation in UK freshwaters. Hydrol. Earth Syst. Sci., 5, 119131.
Neal, C., 2002. Calcite saturation in eastern UK rivers. Sci Total Envir., 282, 31126.
Neal, C., Robson, A. and Smith, C.J., 1990. Acid neutralization capacity variations for the Hafren forest streams, Mid-Wales: inferences for hydrological processes. J. Hydrol., 121, 85101. Neal, C., Harrow, M. and Williams, R.J., 1998a. Dissolved carbon dioxide and oxygen in the River Thames: Spring-summer 1997. Sci. Total Envir., 210/211, 205211.
Neal, C., House, W.A. and Down, K., 1998b. An assessment of excess carbon dioxide partial pressures in natural waters based on pH and alkalinity measurements. Sci. Total Envir., 210/211, 173185.
Neal, C., House, W.A., Jarvie, H.P. and Eatherall, A., 1998c. The significance of dissolved carbon dioxide in major lowland rivers entering the North Sea. Sci. Total. Envir., 210/211, 187203. Neal, C., Neal, M., Wickham, H. and Harrow, M., 2000. The water
quality of a tributary of the Thames, the Pang, southern England. Sci. Total Envir., 251/252, 459475.
Neal, C., Watts, C., Williams R.J., Neal, M., Hill, L. and Wickham, H., 2002a. Diurnal and longer term patterns in carbon dioxide and calcite saturation for the River Kennet, south-eastern England. Sci. Total Envir., 282/283, 205231.
Neal, C., Jarvie, H.P., Williams, R.J., Neal, M., Wickham, H. and Hill, L., 2002b. Phosphorus-calcium carbonate saturation relationships in a lowland chalk river impacted by sewage inputs and phosphorus remediation: an assessment of phosphorus self-cleansing mechanisms in natural waters. Sci. Total Envir., 282/
283, 295310.
Neal, C., Skeffington, R., Neal, M., Wyatt, R., Wickham, H., Hill, L. and Hewitt, N., 2004a. Rainfall and runoff water quality of the Pang and Lambourn, tributaries of the River Thames, south eastern England. Hydrol. Earth Syst. Sci., 8, 601613. Neal, C., Jarvie, H.P., Wade, A.J., Neal, M., Wyatt, R., Wickham,
H., Hill, L. and Hewitt, N., 2004b. The water quality of the LOCAR Pang and Lambourn catchments. Hydrol. Earth Syst. Sci., 8, 614635.
NRFA, 2004a. National Rivers Flow Archive; Summary sheet for station 39019 Lambourn at Shaw [online]. Available from: http://www.nerc-wallingford.ac.uk/ih/nrfa/station_summaries/ 039/019.html [accessed 02/12/04]
NRFA, 2004b. National Rivers Flow Archive; Summary sheet for station 39027 Pang at Pangbourne. http://www.nerc-wallingford.ac.uk/ ih/nrfa/ station_ summaries /039/027.html [accessed 02/12/04]
Pinol, J. and Avila, A., 1992. Streamwater pH, alkalinity, pCO2,
and discharge relationships in some forested Mediterranean catchments. J. Hydrol., 131, 205225.
Raymond, P.A. and Cole, J.J., 2001. Gas exchange in rivers and estuaries: Choosing a gas transfer velocity. Estuaries, 24, 312 317.
Rodgers, P., Soulsby, C., Petry, J., Malcolm, I., Gibbons, C. and Dunn, S., 2004. Groundwater-surface-water interactions in a braided river: a tracer-based assessment. Hydrol. Process., 18, 13151332.
Runkel, R.L., McKnight, D.M., Bencala, K.E. and Chapra, S.C., 1996. Reactive solute transport in streams: simulation of a pH modification experiment. Water Resour. Res., 32/2, 419430.
Schurr, J.M. and Ruchti, J., 1977. Dynamics of O2 and CO2
exchange, photosynthesis and respiration in rivers from time-delayed correlations with ideal sunlight. Limnol. Oceanogr.,
22, 208225.
Simonsen, J.F. and Harremoes, P., 1978. Oxygen and pH fluctuations in rivers. Water Res., 12, 477489.
Wheater, H.S. and Peach, D., 2004. Developing interdisciplinary science for integrated catchment management: the UK LOwland CAtchment Research (LOCAR) programme. Int. J. Water. Res. Develop., 20, 369385.
Wilcock, R.J., Champion, P.D., Nagels, J.W. and Croker, G.F., 1999. The influence of aquatic macrophytes on the hydraulic and physio-chemical properties of a New Zealand lowland stream. Hydrobiologia, 416, 203214.
Worrall, F. and Lancaster, A., 2005. The release of CO2 from river
water the contribution of excess CO2 from groundwater.
Biogeochem., 76, 299317.
Younger, P.L. and Elliot, T., 1995. Chalk fracture system characteristics: implications for flow and solute transport. Quart. J. Eng. Geol., 28, S39S50.