HAL Id: hal-00304652
https://hal.archives-ouvertes.fr/hal-00304652
Submitted on 1 Jan 2002HAL is a multi-disciplinary open access archive for the deposit and dissemination of sci-entific research documents, whether they are pub-lished or not. The documents may come from teaching and research institutions in France or abroad, or from public or private research centers.
L’archive ouverte pluridisciplinaire HAL, est destinée au dépôt et à la diffusion de documents scientifiques de niveau recherche, publiés ou non, émanant des établissements d’enseignement et de recherche français ou étrangers, des laboratoires publics ou privés.
soft water lakes ? an assessment made by applying the
steady-state First-order Acidity Balance (FAB) model
Ø. Kaste, A. Henriksen, M. Posch
To cite this version:
Ø. Kaste, A. Henriksen, M. Posch. Present and potential nitrogen outputs from Norwegian soft water lakes ? an assessment made by applying the steady-state First-order Acidity Balance (FAB) model. Hydrology and Earth System Sciences Discussions, European Geosciences Union, 2002, 6 (1), pp.101-112. �hal-00304652�
Present and potential nitrogen outputs from Norwegian soft water
lakes – an assessment made by applying the steady-state
First-order Acidity Balance (FAB) model
Øyvind Kaste
1, Arne Henriksen
2and Maximilian Posch
31Norwegian Institute for Water Research, Southern Branch, Televeien 3, N-4879 Grimstad, Norway 2Norwegian Institute for Water Research, P.O. Box 173 Kjelsås, N-0411 Oslo, Norway
3National Institute for Public Health and the Environment (RIVM), P.O. Box 1, NL-3720 BA Bilthoven, The Netherlands
Email for corresponding author: [email protected]
Abstract
The steady-state First-order Acidity Balance (FAB) model for calculating critical loads of sulphur (S) and nitrogen (N) is applied to 609 Norwegian soft-water lakes to assess the future nitrate (NO3-) leaching potential under present (1992-96) S and N deposition. The lakes were separated into five groups receiving increasing levels of N deposition (<25, 25-49, 50-74, 75-99 and 100-125 meq m-2 yr-1). Using long-term sustainable N sink rates presently recommended for FAB model applications, N immobilisation, net N uptake in forests, denitrification and in-lake N retention were estimated for each group of lakes. Altogether, the long-term N sinks constituted 9.9±3.2 to 40.5±11.4 meq m-2 yr-1 in the lowest and highest N deposition categories, respectively. At most sites, the current N deposition exceeds the amount of N retained by long-term sustainable N sinks plus the NO3- loss via the lake outlets. This excess N, which is currently retained within the catchments may, according to the FAB model, leach as acidifying NO3- in the future. If these predictions are fulfilled, NO
3- leaching at sites in the various N deposition categories will increase dramatically from present (1995) mean levels of 1-20 meq m-2 yr-1, to mean levels of 7-70 meq m-2 yr-1 at future steady state. To illustrate the significance of such an increase in NO3- leaching, the mean Acid Neutralising Capacity (ANC) at sites in the highest N deposition category may decrease from -18±15 µeq L-1 at present, to -40±20 µeq L-1. Under present S and N deposition levels, the FAB model predicts that 46% of the Norwegian lakes may experience exceedances of critical loads for acidifying deposition. In comparison, the Steady-State Water Chemistry model (SSWC), which considers only the present N leaching level, estimates critical load exceedances in 37% of the lakes under the same deposition level. Thus far, there are great uncertainties regarding both the time scales and the extent of future N leaching, and it is largely unknown whether the FAB model predictions will ever be fulfilled. Hence, long-term monitoring and further studies on N immobilisation processes under varying N deposition levels and ecosystem types seem necessary to make better predictions of future NO3- leaching.
Key words: Lakes, hydrochemistry, nitrogen, nitrate, sinks, leaching, acidification, critical loads, FAB model
Introduction
Surveys of nearly 500 lakes in Norway conducted in both 1986 and 1995 have revealed widespread chemical recovery, mainly due to a 40% decrease in sulphate concentrations (Skjelkvåle et al., 1998). During the same period, there have been no significant changes in NO3- concentrations in any part of the country, even though stores of N in catchments have increased due to several decades of elevated N deposition and retention. A crucial question is whether this N accumulation is sustainable over time, or is mobilisation of NO3- and resultant acidification of surface waters to be
expected in the future (Skeffington and Wilson, 1988; Aber
et al., 1989). This is one of the main issues faced in
determining critical loads of acidity and the designing of future control strategies to reduce adverse effects of regional and transboundary air pollution (Posch et al., 1999).
Two models – one empirical and one process-oriented – are commonly used to calculate critical loads of acidifying deposition (S and N) for surface waters (Henriksen and Posch, 2001). The empirical Steady-State Water Chemistry (SSWC) model allows the calculation of critical loads of acidity and their exceedances for any S deposition scenario,
given the present N leaching level (UBA 1996; Henriksen and Posch, 2001). The SSWC model does not consider any other N leaching scenarios since no equations on N sources and sinks are included. These are, however, included in the process-oriented First-order Acidity Balance (FAB) model, which calculates separate critical loads of S and N and their exceedances for any scenario of S and N deposition (Posch
et al., 1997; Henriksen and Posch, 2001). Both models use
the same approaches for calculating the pre-acidification leaching of non-marine base cations and also the same ANClimit, the lowest ANC flux that does not damage selected biota. During the negotiations for the new multi-pollutant, multi-effect protocol signed in Gothenburg in December 1999 (UN/ECE, 2000), the FAB model was used as a basis for calculating critical loads for surface waters.
In contrast to the SSWC model, which considers only the present NO3- leaching, the FAB model also takes into account anticipated long-term sustainable N sinks in the terrestrial catchment and in lakes. The model to a great extent proposes a “worst case” scenario by assuming that all N inputs not retained by long-term sustainable N sinks will be leached as NO3- sometime in the future. At present, the N leaching predicted by the FAB model is much higher than the actual leaching at Norwegian lake sites (Henriksen et
al., 1998). However, whether the present N accumulation
is sustainable in the long term (Vitousek et al., 1997) is largely unknown.
In Norway, two large databases are commonly used for whole-country or regional assessments of critical load exceedances in surface waters. One is the Norwegian critical load database, which divides the country into 2305 grid squares each covering about 12 x 12 km in southern Norway and a decreasing grid width at higher latitudes (Henriksen and Buan, 2000). Applying the SSWC and FAB models to this database, Henriksen and Buan (2000) found that between 1992 and 1994, the critical load of acidity in surface waters was exceeded in 20 and 29% of the land area, respectively. The other is a lake database, including 1006 statistically selected lakes covering the whole country, sampled during the autumn of 1995 as part of a joint Northern European lake survey (Henriksen et al., 1998). Applying the SSWC model to these lakes showed that 29% of the lakes had exceedance of critical loads at 1990 S and N loading (Henriksen et al., 1997).
In this paper, the Norwegian 1995 lake database has been used to:
z Apply the FAB model to assess the significance of anticipated long-term sustainable N sinks vs. present N deposition and N leaching level in Norwegian lakes and their catchments.
z Estimate potential N leaching in the future and evaluate its possible consequences for water chemistry and exceedances of critical loads for acidifying deposition.
N sinks included in the FAB model
The FAB model is derived in Posch et al. (1997) and further refinements are given in Henriksen and Posch (2001). The charge balance (acidity balance) underlying the model can be written as:Ndep + Sdep = Ni + Nu + Nde + Nlake + Slake + BCle – ANCle, crit(1) where Ndep and Sdep are acidifying deposition, Ni – anticipated long-term sustainable nitrogen immobilisation in soils, Nu — nitrogen uptake by trees, Nde — soil denitrification, Nlake — in-lake nitrogen retention, Slake — in-lake sulphur retention, BCle — base cation leaching from catchment and ANCle, crit — the lowest ANC flux that does not damage selected biota (ANClimit). The term BCle minus ANCle, crit is analogous to the critical load of acidity for surface waters, CLA. In this paper, BCle and ANCle, crit are estimated from present water quality data as outlined in UBA (1996) and Henriksen and Posch (2001). Exceedance of critical loads, ExA, is calculated as the actual S and N leaching minus CLA. Equations and recommended values for the N sink processes included in the model are listed in the sections below. In-lake S retention is estimated using the same equations as for in-lake N retention, but with a mass transfer coefficient which is an order of magnitude lower than for N (Dillon and Molot, 1990; UBA 1996).
N immobilisation: The long-term sustainable immobilisation
of N (Ni) denotes the continuous build-up of stable C and N compounds in forest soils since the last glacial period (Rosén
et al., 1992). This is assumed to be net N immobilisation,
including N fixation. The equation included in the FAB model is written as:
Ni = xi (1 – d o A
A ) (2)
where xi is an anticipated long-term sustainable immobilisation rate of N (meq m-2 yr-1) in the catchment soils and Ao:Ad the lake:catchment area ratio (km2 km-2). N uptake: The FAB model considers only the net uptake in
forests, i.e. the amount of N removed from the catchment by harvesting (UBA, 1996). N uptake is calculated as:
where xu is the mean net N uptake in forests (meq m-2 yr-1), and ffor is the fraction of forest within the catchment (km2km-2). N uptake in forests can be computed from the average amount of N in the harvested biomass, divided by the rotation period (in years).
Denitrification: The amount of N removed from the
terrestrial catchment by denitrification (Nde) (meq m-2 yr-1) is calculated by multiplying the sum of available N (from atmospheric deposition) after N immobilisation and N uptake by a denitrification fraction (fde).
Nde = fde (Ndep – Ni – Nu) (1 – d o A
A ) (4a)
This implies that Ni and Nu are considered to remove N faster than Nde (DeVries et al., 1994). The denitrification fraction (fde) is assumed dependent on the soil type and its moisture status (DeVries et al., 1994). A commonly used simplification in FAB applications has been to estimate fde from the fraction of peatlands in the catchment (fpeat) (Posch
et al., 1997):
fde = 0.1 + 0.7 fpeat (4b)
In-lake N retention: The FAB model considers the potential
in-lake retention (Nlake), assuming that all deposited N not exported to the lake is retained by long-term sustainable N sinks in the terrestrial part of the catchment. Nlake (in meq m-2 yr-1) is estimated from the N inputs to the lakes times an estimated in-lake N removal coefficient (RN):
Nlake = RN (Ndep – Ni – Nu – Nde) (5a) RN (the proportion of the N input retained in the lake) is modelled by a kinetic equation derived by Kelly et al. (1987):
RN = (5b)
where SN (m yr-1) is a net mass transfer coefficient (or settling velocity) for N in the lake and qs the areal water load (per unit area of lake) (m yr-1). The S
N value used in FAB applications thus far, has been adopted from long-term studies of lakes in Canada and the eastern US (Kelly et al., 1987; Dillon and Molot, 1990). The qs variable can be calculated from the catchment runoff (m yr-1), divided by the lake:catchment area ratio (km2 km-2):
(
o d)
s A / A Q q = (5c)If either the actual NO3- input or output flux (meq m-2 yr-1) from the lake is known, the present in-lake N retention (Nlake2) can be estimated from
Nlake2 = NO3 (in) RN or N N ) out ( 3 2 lake R R 1 NO N − = (6)
Input data and parameter values
THE LAKE DATABASEThe material includes water chemistry data from a Norwegian survey in 1995 of 1006 statistically selected lakes covering the whole country (Henriksen et al., 1998). All lakes were sampled after autumn overturn in October/ November 1995. In addition to water chemistry data, the lake database includes catchment characteristics, point sources, hydrology and atmospheric deposition. Lake and catchment areas are measured from topographical maps, while the fractions of various land-cover types (forest, peat, lakes, arable) and atmospheric deposition have been obtained from digital maps and databases at the Norwegian Institute for Air Research (Tørseth and Semb, 1998). The mean catchment runoff (1961-90) at each site is obtained from a hydrological database operated by the Norwegian Water Resources and Energy Directorate (NVE).
A sorting procedure was performed to exclude lakes with (a) significant settlement or agricultural activities in the catchment, (b) catchments >100 km2, (c) upstream lakes with accumulated surface areas >100% of that characterising the lake at the catchment outlet, (d) total phosphorus > 10 µg L-1, and (e) calcium >10 mg L-1. This reduced the lake population from 1006 to 609 sites. Subsequently, the sites were separated into five groups receiving increasing levels of N deposition (< 25, 25–49, 50–74, 75-99 and 100–125 meq m-2 yr-1).
All water samples were analysed unfiltered at NIVA for several variables, of which nitrate (NO3-), ammonium (NH4+), total nitrogen (TN), pH, and total organic carbon (TOC) are presented in this paper. NO3-, NH
4+ and TN (after oxidation with peroxodisulphate) were analysed by automated colorimetry. TOC was analysed by spectophotometry after UV-oxidation. NH4+ was analysed at only 145 lake sites where concentrations were expected to be measurable due to possible influences from settlement and agriculture. After the sorting procedure, the number of lakes with NH4+ data was reduced to 38 (6% of the 609 remaining lakes). Organic N (TON) is defined as TN minus NO3- and NH
4+. At sites with no NH4+ data available, TON was estimated as TN minus NO3- and the median NH4+concentration within each N deposition category. Acid Neutralising Capacity (ANC) was calculated as the SN
equivalent sum of base cations (Ca2+, Mg2+, Na+, K+) minus the equivalent sum of strong acid anions (Cl-, SO
42-, NO3-). Fluxes of chemical compounds were calculated from the 1995 water chemistry data and the 1961-90 mean catchment runoff (m yr-1) at each site.
Catchment characteristics aggregated to N deposition class are presented in Table 1. About 66% of the lakes are located in areas with relatively low N deposition (<50 meq m-2yr-1), whereas 15% of the lakes are located in the most heavily affected areas in southernmost and southeastern Norway (N deposition ≥75 meq m-2 yr-1) (Tørseth and Semb, 1998). The most acid sensitive lakes (lowest critical load) are mainly located in the highest N deposition areas (Table 1). In consequence, these lakes are most affected by acidification. The marked distribution of acid-sensitive lakes in the southernmost and southeastern Norway, where the acid deposition is highest, largely explains why Norway is massively affected by surface water acidification. TOC fluxes were highest at the high N deposition sites (>50 meq m-2 yr-1), even though there was no significant correlation between these two variables.
Uncertainties in the input data are associated mainly with the estimation of chemical fluxes and N deposition. Chemical fluxes incorporate uncertainties in water discharge estimates and chemical sampling strategy. Analytical uncertainties are believed to be of minor importance in this context. Since water discharge has not been measured at the study sites, chemical flux estimates are based on the 1961–90 mean catchment runoff at each site. This inevitably
introduces an error in the estimates of annual fluxes at each individual site, but should give fairly reliable estimates when considering aggregated lake data and steady-state conditions. All lakes were sampled shortly after autumn overturn, which gives a relatively good estimate of the annual mean concentrations of chemical solutes (Henriksen
et al., 1988; 1998). The atmospheric deposition data are
interpolated from fixed sites to a regular grid by kriging interpolation, which is a statistical method that can be used to estimate unknown data from neighbouring measurements (Tørseth and Semb, 1998). The uncertainties associated with this operation and the application of grid-based deposition data on individual lakes in this paper are not quantified (Kjetil Tørseth, pers. comm.).
PARAMETER VALUES REFLECTING TERRESTRIAL AND AQUATIC N RETENTION
For the estimation of long-term sustainable N immobilisation in the soils (Ni), a fixed value of 3.6 meq m-2 yr-1 (0.5 kg N ha-1 yr-1) was used. This value represents the lower end of the range (0.5 to 1.0 kg ha-1 yr-1) presently recommended for European critical load calculations (UBA, 1996). Values reflecting N uptake (Nu) are based on inventory results in 560 plots in a 9 × 9 km national grid, provided by the Norwegian Institute of Land Inventory (NIJOS) (Frogner
et al., 1994). According to this database, Nu values in forests may reach 50 meq m-2 yr-1 in southern Norway and 25 meq m-2 yr-1 in northern Norway. There is a significant
Table 1. Site characteristics (arithmetic mean ± standard deviation) along an N deposition gradient (in meq m-2 yr-1). Abbreviations: n – number of sites, Ad – catchment area, Ao – lake area, ffor – forest fraction, fpeat – peat fraction, Q – catchment runoff, Ndep – N deposition, Sdep – S deposition, and CLA – critical loads of acidity. Deposition data cover the period 1992-1996 (Tørseth and Semb, 1998). Water chemistry data are from the Norwegian lake survey 1995 (Henriksen et
al., 1998). Critical loads of acidity are calculated by the SSWC model (UBA, 1996; Henriksen and Posch, 2001).
Ndep (meq m-2 yr-1) <25 25-49 50-74 75-99 100-125 All
n 229 170 116 42 52 609 Ad (m2) 5.4±12.7 5.5±11.1 4.2±10.7 3.3±8.6 3.1±6.2 4.9±11.2 Ao:Ad ratio (m2 m-2) 0.13±0.08 0.12±0.10 0.14±0.08 0.15±0.08 0.15±0.08 0.13±0.09 ffor (“) 0.19±0.29 0.18±0.31 0.34±0.38 0.30±0.39 0.16±0.28 0.22±0.32 fpeat (“) 0.04±0.08 0.03±0.07 0.02±0.04 0.02±0.03 0.02±0.03 0.03±0.07 Q (m yr-1) 1.07±0.55 1.42±0.94 1.72±0.99 2.03±0.81 2.15±0.57 1.45±0.87 Sdep (meq m-2 yr-1) 15.1±6.3 21.1±4.2 37.2±4.8 53.5±3.0 63.3±2.4 27.7±16.4 Ndep (“) 16.7±4.7 34.5±7.0 62.1±6.9 92.9±7.3 112.0±3.4 43.7±31.0 CLA (“) 99.1±112.7 64.9±74.4 48.4±46.1 50.2±120.8 23.7±19.0 70.1±91.3 ANC (“ ) 100.0±122.1 56.0±94.5 21.0±56.0 15.6±124.7 -39.9±32.5 54.9±108.0 H+ ( “) 0.9±1.7 3.3±13.3 9.2±10.7 14.4±10.5 30.7±14.4 6.6±12.9 TOC (mmol m-2 yr-1) 179±235 177±192 280±232 256±245 379±244 220±233
(p<0.01) relationship between Nu and latitude, and rough estimates of mean Nu in the lake database are made on the basis of this regression line. According to this, mean Nu values in forested areas are around 15 meq m-2 yr-1 (2.1 kg ha-1 yr-1) in southernmost Norway and approximately 8 meq m-2 yr-1 in northernmost Norway. These estimates are in the lower end of the range previously suggested for boreal forests in Europe (UBA, 1996).
In-lake N retention is estimated by applying a mean SN value of 5 m yr-1, which is obtained from long-term studies of lakes in Canada and the eastern US (Kelly et al., 1987; Dillon and Molot, 1990). This is the same value as earlier recommended for FAB applications in Europe (UBA, 1996). For application of the FAB model to non-headwater lakes, Hindar et al. (2001) compared three different approaches to include in-lake N retention. These were (a) the “one-lake approach”, which only considers the lake at the catchment outlet, (b) the “big-lake” approach, which treats all lakes in the system as a single lake situated near the catchment outlet, and (c) the “lake system” approach, which treats each lake and sub-catchment separately. In a study performed in the Killarney Provincial Park, Canada, the “big-lake” and “lake system” methods increased the average in-lake N retention estimates by 47% and 73%, respectively, in comparison to the “one-lake” approach” (Hindar et al., 2001). In Norway, where lake water residence times usually are shorter than in Canada (Ontario), the differences in model results using the three approaches are assumed to be smaller. In the present study, in-lake N retention is estimated by the “big-lake approach”. About 40% of the sites included in the present study are headwater lakes, while the remaining sites have upstream lakes with an accumulated surface area of maximum 100% of the primary lake at the catchment outlet. This limit was introduced to reduce errors in the Nlake estimates due to N retention in upstream lakes.
The parameter values reflecting long-term sustainable terrestrial and aquatic N sinks will have associated errors which can be reduced only if further empirical studies that
can improve the basis for specifying process rates on a spatial and temporal scale (Curtis et al., 2000). In addition to the uncertainties associated with input data and parameter values, the FAB model also includes uncertainties due to model structure, process equations and the relationships between water chemistry and aquatic biota (critical limits). The various uncertainty types were evaluated previously in connection with FAB applications to Finnish lakes (Kämäri
et al., 1993; Posch et al., 1993). Despite the large uncertainty
in some of the model parameters and input data, the resulting ranges of critical loads were narrow enough, in most cases, to draw meaningful conclusions on lake/catchment sensitivity to acidifying deposition.
Results
N LEACHING ALONG AN N DEPOSITION GRADIENT
NO3- concentrations and fluxes from the 609 lakes were positively correlated to N deposition, r2=0.51 and r2=0.44, respectively (p<0.01). When arranging the sites into groups according to N deposition level, mean NO3- fluxes increased from nearly zero in the lowest deposition category to 20.4±9.9 meq m-2 yr-1 at sites with the highest deposition (Table 2). In the most heavily affected category, surface water NO3- fluxes corresponded to over 30% of the non-marine sulphur (SO4*) flux. This implies that NO3- under present conditions plays a significant role in the acidification of these lakes.
At lake sites where NH4+ data are available, NH 4+ concentrations showed a weak positive correlation with N deposition (r2=0.20, p<0.01, n=38), although the concentration level generally was very low (≤ 2 µeq L-1 in 33 of 38 samples). The median NH4+ flux ranged from 0.4 meq m-2 yr-1 in the lowest N deposition category to 4.6 meq m-2 yr-1 at high deposition sites. NH
4+ concentrations generally were much lower than NO3- concentrations, corresponding to 14-40% of NO3- in the various N deposition Table 2. N fluxes from the lake outlets (meq m-2 yr-1) along the N deposition gradient. Arithmetic mean values± standard deviation. NH4+ fluxes are estimated from a limited number of samples (3-20 sites within each N deposition category). Chemical data are from Henriksen et al. (1998).
Ndep (meq m-2 yr-1) <25 25-49 50-74 75-99 100-125 All
NO3- flux (
“) 1.0±1.5 4.4±7.6 9.7±8.2 13.8±9.5 20.4±9.9 6.1±8.9 NH4+ flux (
“) 0.4 0.6 2.0 2.2 4.6 1.2
TON flux (mmol m-2 yr-1) 6.2±5.7 7.0±6.8 9.2±7.2 8.7±7.6 12.3±8.6 7.7±6.9 TN flux (“) 7.6±5.7 11.9±10.3 20.9±9.6 24.7±10.1 37.3±11.0 15.1±12.5
categories. The highest relative importance of NH4+ was found at low deposition sites where NO3- concentrations were low.
At many sites, TON constituted a considerable fraction of TN in the lake outlets, varying from 78±23% in the lowest N deposition category to 33±20% in the highest N deposition category. In contrast, the relative contribution of NO3- to TN increased from 14±21% in the lowest N deposition category, to 54±21% in the two highest N deposition categories. Hence, NO3- was the dominant N species when N deposition exceeded 50-75 meq m-2 yr-1. There was no significant relation between TON export and N deposition (p>0.1). TON concentrations were, however, positively correlated to the concentration of TOC in the 609 study lakes (r2=0.78, p<0.01). Hence, the TON flux, to a large extent, appears to be uncoupled from the short-term input-output N balance, but is closely related to TOC status in the catchments.
QUANTIFICATION OF TERRESTRIAL AND AQUATIC N SINKS
Whereas the long-term N immobilisation in soils (Ni) and the N uptake by forests (Nu) is assumed to be independent of N deposition, both denitrification (Nde) and in-lake N retention (Nlake) are assumed to be functions of N deposition.
The only factor leading to variation in the Ni estimates is the terrestrial fraction of the catchments (Eqn. 2), whereas latitude and the forest fraction in each catchment solely determine the Nu estimates (Eqn. 3). This implies that the relative importance of Nde and Nlake as long-term N sinks increases with N loading.
At the low N deposition sites (< 25 meq m-2 yr-1), all quantified N sink processes were of comparable magnitude, 1.2±0.9 to 3.5±2.0 meq m-2 yr-1 (Table 3). At sites receiving the highest N loading (100-125 meq m-2 yr-1), N
lake appeared to be the most important N sink, reaching 25.0±10.5 meq m-2 yr-1. This corresponded to over 60% of all quantified long-term N sinks in this category, whereas Ni, Nu and Nde, accounted for 7, 6 and 25%, respectively.
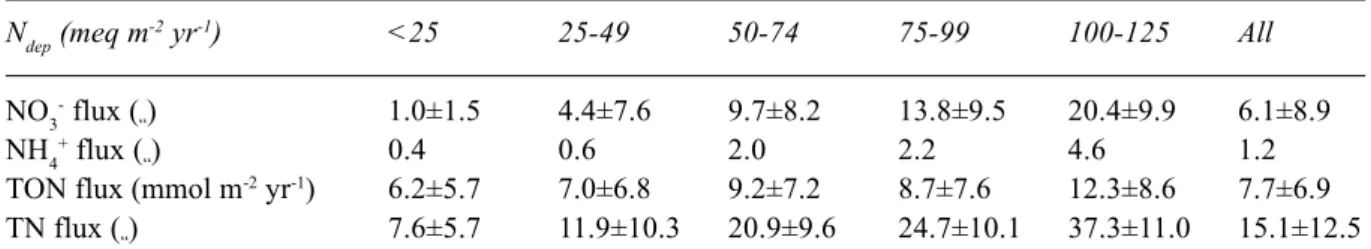
At most sites, the current N deposition exceeds the amount of N retained by long-term sustainable N sinks plus the NO3 -loss via the lake outlets (Tables 2 and 3). This excess N retention was positively correlated to N deposition (r2=0.78, p<0.01, n=609) and increased from 5.9±3.7 meq m-2 yr-1 in the lowest N deposition category to 51.1±12.8 meq m-2 yr-1 at sites receiving the highest N deposition. If this fraction of N deposition starts to leach as NO3- in the future, NO
3 -fluxes in the most heavily affected areas may increase to levels around 70 meq m-2 yr-1 (Fig. 1). This is 3.5 times the present NO3- leaching at these sites.
0 20 40 60 80 0-24 25-49 50-74 75-99 100-124
N deposition gradient, meq m-2 yr-1
N flux, meq m
-2 yr
-1
Present NO3 leaching Potential NO3 leaching
Fig. 1. Present (1995) NO3- leaching at 609 Norwegian lake sites and FAB model prediction of potential NO3- leaching (steady-state) under present (1992-96) N deposition levels. Standard deviation is indicated by vertical bars.
Discussion
In the FAB model, the acidifying potential of N is expressed as N deposition minus the sum of N sinks presumed to be sustainable in the long term. Some of this N is already leaching as NO3- and causes acidification today (Table 2), whereas the remainder presently is accumulated within the catchments. The long-term stability of this N retention fraction is largely unknown (Vitousek et al., 1997; Wright, 1998). Thus, a crucial question is whether the present N accumulation rate can proceed into the future, or if the ecosystems gradually or suddenly will become N saturated (Skeffington and Wilson, 1988; Aber et al., 1989).
PRESENT N RETENTION CAPACITY v. LONG-TERM SUSTAINABLE N SINKS
Most ecosystems — especially those located in high-deposition areas — presently retain more N than reflected in the long-term N sinks recommended for FAB model applications (Rosén et al., 1992; Curtis et al., 2000). According to combined input-output and process studies in forested catchments, a significant fraction of this excess N accumulation can be ascribed to N immobilisation in the soil organic pool (Gundersen et al., 1998a; Kjønaas et al., 1998). At two forested catchments in SW Norway receiving N deposition levels of 115-175 meq m-2 yr-1, Mulder et al. (1997) ascribed 51-81% of the net N retention to Ni. This is substantially higher than the long-term Ni values of approximately 3.0 meq m-2 yr-1 that were estimated for the various N deposition categories in the present study (Table 3). Hence, the FAB model suggests that a considerable fraction of the present N accumulation must be regarded as non-sustainable in the long term.
Denitrification rates (Nde) generally are low in well-drained soils, such as those often characteristic for forest and heathland sites. Data from several forested sites within the NITREX project (“Nitrogen saturation experiments”)
indicated Nde fluxes in the range 0.5-3.6 meq m-2 yr-1 (Gundersen et al., 1998a). Bogs and wetlands are often characterised by much higher Nde values, in some cases >150 meq m-2 yr-1 (UBA, 1996). However, such ecosystem types usually occupy only small areas within a catchment (on average 3% in the present data material; Table 1). The Nde estimates generated from this study were about an order of magnitude higher than values usually measured in forests, but well within the range reported earlier for mixed ecosystems in boreal and temperate regions (UBA, 1996). Hence, Eqn. 4 probably gives quite reasonable Nde estimates for the Norwegian sites at the ambient N deposition level. In areas experiencing higher N loading (as e.g. in central Europe), Nde estimates calculated by Eqn. 4 might, however, be much higher than the current values measured in soils (Curtis et al., 1998, 2000). A possible reason for the low Nde values measured under present conditions may be that current high Ni rates reduce the supply of N for denitrification. However, in recent FAB applications to UK sites Curtis et al. (1998, 2000) decided to use fixed Nde values for certain soil types, independent of N deposition, to obtain better conformity between estimated v. currently observed Nde values.
In-lake N retention (Nlake) values estimated by the FAB model are based on the assumptions that all N not retained by long-term sustainable terrestrial N sinks will be exported to the lakes as NO3-, and that in-lake N removal rates are first-order reactions (proportional to the input concentrations). The first assumption is the main principle behind the FAB model, whereas the second is supported by a number of Canadian lake studies, which demonstrate that NO3- reduction rates increase with input concentrations (Kelly et al., 1987). Thus, the Nlake value can be regarded as potential in-lake N retention given the increases in NO3 -leaching predicted by the FAB model. When estimating Nlake, the FAB model applies a mean mass transfer coefficient for NO3- (S
NO3), obtained from long term-studies of lakes in Table 3. Long-term sustainable N sinks estimated from 1995 water chemistry (Henriksen et al., 1998),
1992-1996 deposition data (Tørseth and Semb, 1998) and default values presently recommended for FAB model applications.
Ndep (meq m-2 yr-1) <25 25-49 50-74 75-99 100-125 All
Ni (“) 3.1±0.3 3.1±0.4 3.1±0.3 3.0±0.3 3.0±0.3 3.1±0.3 Nu (“) 2.0±3.0 2.3±4.1 4.7±5.3 4.3±5.5 2.3±4.1 2.8±4.2 Nde (“) 1.2±0.9 3.1±1.4 5.2±1.3 8.1±1.6 10.2±2.4 3.7±3.1 Nlake (“) 3.5±2.0 8.4±5.3 15.2±7.1 21.0±9.1 25.0±10.5 10.1±9.1
Canada and the US (Kelly et al., 1987; Dillon and Molot, 1990). According to new data from Norwegian lakes and prolonged time series from Canadian lakes, the mean SNO3 value adopted by the FAB model (5 m yr-1) seems representative for lakes spanning a wide range in N inputs and hydrological conditions.
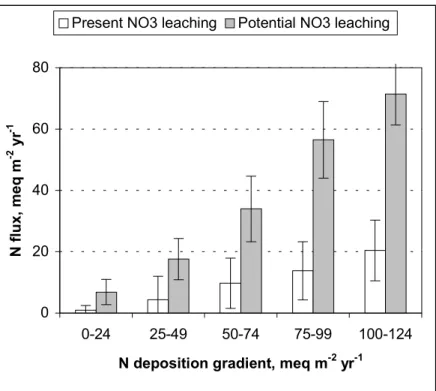
At the Norwegian lake sites, the Nlake values estimated by the FAB model generally were much higher than the current in-lake retention (Nlake2) estimated from observed NO3 -leaching and Eqn. 6 (Fig. 2). In fact, the predicted mean Nlake value at sites receiving the highest N loading was more than three times higher than the mean Nlake2 value. Hence, it seems evident that lakes have a large potential in reducing negative effects from possible increases in terrestrial N leaching from catchments in high-deposition areas. According to the theoretical future steady state predicted by FAB, the potential in-lake retention at sites receiving N deposition higher than 50 meq m-2 yr-1 may exceed the sum of all long-term terrestrial N sinks (Table 3). When taking into account that lakes within these N deposition categories cover only 13-15% of the total catchment area, FAB suggests that the aquatic ecosystems at these sites may become several times more efficient in retaining N (per unit of surface area) at future steady state than the terrestrial parts.
THE ROLE OF NH4+ AND TON
The FAB model considers only the leaching of NO3- and not NH4+ and TON. It is assumed that the deposited NH
4+ is taken up (preferentially) by vegetation, and — what is not taken up — is nitrified (Posch et al., 1997). In general, this is confirmed at most experimental and monitoring sites by the fact that NH4+ is found rarely in appreciable amounts in soil leachate or in the runoff.
In contrast to NH4+, TON constitutes a significant fraction of TN outputs at the study sites (Table 2). However, TON is not an ion and therefore does not enter the charge balance, from which the FAB model is derived. If TON is to be included in the FAB model, it has to be considered a sink of N — such as immobilisation, for example — irrespective of whether it is exported with the runoff or stays in the catchment. This would result in a corresponding decrease in the present estimates on critical load exceedances. It is, however, important to avoid double counting: The terms in the FAB model which account for the amount of N that is immobilised in the catchment or retained in lake sediments might already contain the N which is leaving the catchment as TON.
On the basis of mainly Norwegian data from small, calibrated catchments, national lake surveys and large-scale 0 10 20 30 40 0-24 25-49 50-74 75-99 100-124
N deposition gradient, meq m-2 yr-1
In-lake N retention, meq m
-2 yr
-1
Present retention Potential retention
Fig. 2. Present (1995) and potential in-lake N retention at the Norwegian lake sites
estimated by Eqns. 5 and 6 under present (1992–96) N deposition levels. The FAB model considers the potential in-lake N retention when calculating critical load
N addition experiments, Wright et al. (1997) found no significant relationship between N deposition and TON runoff. Also in the present study, which partly overlaps the lake surveys included by Wright et al. (1997), TON fluxes showed no correlation with N deposition, while about 80% of the variance could be explained by the TOC concentrations. Thus, it does not seem reasonable to regard TON as a part of the short-term inorganic N cycle, since a large fraction of TON leaching today may be due to ancient N deposition, N fixation or weathering. On the other hand, it seems likely that the TON leached is derived from previously immobilised N in the soils and is released at a fixed rate over time. This suggests that the long-term immobilisation of inorganic N in soils (Ni) might be underestimated and — even if derived from ancient sources — TON may still represent a “missing sink” in the FAB model.
CONSEQUENCES FOR LAKE WATER QUALITY IF THE FAB PREDICTIONS ARE FULFILLED
If the future rate of N immobilisation decreases according to the FAB model predictions, it may involve dramatic consequences for aquatic ecosystems. Under present (1992–
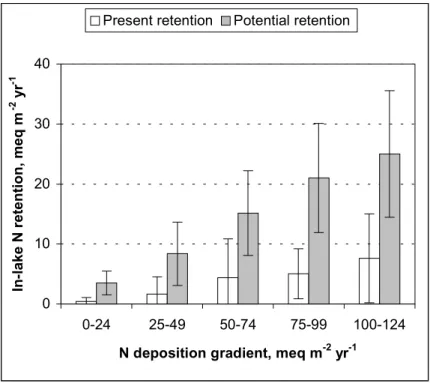
96) N deposition, NO3- leaching at sites in the highest N deposition category (100–125 meq m-2 yr-1) may increase by a factor of 3.5, from about 20 meq m-2 yr-1 at present to more than 70 meq m-2 yr-1 at future steady state (Fig. 1). In these already heavily acidified catchments, NO3- leaching from the terrestrial ecosystem will be accompanied by H+, Aln+ and base cations. The ratio of change in non-marine base cation concentrations due to changes in strong acid anion concentration can be simulated by the empirical F-factor (Henriksen and Posch, 2001). Under present (1992– 96) S and N deposition, the predicted NO3- increase within the highest N deposition category may involve reductions in average ANC values from -18±15 µeq L-1 at present, to –40±20 µeq L-1 at future steady state (Fig. 3). Within the groups receiving intermediate amounts of N deposition (50–74 and 75–100 meq m-2 yr-1), ANC would decrease from mean levels of 32 and 10 µeq L-1 to 19 and –10 µeq L-1. This probably would lead to extensive reductions of brown trout populations, which have critical ANC limits around 0–20 µeq L-1 (Lien et al., 1996). In addition to increased acid stress/damages to freshwater organisms, the predicted increase in surface water NO3- fluxes would cause a significant increase in the N loading on coastal marine areas (Hessen et al., 1997). -50 0 50 100 150
N deposition gradient, meq m-2 yr-1
ANC, µeq L
-1
Present ANC Predicted ANC
0-24 25-49 50-74 75-99 100-124
Fig. 3. Present (1995) ANC values at the Norwegian lake sites and FAB model prediction of
In a FAB application to 13 catchments in the UK, Curtis
et al. (1998) predicted a mean increase in NO3- losses by 10.5 kg ha-1 yr-1 (75 meq m-2 yr-1) from the ambient level of 5.4 kg ha-1 yr-1 (39 meq m-2 yr-1). The most significant effects of increased NO3- concentrations were found at sites where current ANC values were less than 100 µeq L-1. Here, the predicted increase in NO3- concentrations would reduce ANC to around zero. The UK sites investigated by Curtis et al. (1998) leach, on average, nearly twice as much NO3- as the Norwegian high-deposition sites today. In comparison, the ambient N deposition at the UK sites (mean 146 meq m-2 yr-1) is about 30% higher than at the Norwegian high-deposition sites. However, the estimated long-term N sinks at the UK sites and the Norwegian high-deposition sites were of comparable magnitude (33 v. 41 meq m-2 yr-1), such that the relative difference in the NO3- leaching potential seem largely to be reflected by the N deposition level.
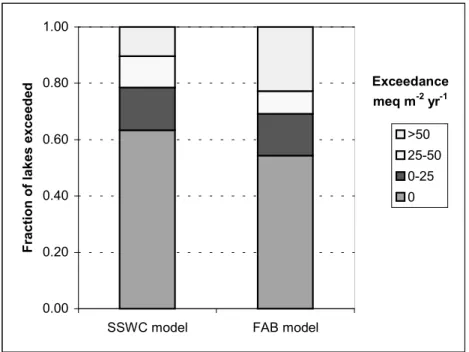
Under present (1992–96) S + N deposition and N leaching level, the SSWC model estimates that 37% of the Norwegian lakes may experience exceedances of critical loads for acidifying deposition at future steady state (Fig. 4). About 10% of these may exhibit exceedances higher than 50 meq m-2 yr-1. With increased NO
3- leaching as predicted by the FAB model, the number of exceeded lakes might increase to 46% at future steady state (Fig. 4). Of these, 23% may experience exceedances higher than 50 meq m-2 yr-1. This scenario will surely be modified before 2010, due to reduced
S emissions following the second sulphur protocol (UN/ ECE, 1994) and also the implementation of the multi-pollutant, multi-effect protocol (UN/ECE, 2000), which for the first time entails reductions of N emissions in Europe.
WILL THE FAB PREDICTIONS EVER BE FULFILLED?
At present, it seems difficult to decide whether long-term terrestrial N sinks included in the FAB model are underestimated, or if the present N accumulation level may be just a temporary and non-sustainable phenomenon. There is a possibility that some permanent N retention processes may have been omitted in the FAB model (e.g. TON leaching derived from N previously immobilised in the soils). The greatest uncertainty, however, seems to be associated with the sustainability of present N accumulation rates in terrestrial ecosystems.
Even though the current N retention seems to increase with increasing N deposition (Table 3), there was also a clear positive relationship between N deposition level and NO3- outputs in the present material (Table 2). Several studies have demonstrated a close relationship between N deposition level, soil N status and NO3- leaching (Stoddard, 1994; Dise and Wright, 1995; Tietema et al., 1998). In high-deposition areas, there are even examples where N outputs exceed the input (e.g. Bredemeier et al., 1998). Decades with elevated atmospheric N inputs have led to decreased
0.00 0.20 0.40 0.60 0.80 1.00
SSWC model FAB model
Fraction of lakes exceeded
>50 25-50 0-25 0 Exceedance meq m-2 yr-1
Fig. 4. Critical load exceedances at steady state under 1992-96 S and N deposition
levels; calculated from the SSWC model (considering present NO3- leaching) and the FAB-model (considering potential NO3- leaching).
soil C:N ratios in several forested sites in Europe, and empirical data demonstrate a negative correlation between NO3- leaching and C:N ratios in the forest floor (Gundersen et al., 1998b).
Unfortunately, there are presently few sites with simultaneous long-term data on C:N ratios and NO3 -leaching, such that the time perspective for shifts in NO3 -leaching level (and possibly fulfilment of the FAB predictions) is unclear. However, an overall lack of significant trends in NO3- concentrations in acid-sensitive streams in Europe experiencing elevated levels of N deposition may indicate that N saturation is a slow process requiring several decades (Wright et al., 2001). On the other hand, reductions in N deposition (e.g. by roof experiments) usually have resulted in an immediate reduction in NO3 -output concentrations (e.g., Tietema et al., 1998). Hence, the future NO3- leaching level may be determined by two opposing factors, i.e. gradually increasing N saturation and reduced N deposition (Wright et al., 2001). In addition, increased air and soil temperatures caused by a possible climate change may accelerate NO3- leaching by increasing mineralisation of soil organic matter. This was demonstrated by the CLIMEX project (Climate Change Experiment), where a three-year increase in CO2 and air temperature tripled the NO3- leaching in an enclosed forested catchment in southernmost Norway (Wright, 1998).
Due to the large uncertainties associated with future NO3 -leaching as a response to decreasing C:N ratios, altered N deposition levels and possible changes in the global climate, long-term monitoring and further studies of N retention processes in various ecosystem types under varying N deposition levels and climatic conditions seem necessary. In the meantime, it seems reasonable to base the FAB model on the precautionary principle, assuming that all N not taken up by presumed long-term sinks may leach as acidifying NO3- some time in the future.
Acknowledgements
The study was funded by Naturens Tålegrenser (Norwegian Ministry of the Environment, Directorate for Nature Protection [DN], the Norwegian Pollution Control Authority [SFT]), the Research Council of Norway (NFR), and the Norwegian Institute for Water Research (NIVA). Chemical data were collected as a part of the Norwegian Monitoring programme for Long-Range Transported Air Pollutants (funded by SFT). Richard F. Wright, NIVA, is thanked for valuable comments on the manuscript.
References
Aber, J.D., Nadelhoffer, K., Steudler, P. and Melillo, J.M., 1989. Nitrogen saturation in northern forest ecosystems. Bioscience,
39, 378–386.
Bredemeier, M., Blanck, K., Xu, Y.-J., Tietema, A., Boxman, A.W., Emmett, B., Moldan, F., Gundersen, P., Schleppi, P. and Wright, R.F., 1998. Input-output budgets at the NITREX sites. Forest
Ecol. Manage., 101, 57–64.
Curtis, C.J., Allott, T.E.H., Reynolds, B. and Harriman, R., 1998. The prediction of nitrate leaching with the First-order Acidity Balance (FAB) model for upland catchment in Great Britain.
Water Air Soil Pollut., 105, 205–215.
Curtis, C., Allott, T., Hall, J., Harriman, R., Helliwell, R., Hughes, M., Kernan, M., Reynolds, B. and Ullyett, J.m 2000. Critical loads of sulphur and nitrogen for freshwaters in Great Britain and assessment of deposition reduction requirements with the First-order Acidity Balance (FAB) model. Hydrol. Earth Syst.
Sci., 4, 125–140.
De Vries, W., Reinds, G.J., Posch, M. and Kämäri, J., 1994. Simulation of soil response to acidic deposition scenarios in Europe. Water Air Soil Pollut., 78, 215–246.
Dillon, P.J. and Molot, L.A., 1990. The role of ammonium and nitrate retention in the acidification of lakes and forested catchments. Biogeochemistry, 11, 23–43.
Dise, N.B. and Wright, R.F., 1995. Nitrogen leaching from European forests in relation to nitrogen deposition. Forest. Ecol.
Manage., 71, 153–161.
Frogner, T., Wright, R.F., Cosby, B.J. and Esser, J.M., 1994. Maps
of critical loads and exceedances for sulphur and nitrogen to forest soils in Norway. Naturens Tålegrenser Fagrapport 56,
Ministry of Environment, Oslo, 27 pp.
Gundersen, P., Emmett, B.A., Kjønaas, O.J., Koopmans, C.J. and Tietema, A., 1998a. Impact of nitrogen deposition on nitrogen cycling in forests: a synthesis of NITREX data. Forest Ecol.
Manage., 101, 37–55.
Gundersen, P., Callesen, I. and de Vries, W., 1998b. Nitrate leaching in forest ecosystems is related to forest floor C/N-ratios.
Environ. Pollut., 102, 403–407.
Henriksen, A. and Buan, A.K., 2000. Critical loads and critical
load exceedances for surface waters, forest soil and vegetation in Norway [English summary]. Naturens Tålegrenser Fagrapport
106, Ministry of Environment, Oslo, 29 pp.
Henriksen, A. and Posch, M., 2001. Steady-state models for calculating critical loads of acidity for surface waters. Water,
Air Soil Pollut: Focus, 1, 375–398.
Henriksen, A., Lien, L., Traaen, T.S., Sevaldrud, I.S. and Brakke, D.F., 1988. Lake acidification in Norway - Present and predicted chemical status. Ambio, 17, 259–266.
Henriksen, A., Skjelkvåle, B.L., Mannio, J., Wilander, A., Jensen, J.P., Moiseenko, T., Harriman, R., Traaen, T.S., Fjeld, E., Vuorenmaa, J., Kortelainen, P., Forsius, M., 1997. Results of national lake surveys (1995) in Finland, Norway, Sweden, Denmark, Russian Kola, Russian Karelia, Scotland and Wales.
Acid Rain Research Report 47/1997. Norwegian Institute for
Water Research, Oslo, 43 pp.
Henriksen, A., Skjelkvåle, B.L., Mannio, J., Wilander, A., Harriman, R., Curtis, C., Jensen, J.P., Fjeld, E. and Moiseenko, T. 1998. Northern European Lake Survey - 1995. Finland, Norway, Sweden, Denmark, Russian Kola, Russian Karelia, Scotland and Wales. Ambio, 27: 80-91.
Hessen, D.O., Hindar, A. and Holtan, G., 1997. The significance of nitrogen runoff for eutrophication of freshwater and marine recipients. Ambio, 26, 312–320.
Hindar, A., Posch, M. and Henriksen, A., 2001. Effects of in-lake retention of nitrogen on critical load calculations. Water Air
Soil Pollut., 130, 1403–1408.
Kämäri, J., Forsius, M. and Posch, M., 1993. Critical loads of sulfur and nitrogen for lakes. 2. Regional extent and variability in Finland. Water Air Soil Pollut., 66, 77–96.
Kelly, C.A., Rudd, J.W.M., Hesslein, R.H., Schindler, D.W., Dillon, P.J., Driscoll, C.T., Gherini, S.A. and Hecky, R.E., 1987. Prediction of biological acid neutralization in acid-sensitive lakes. Biogeochemistry, 3, 129–140.
Kjønaas, O.J., Stuanes, A.O. and Huse, M., 1998. Effects of weekly nitrogen additions on N cycling in a coniferous forest catchment, Gårdsjön, Sweden. Forest Ecol. Manage., 101, 227–249. Lien, L., Raddum, G.G., Fjellheim, A. and Henriksen, A., 1996.
A critical limit for acid neutralizing capacity in Norwegian surface waters, based on new analyses of fish and invertebrate responses. Sci. Tot. Environ., 177, 173–193.
Mulder, J., Nilsen, P., Stuanes, A.O. and Huse, M., 1997. Nitrogen pools and transformation in forest ecosystems with different atmospheric inputs. Ambio, 26, 273–281.
Posch, M., Forsius, M. and Kämäri, J., 1993. Critical loads of sulphur and nitrogen for lakes I: Model description and estimation of uncertainty. Water, Air Soil Pollut., 66, 173–192. Posch, M., Kämäri, J., Forsius, M., Henriksen, A. and Wilander, A., 1997. Exceedance of critical loads for lakes in Finland, Norway, and Sweden: Reduction requirements for acidifying nitrogen and sulphur deposition. Environ. Manage., 21, 291– 304.
Posch, M., de Smet, P.A.M., Hettelingh, J.-P. and Downing, R.J., 1999. Calculation and Mapping of Critical Thresholds in
Europe. Status Report 1999. Coordination Center for Effects,
National Institute of Public Health and the Environment (RIVM), Bilthoven, Netherlands, Report No. 259101009, 165 pp.
Rosén, K., Gundersen, P., Tegnhammar, L., Johansson, M. and Frogner, T., 1992. Nitrogen enrichment of Nordic forest ecosystems. The concept of critical loads. Ambio, 21, 364–368. Skeffington, R.A. and Wilson, E.J. 1988. Excess nitrogen deposition: issues for considerations. Environ. Pollut., 54, 159– 184.
Skjelkvåle, B.L., Wright, R.F. and Henriksen, A., 1998. Norwegian lakes show widespread recovery from acidification: results of national surveys of lakewater chemistry 1986-1997. Hydrol.
Earth Syst. Sci., 2, 555–562.
Stoddard, J.L., 1994. Long term changes in watershed retention of nitrogen. Its causes and aquatic consequences. In:
Environmental chemistry of lakes and reservoirs, L.A. Baker
(ed.). Advances in Chemistry Series no. 237, American Chemical Society, Washington DC, 223–284.
Tietema, A., Boxman, A.W., Bredemeier, M., Emmett, B.A., Moldan, F., Gundersen, P., Schleppi, P. and Wright, R.F., 1998. Nitrogen saturation experiments (NITREX) in coniferous forest ecosystems in Europe: a summary of results. Environ. Pollut.,
102, 403–407.
Tørseth, K. and Semb, A., 1998. Deposition of nitrogen and other major inorganic compounds in Norway, 1992-1996. Environ.
Pollut., 102, 299–304.
UBA, 1996. Manual on Methodologies and Criteria for Mapping
Critical Levels/Loads and geographical areas where they are exceeded. UN/ECE Convention on Long-range Transboundary
Air Pollution, Federal Environmental Agency (Umweltbundesamt), Texte 71/96, Berlin, 144 pp.
UN/ECE, 1994. Protocol to the 1979 Convention on Long-range
Transboundary Air Pollution on further Reduction of Sulphur Emissions. Document ECE/EB.AIR/40, New York and Geneva,
106 pp.
UN/ECE, 2000. Protocol to the 1979 Convention on Long-range
Transboundary Air Pollution Abate Acidification, Eutrophication and Ground-level Ozone, ECE/EB.AIR/72,
United Nations, New York and Geneva, 219 pp.
Vitousek, P.M., Aber, J.D., Howarth, R.W., Likens, G.E., Matson, P.A., Schindler, D.W., Schlesinger, W.H. and Tilman, D.G., 1997. Human alteration of the global nitrogen cycle: Sources and consequences. Ecol. Appl., 7, 737–750.
Wright, R.F., 1998. Effect of increased carbon dioxide and temperature on runoff chemistry at a forested catchment in southern Norway (CLIMEX Project). Ecosystems, 1, 216–225. Wright, R.F., Raastad, I.A. and Kaste, Ø., 1997. Atmospheric
deposition of nitrogen, runoff of organic nitrogen, and critical loads for soils and waters. Naturens Tålegrenser Fagrapport
83, Ministry of Environment, Oslo, 23 pp.
Wright, R.F., Alewell, C., Cullen, J., Evans, C., Marchetto, A., Moldan, F., Prechtel, A. and Rogora, M., 2001. Trends in nitrogen deposition and leaching in acid-sensitive streams in Europe. Hydrol. Earth Syst. Sci., 5, 299–310.