HAL Id: hal-00297783
https://hal.archives-ouvertes.fr/hal-00297783
Submitted on 29 Oct 2004HAL is a multi-disciplinary open access
archive for the deposit and dissemination of sci-entific research documents, whether they are pub-lished or not. The documents may come from teaching and research institutions in France or abroad, or from public or private research centers.
L’archive ouverte pluridisciplinaire HAL, est destinée au dépôt et à la diffusion de documents scientifiques de niveau recherche, publiés ou non, émanant des établissements d’enseignement et de recherche français ou étrangers, des laboratoires publics ou privés.
Biogeochemical processes in sediments of the
Manfredonia Gulf (Southern Adriatic Sea): early
diagenesis of carbon and nutrient and benthic exchange
F. Spagnoli, G. Bartholini, M. Marini, P. Giordano
To cite this version:
F. Spagnoli, G. Bartholini, M. Marini, P. Giordano. Biogeochemical processes in sediments of the Man-fredonia Gulf (Southern Adriatic Sea): early diagenesis of carbon and nutrient and benthic exchange. Biogeosciences Discussions, European Geosciences Union, 2004, 1 (1), pp.803-823. �hal-00297783�
BGD
1, 803–823, 2004 Biogeochemical processes in sediments of the Manfredonia Gulf F. Spagnoli et al. Title Page Abstract Introduction Conclusions References Tables Figures J I J I Back CloseFull Screen / Esc
Print Version Interactive Discussion © EGU 2004 Biogeosciences Discussions, 1, 803–823, 2004 www.biogeosciences.net/bgd/1/803/ SRef-ID: 1810-6285/bgd/2004-1-803 © European Geosciences Union 2004
Biogeosciences Discussions
Biogeosciences Discussions is the access reviewed discussion forum of Biogeosciences
Biogeochemical processes in sediments
of the Manfredonia Gulf (Southern
Adriatic Sea): early diagenesis of carbon
and nutrient and benthic exchange
F. Spagnoli1, G. Bartholini1, M. Marini2, and P. Giordano3 1
National Research Council-Marine Science Institute-Departement of Lesina (FG), Italy 2
National Research Council-Marine Science Institute-Department of Ancona, Italy 3
National Research Council-Marine Science Institute-Department of Bologna, Italy
Received: 22 September 2004 – Accepted: 5 October 2004 – Published: 29 October 2004 Correspondence to: G. Bartholini ([email protected])
BGD
1, 803–823, 2004 Biogeochemical processes in sediments of the Manfredonia Gulf F. Spagnoli et al. Title Page Abstract Introduction Conclusions References Tables Figures J I J I Back CloseFull Screen / Esc
Print Version Interactive Discussion
© EGU 2004
Abstract
In order to understand the mechanisms responsible of the recycle of carbon and trients at the sediment-water interface and to understand the role of sediments in nu-trients mass balance in coastal water, cores were collected (pore waters and solid phases) and benthic fluxes (oxygen, dissolved nutrients, dissolved iron and
mana-5
ganese, alkalinity and TCO2) were measured in two stations in the Gulf of Manfredonia (Southern Adriatic Sea). Stations were chosen to include a site, in the offshore part of the gulf, under the influence of western Adriatic current and another site, in the inner part of the gulf, under influence of gyres occurring inside the gulf. Both stations were placed in areas characterized by high sedimentation rate. Fluxes at sediment water
in-10
terface show higher values in S2 site during the summer. Bio-irrigation seems to be the main transport mechanism characterizing both sites, with more evident effects during summer in S1 site.
1. Introduction
The sediment-water interface is a site of intense chemical, physical, and biological
re-15
actions, which can lead both to the formation of new phases and alteration of existing minerals and to changes in the composition of waters themselves. The reactions in-volving the oxidation of organic matter are carried out largely by bacteria using a series of electron acceptors which operate at decreasing redox potentials at increasing depth in the sediment. It is well know that different available terminal acceptors are used by
20
the microbial community in the order of decreasing free energy production per mole of organic carbon oxidized (Froelich et al., 1979; Berner, 1980). These reactions are controlled by external factors, such as temperature, sedimentation rate, organic matter inputs, sea bottom water chemistry and hydrodynamics (Berner, 1980), bioturbation and irrigation. In coastal marine environments with shallow waters and fine sediments,
25
BGD
1, 803–823, 2004 Biogeochemical processes in sediments of the Manfredonia Gulf F. Spagnoli et al. Title Page Abstract Introduction Conclusions References Tables Figures J I J I Back CloseFull Screen / Esc
Print Version Interactive Discussion
© EGU 2004
nutrients, i.e. they determine the amount of nutrients buried versus the amount of nu-trients recycled to the water column as benthic fluxes (Aller, 1980; Giordani and Ham-mond, 1985; Degobbis et al., 1986; Hammond et al., 1985). Such benthic fluxes can represent an internal input comparable to or higher than external inputs from terrestrial sources (Hammond et al., 1984). Hence, nutrient input and consequently the primary
5
productivity in a shallow coastal ecosystem can be closely associated with sea-floor biogeochemical processes (Cloern, 1996).
The study focuses on the processes that influence the early diagenesis in a shallow basin in southern Adriatic Sea (Gulf of Manfredonia – Fig. 1), where seasonal variation of nutrient inputs and cohexistence of multiple nutrient sources (e.g. nearby rivers or
10
by North Adriatic Currents), can produce seasonal variations of diagenetic processes, and influence quality and quantity of decomposing material.
2. Study area
The Gulf of Manfredonia is situated in the western part of Southern Adriatic Sea (Fig. 1). To the North it is delimited by the Gargano Peninsula which morphologically
15
marks the northern border of the Southern Adriatic.
The Gulf is characterized by limited circulation and high sedimentation rate (Dami-ani et al., 1988; Bianchi and Zurlini, 1984). It represents a transition zone between the Middle Adriatic circulation and the Southern circulation which presents Ionian Sea characteristics, such as oligotrophic waters (Damiani et al., 1988). Recent
investiga-20
tions about surface circulation and current measurements in the Adriatic Sea confirmed a cyclonic circulation in the Southern sub-basin (Poulain, 2001; Kovacevic et al., 1999) characterized by seasonal variability (Poulain, 1999; Artegiani et al., 1997). A cyclonic gyre is often observed in the Gulf of Manfredonia, but may reverse depending on wind direction (Signell, pers. comm.): cyclonic and anticyclonic gyres are respectively
gen-25
erated by N-NW and S-SE winds (Simeoni et al., 1992).
BGD
1, 803–823, 2004 Biogeochemical processes in sediments of the Manfredonia Gulf F. Spagnoli et al. Title Page Abstract Introduction Conclusions References Tables Figures J I J I Back CloseFull Screen / Esc
Print Version Interactive Discussion
© EGU 2004
coastal current enriched in nutrients (Western Adriatic Current, WAC) flowing along the Western coast of the Adriatic basin. The WAC connects the northern and southern ecosystem and affect of the biogeochemical properties of the whole weastern Adriatic basin. In the Southern Adriatic open waters, however, show clearly oligotrophic char-acteristics (Vilicic et al., 1989) and the nutrient supply to the euphotic zone depends
5
strongly on the vertical stratification/mixing processes.
Based on grain size analyses in surface sediments 3 sediment types can be recog-nized: silt sandy, silt and clay. The distribution of these sediment types is essentially the result of wave influence: grain-size in fact decrease with increasing water depth and distance from shore (Brondi et al., 1976; Colantoni et al., 1975). Silt sandy
sed-10
iments are common in zones adjacent to the shoreline between depth 2–4 m where wave currents are lower. Silty and clay sediments are found in the central part of the Gulf (>8 m of depth) and in the deeper zones. Bioclastic fragments are found in some coastal sites (>6 m of depth) due to breaking coral reef (Simeoni, 1992).
The average water temperature difference between winter and summer months is
15
approximately 11–20◦C. Water column productivity has been shown to be higher in summer months (Spagnoli et al., 2004a).
3. Methods
During two oceanographic cruises carried out in late summer (October 2002) and late winter (March 2003) gravity cores were collected in two stations (Fig. 1) in which high
20
sedimentation rate occur using a SW-104 corer, a device which assures the collection of the undisturbed sediment-water interface. Cores recovered shipboard were sec-tioned and centrifuged for pore water and solid phase analyses. The water overlying the cores was generally clear, suggesting minimal disturbance, although the sediment surface was often uneven. Each core was sectioned in a nitrogen-filled glove box
25
on board, and punch in pH and Eh measurements were made during the section-ing. In order to extract pore waters, the mud was transferred into plastic tubes and
BGD
1, 803–823, 2004 Biogeochemical processes in sediments of the Manfredonia Gulf F. Spagnoli et al. Title Page Abstract Introduction Conclusions References Tables Figures J I J I Back CloseFull Screen / Esc
Print Version Interactive Discussion
© EGU 2004
centrifuged for about 15 min at 5500 rpm in a refrigerated centrifuge at near in situ temperatures. Pore waters were filtered under a nitrogen atmosphere through Nucleo-pore filters (0.4 µm) in plastic holders. Four splits were saved unacidified for alkalinity, TCO2, DOC and nutrients measurements, and another was acidified (to about pH 1.5) and used to analyse dissolved Fe and Mn. Pore water extraction and filtration was
gen-5
erally completed within 6 hours from core collection. The centrifuged mud was recov-ered, frozen and subsequently dried at room temperature for analysis of solid phases (organic and total C, total N). In the first cruise replicate cores were collected to esti-mate sedimentation rates and bioturbation coefficients by 210Pb excess, 137Cs, 234Th measurements. The excess activities of210Pb were calculated from226Ra supported
10
210
Pb deduced from the activities of214Pb and214Bi. Radionuclides were counted us-ing a HPGe (30–60% relative efficiency, 2 KeV of resolution). In the second cruise repli-cate cores were collected to measure dissolved oxygen penetration by microelectrode profiler. Sampling and instrumental difficulties prevented us from collecting complete data sets in both surveys.
15
In situ benthic flux chambers were deployed in each sites. Two chambers were dis-played in each site one by side to replicate measurements. Benthic chambers capture approximately 39 l of water in contact with 0.25 m2 of sea bed. Each chamber was sampled six times during deployments of about 24 h. The incubation period of 24 h was sufficient to generate measurable changes in concentration, but not long enough
20
to produce significant changes in fluxes.
A CsCl spike was injected in the incubation soon after the first sampling and the observed dilution of this spike in subsequent sample draws was used to calculate chamber volume and was used as tracer for chamber water exchange with pore wa-ter. Chambers were stirred by a rotating paddle such that the diffusive boundary layer
25
thickness within the chamber was unaffected.
Porosity was calculated after drying each sample at 60◦C, total and organic carbon and total nitrogen (all expressed as weight %) were measured by CHN elemental ana-lyzer (Carlo Erba) after removal of the inorganic carbon with HCl (Froelich et al., 1979).
BGD
1, 803–823, 2004 Biogeochemical processes in sediments of the Manfredonia Gulf F. Spagnoli et al. Title Page Abstract Introduction Conclusions References Tables Figures J I J I Back CloseFull Screen / Esc
Print Version Interactive Discussion
© EGU 2004
Organic nitrogen was assumed to equal total nitrogen (Giordani and Angiolini 1983). Dissolved phosphate, ammonia, nitrite, nitrate and silicate were measured on pore wa-ters and benthic chamber samples by colorimetric autoanalyser technique. Alkalinity was determined by Gran titration (Gieskes and Rogers, 1973) and TCO2 was deter-mined from alkalinity, pH, salinity and temperature. Additionally, in the second cruise,
5
an aliquot of 5ml was collected for the analyses of TCO2by manometric measurements (McCorkle et al., 1985). Fe, Mn and Cs were determined on the acidified aliquots by Flame-AAS. Ca, Mg and other dissolved cations were determined by HPLC. For each parameters analysed benthic fluxes were calculated as the product of the slope of con-centration vs. incubation time and chamber height, without including bottom water data
10
in the calculation. Benthic flux calculations were determined only from the linear por-tion of the concentrapor-tion vs. time plots (Berelson et al., 1998) and no flux was reported if we had fewer than 4 data points.
Using two deployment, fluxes were averaged and the uncertainty in the mean was calculated in two ways; (a) as the standard error of the mean; or (b) as the square
15
root of the sum of the variance of each flux value, divided by the number of flux mea-surements. We report the larger of these two uncertainties, following the procedure described by Hammond et al. (1996).
4. Results and discussion
4.1. Solid phase measurements
20
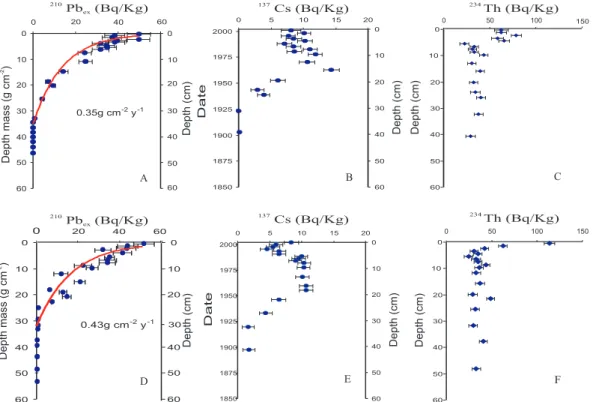
Down-core changes in porosity,210Pb activity and organic C were measured on cores collected. In the study sites surficial sediments have a porosity 0.75–0.8 and this value decreases to 0.60–0.65 at 25–30 cm (Fig. 2).
The excess activity of210Pb (t1/2=22.3 y) (Fig. 3a), decreasing exponentially below the interface in both stations, may be used to estimate the rates of sediment
accumu-25
BGD
1, 803–823, 2004 Biogeochemical processes in sediments of the Manfredonia Gulf F. Spagnoli et al. Title Page Abstract Introduction Conclusions References Tables Figures J I J I Back CloseFull Screen / Esc
Print Version Interactive Discussion
© EGU 2004
the210Pbexprofiles (Lalou, 1982), sedimentation rates (w) from each stations were es-timated to be 0.35 cm2y−1in station S1 and 0.43 cm−2y−1 in station S2. These values are similar to those calculated by Giordani et al. (1992) and by Hammond et al. (1999) in the Northern Adriatic sea. In order to check sedimentation rates the vertical profile of137Cs (Fig. 2b) is used. It is well know that a significant input of this radionuclide
5
in the environment occurred in the 1963 related to atmospheric weapon tests. Hence maxima concentrations in cesium vertical profiles correspond to sediments buried in this age (Cochran, 1985), supporting the dating calculated by210Pbex.
Thorium activities were also measured as useful tracer of sediment mixing. The mix-ing of the upper 10 cm of sediment caused by macrofauna is referred to as bioturbation,
10
it can alter the physical and chemical properties of sediment affecting both particle and solute transport (Schink and Guinasco, 1977; Rhoads, 1974; Aller, 1980; Aller and Aller, 1986). In order to calculate bioturbation coefficients (Db) the relation calculated by Pope et al. (1996) was applied to234Th exponential profile (S2 station) and Dbwas estimated to be 0.20 cm2y−1. This value falls on the low end of a compilation by Tromp
15
et al. (1995) relating Dbto w for similar environments, perhaps because of the episodic presence of low oxygen bottom water. The profiles of234Th in station S1 is constant from sediment water interface down to 5 cm, suggesting a bioturbated layer too.
Organic carbon concentrations in all the cores (Fig. 2) rapidly decrease from the sediment-water interface to 5–7 cm, deeper it reaches a low constant value and exhibits
20
a regular trend interrupted only by relatively high values at about 20 cm in both sites. Total N concentrations also show a down-core decreasing trend. Continental margin sediments are a mixture of terrestrial and marine components so to identify the source of the organic matter undergoing diagenesis the C/N ratio might be used (Froelich et al., 1979). The Redfield ratio of C:N:P in marine sediments, 106:16:1 (C/N∼7), might be
25
representative of settled marine phytoplankton, wheras higher values may reflect the breakdown of terrestrial derived particulate organic carbon (POC). The C/N average ratios range from 5±2 to 7±2 in winter and in summer cruise respectively, with higher values shown by surface sediments collected in summer, and similar those calculated
BGD
1, 803–823, 2004 Biogeochemical processes in sediments of the Manfredonia Gulf F. Spagnoli et al. Title Page Abstract Introduction Conclusions References Tables Figures J I J I Back CloseFull Screen / Esc
Print Version Interactive Discussion
© EGU 2004
in north Adriatic by Hammond et al. (1999). Therefore, the origin of organic matter should be marine.
4.2. Pore water profiles
In continental slope and rise sediments underlying well-oxygenated bottom waters, O2 is the most important electron acceptor for organic matter decomposition. In
continen-5
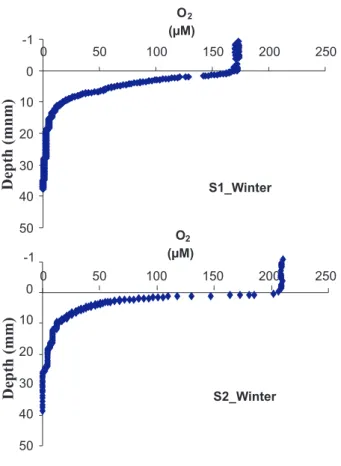
tal margins sediments anoxic conditions occur in few centimeters of depth due to high sedimentation rates and high organic matter inputs. Thus, the sedimentary O2 con-sumption rate is a good first-order indicator of organic matter oxidation rates in many locations. In the sampled sites dissolved oxygen exponentially decreases below the sediment-water interface and at depth greater than 1 cm suboxic conditions occur in
10
both sites (Fig. 4). Higher oxygen concentration at the sediment water interface and sharper gradient are displayed at S2 station.
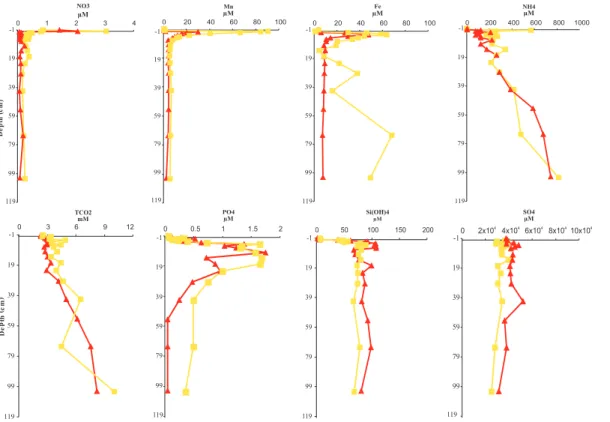
Pore water NO−3 profiles (Fig. 5) show the effects of nitrification in the oxic zone of the sediments and of denitrification immediately below the oxic zone. At sites where we have both O2and NO−3 concentrations, the depth at which denitrification begins is just
15
above or within the depth range over which O2 concentrations reach zero. The NO−3 reaches 0 values depth at about 20 cm. The low, constant, non-zero values observed below 20 cm at S2 site are most likely non-zero because of a calibration problem.
Suboxic diagenesis is indicated by the pore water profiles of dissolved manganese and iron (Fig. 6) according to the well-established depth sequence of diagenetic
reac-20
tions, governed by the preferential use of Mn and Fe oxide phases as electron accep-tors, that yields the highest amount of free energy for the bacterially mediated oxidation of organic matter (Froelich et al., 1979). Dissolved manganese profiles exhibit, in both stations, near surface peaks, just below the oxygen penetration depth. A secondary peak in Mn2+ pore water profile is observed in S2 site at 13 cm in summer, deeper the
25
trend continue quite constant. The dissolved Fe shows, in all profiles, a sharp increase just below the depth range in which Mn concentrations reach maxima values, At higher depth dissolved iron concentrations decrease quickly down to 10–20 cm and then
in-BGD
1, 803–823, 2004 Biogeochemical processes in sediments of the Manfredonia Gulf F. Spagnoli et al. Title Page Abstract Introduction Conclusions References Tables Figures J I J I Back CloseFull Screen / Esc
Print Version Interactive Discussion
© EGU 2004
crease in both summer cores and in the S2 winter core. The increase of dissolved Fe with depth seems to suggest a complexation with dissolved refractory organic matter, hence any reaction occur with reduced sulphur to form FeS, thermodynamically pre-ferred, or with carbonate, as siderite (Postma, 1982). This is a working hypothesis that needs of further study. The peaks of dissolved Mn and Fe are attributed to the
produc-5
tion of these metals in anaerobic condition by dissimilatory reduction of oxy-hydroxide manganese and iron by bacteria activity: oxide phases may be used as terminal elec-tron acceptors in bacterial oxidation of organic carbon. About the pore water SO4 profiles, the trends are rather constant displaying higher concentrations in the summer profiles in S2 station, hence sulphate reduction does not seem to take place.
10
The decomposition of organic matter, using Mn and Fe oxy-hydroxides as electron acceptors below the denitrification layer, results in the release of NH+4 and TCO2 into the pore waters. Pore water data (Fig. 5) reflect this process, as they show monoton-ically increasing [NH+4] and TCO2 below the denitrification layer. From the sediment-water interface to 10 cm of depth, the distribution of both organic matter degradation
15
products (TCO2and ammonia) is scattered, suggesting bio-mixing and irrigation pro-cesses. Activity of macrofauna may deepen and channelize the penetration depth of oxygen and improve solute fluxes across the sediment-water interface. We have not available data on the activities of macrofauna, hence this hypothesis needs further study. The NH+4 released to the pore waters by anoxic diagenesis diffuses upwards
20
in the sediment column, where most of it is apparently oxidized before it reaches the sediment–water interface.
The dissolved PO3−4 in pore waters in all cores has a similar trend: a rapid and ir-regular increase in a layer near surface (about 3 cm depth), a second relative peak is displayed at about 17 cm, at higher depth the profiles approach the analytical
detec-25
tion limit. The higher value are shown in S1 cores. The irregular trend is due to the complexity of P cycle: the low concentrations at the sediment water interface are due to the precipitation with Fe oxy-hydroxides, from the sub-surface to 20 cm the PO3−4 concentration increase as a result of release by organic decomposition and dissolution
BGD
1, 803–823, 2004 Biogeochemical processes in sediments of the Manfredonia Gulf F. Spagnoli et al. Title Page Abstract Introduction Conclusions References Tables Figures J I J I Back CloseFull Screen / Esc
Print Version Interactive Discussion
© EGU 2004
of Fe-oxhydroxides and then it decreases because of removal to a sedimentary phase. As a summary, the pore water profiles display a marked seasonality, with degradative processes more intense in the summer period due to higher temperature and higher input of fresh organic matter.
4.3. Chamber data
5
Benthic chamber experiments were successful for the determination of ammonium, nitrate, nitrite, phosphate, silicate, alkalinity, TCO2, manganese, iron, cesium and oxy-gen fluxes in both sites (Stations S1, S2). As the incubation time increases, there is the possibility that chamber chemistry or other artifacts will produce non-constant fluxes.
This is recognizable in some data, so flux calculations were determined only from
10
the linear portion of the concentration vs. time plots and no flux was reported if we had fewer than 4 data points (Berelson et al., 1998).
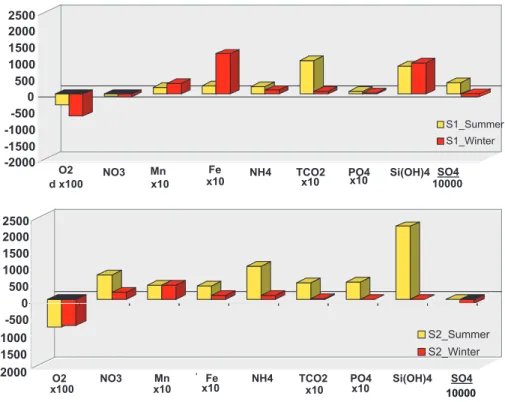
In Fig. 6 a comparison of benthic fluxes in both seasons is presented. Greatest oxygen uptake occurred in winter in S1 while in S2 oxygen uptake was pretty simi-lar throughout the year. Nitrate flux was always into sediment in S1 site and out of
15
sediment in S2, greatest variability is evident in S2. Dissolved manganese and iron show positive fluxes, stronger seasonality is shown at S1 site. Ammonia fluxes were always out of sediment, with lowest fluxes occurring in winter, and so behave TCO2 and phosphate. Measured benthic fluxes of degradative organic matter products are significantly higher during the summer in both station, with more significant differences
20
in S2 station.
Actually data on primary productivity are not available, so we are not able to define the seasonal productivity pattern in the Gulf of Manfredonia, however the seasonal variations in benthic chamber fluxes for silicate, nitrate and TCO2 suggest that higher inputs of fresh organic matter occured during summer. The variations are stronger
25
in station S2, where also a different source of organic matter might be present, as suggested by inorganic geochemistry of surface sediments, associated to the material
BGD
1, 803–823, 2004 Biogeochemical processes in sediments of the Manfredonia Gulf F. Spagnoli et al. Title Page Abstract Introduction Conclusions References Tables Figures J I J I Back CloseFull Screen / Esc
Print Version Interactive Discussion
© EGU 2004
transported by the WAC (Spagnoli et al., 2004b).
5. Conclusions
Pore water profiles of different electron acceptors for organic carbon oxidation indicate that in the Gulf of Manfredonia diagenesis of organic matter progresses trough oxy-gen respiration, denitrification, manganese and iron reduction, while sulphate
reduc-5
tion and methanogenesis do not take place. The depth-dependent characteristics of profiles were similar in both sites and seasons. Degradative processes of a prevalently marine organic matter are more intense during summer, as testified by the pore-water profiles and by the increased benthic fluxes of nutrients at the sediment-water inter-face. The processes of oxidation of organic matter might be influenced by bioturbation
10
and bioirrigation, that are particularly active in the uppermost 10 cm of the sediment. Acknowledgements. We wish to acknowledge invaluable assistance in carrying out the cruise
from G. Casolino, P. Trentini and R. Belastock provided invaluable assistance in metal and TCO2 analyses respectively. E. Dinelli provided helpful comments that helped refine the final draft. Financial support for this research was provided by the National council of Research 15
trough the PIT AGEM project.
References
Aller, R. C.: Quantifying solute distribution in the bioturbated zone of marine sediments by defining an average microenvironment, Geochim. Cosmochim. Acta, 44, 1955–1965, 1980. Aller, J. Y. and Aller, R. C.: Evidence for localized enhancement of biological activity associated 20
with tube and burrow structures in deep-sea sediments at the HEBBLE site, western North Atlantic, Deep-Sea Res., 33, 755–790, 1986.
Artegiani, A., Bregant, D., Paschini, E., Pinardi, N., Raichic, F., and Russo, A.: The Adriatic Sea general circulation. Part I: air-sea interactions and water mass structure, J. Phys. Ocean., 27, 1492–1514, 1997.
BGD
1, 803–823, 2004 Biogeochemical processes in sediments of the Manfredonia Gulf F. Spagnoli et al. Title Page Abstract Introduction Conclusions References Tables Figures J I J I Back CloseFull Screen / Esc
Print Version Interactive Discussion
© EGU 2004 Berner, R. A.: Early Diagenesis: A Theoretical Approach, Princeton University Press, Princeton
NJ, 1980.
Berelson, W. M., Heggie, D., Longmorec, A., Kilgore, T., Nicholson, G., and Skyring, G.: Benthic Nutrient Recycling in Port Phillip Bay, Australia Estuarine, Coast. Shelf. Sci., 46, 917–934, 1998.
5
Bianchi, C. N. and Zurlini, G.: Criteri e prospettive di una classificazione ecotipologica dei sistemi marini costieri italiani, Acqua aria, 8, 785–796, 1984.
Brondi, A. and Ferretti O.: Studio sulla dispersione dei sedimenti della piattaforma costera compresa tra Termoli e Barletta mediante l’uso dei detriti della formazione delle “pietre nere” come traccianti naturali, Thalassia Salentina, 12, 87–95, 1976.
10
Cloern, J. E.: Phytoplankton bloom dynamics in coastal ecosystems: a review with some gen-eral lessons from sustained investigation of San Francisco Bay, California, Reviews of Geo-physics, 34, 127–168, 1996.
Cochran, J. K.: Particle mixing rates in sediments of the eastern equatorial Pacific: evidence
from Pb210, Pu239,240, and Cs137distributions at MANOP sites, Geochim. Cosmochim. Acta,
15
49, 1195–1210, 1985.
Colantoni, P. and Gallignani, P.: Sea floor types and recent sedimentation on the continental shelf between Manfredonia and Trani (Southern Adriatic Sea), Under. Ass. 8th Symposium Polytechnic of North London, 115–118, 1975.
Damiani, V., Bianchi, C.N., Ferretti, O., Bedulli, D., Morri, C., Viel, M. and Zurlini, G.: Risultati 20
di una ricerca ecologica sul sistema marino pugliese. Thalassia Salentina,, 18, 153 – 169, 1988.
Degobbis, D., Gilmartin, M. Relevante, N. An annotated nitrogen budget calculation for the Northern Adriatic sea. Mar. Chem. 20, 159-177, 1986.
Froelich, P. N., Klinkhammer, G., Bender, M. L., Luedtki, N. A., Heath, G. R., Cullen, D., 25
Dauphin, P., Hammond, D., and Hartman, B.: Early oxidation of organic matter in pelagic sediments of the eastern equatorial Atlantic: suboxic diagenesis, Geochim. Cosmochim. Acta, 43, 1075–1095, 1979.
Gieskes, J. M. and Rogers, W. C.: Measurements of total carbon dioxide and alkalinity, J. Sedim. Petr., 43, 272–277, 1973.
30
Giordani, P. and Angiolini, L.: Chemical parameters characterizing a NW Adriatic coastal area, Coast. Shelf. Sci., 17, 159–167, 1983.
BGD
1, 803–823, 2004 Biogeochemical processes in sediments of the Manfredonia Gulf F. Spagnoli et al. Title Page Abstract Introduction Conclusions References Tables Figures J I J I Back CloseFull Screen / Esc
Print Version Interactive Discussion
© EGU 2004 in coastal waters, Tech. Rep.. no 20, CNR/IGM, Bologna, Italy, 33 pp., 1985.
Giordani, P., Hammond, D. E., Berelson, W. M., Poletti, R., Montanari, G., Milandri, A., Frig-nani, M., Langone, L., Ravaioli, M., and Rabbi, E.: Benthic fluxes and nutrient budgets for
sediments in the Northern Adriatic Sea: burial and recycling efficiencies, Sci. Total Environ.
(Suppl.), 251–269, 1992. 5
Hammond, D. E., Giordani, P., Montanari, G., Rinaldi, A., Poletti, R., Rovatti, G., Astorri, M., and Ravaioli, M.: Benthic flux measurements in NW Adriatic coastal waters, Mem. Soc. Geol. It., 27, 461–467, 1984.
Hammond, D. E., Fuller, C., Harmon, D., Hartman, B., Korosec, M., Miller, L., Rea, R., Berelson, W., and Hager, S.: Benthic fluxes in San Francisco Bay, Hydrobiologia, 129, 69–90, 1985. 10
Hammond, D. E., McManus, J., Berelson, W., Kilgore, T., and Pope, R.: Early diagenesis of organic carbon in the equatorial Pacific: rates and kinetics, Deep Sea Res., 43, 1365–1412, 1996.
Hammond, D. E., Giordani, P., Berelson, W., and Poletti, R.: Diagenesis of carbon and nutrients in sediments of the Northern Adriatic Sea, Mar. Chem., 66, 53–79, 1999.
15
Koide, M., Soutar, A., and Goldberg, E. D.: Marine Geochronology with Pb-210, Earth Planet. Sci. Lett., 14, 442–446, 1972.
Kovacevic, V., Gacic, M., and Poulain, P. M.: Eulerian current measurements in the Strait of Otranto and in Southern Adriatic, J. Mar. Syst., 20, 255–278, 1999.
Lalou, C.: Sediments and sedimentation processes, in: Uranium series disequilibrium, edited 20
by Ivanovich and Harmon, Clarendon Press, Oxford, UK, 384–406, 1982.
McCorkle D. C. and Emerson S. R.: the relationship between pore water carbon isotopic com-position and bottom water oxygen concentration, Geochimica et Cosmochimica Acta, 52, 1169–1178, 1988.
Pope, H. P., Demaster, D. J., Smith C. R., and Seltman H.: rapid bioturbation in equatorial 25
Pacific sediment: evidence from excess 234Th measurements, Deep Sea research II, 43,
1339–1364, 1996.
Poulain, P. M.: Drifter observations of surface circulation in the Adriatic Sea between December 1994 and March 1996, J. Mar. Syst., 20, 231–253, 1999.
Poulain, P. M.: Adriatic sea surface circulation as derived from drifter between 1990 and 1999, 30
J. Mar. Syst., 29–32, 2001.
Schink, D. R. and Guinasso, N. L. J.: Redistribution of dissolved and adsorbed materials in abyssal marine sediments undergoing biological stirring, Am. J. Sci., 278, 687–702, 1977.
BGD
1, 803–823, 2004 Biogeochemical processes in sediments of the Manfredonia Gulf F. Spagnoli et al. Title Page Abstract Introduction Conclusions References Tables Figures J I J I Back CloseFull Screen / Esc
Print Version Interactive Discussion
© EGU 2004 Simeoni, U.: I litorali tra Manfredonia e Barletta (Basso Adriatico), Dissesti, sedimenti,
prob-lematiche ambientali. Boll. Soc. Geol. It., 111, 367–398, 1992.
Spagnoli, F., Fiesoletti, F., Specchiulli, A., Bartholini, G., Conversi, A., and Decembrini, F.: Biochemical Processes, Trophic Status And Water Mass Characteristics In The Gulf of Man-fredonia (Southern Adriatic Sea), Geophysical Research Abstracts, 6, 06095, 2004a. 5
Spagnoli, F., Bartholini, G., Grosso, G., Specchiulli, A., Fiesoletti, F., and Dinelli, E.: Geochem-istry of Major and in trace element in sediments of the gulf of Manfredonia: an assessment of metal pollution CONISMA, 2004b.
Tromp, T. K., Van Cappellen, P., and Key, R. M.: A global model for the early diagenesis of organic carbon and organic phosphorus in marine sediments, Geochim. Cosmochim. Acta, 10
59, 1259–1284, 1995.
Vilicic, D., Vucak, Z., Skrivanic, A., and Grzetic, Z.: Phytoplankton blooms in oligotrophic open South Adriatic waters, Mar. Chem., 28, 89–107, 1989.
Rhoads, D. C.: Organism sediment relations on the muddy sea floor. Oceanographyand, Mar. Biol.: an Annual review, 12, 263–300, 1974.
BGD
1, 803–823, 2004 Biogeochemical processes in sediments of the Manfredonia Gulf F. Spagnoli et al. Title Page Abstract Introduction Conclusions References Tables Figures J I J I Back CloseFull Screen / Esc
Print Version Interactive Discussion © EGU 2004 Manfredonia 10 20 50 100 120 200 400 S2 S1 Bari 15.0 15.2 15.4 15.6 15.8 16.0 16.2 16.4 16.6 16.8 17.0 41.0 41.1 41.2 41.3 41.4 41.5 41.6 41.7 41.8 41.9 42.0 42.1 Manfredonia 0 20 40 Datum ED50 km 0 20 40 km 200 400 Bari
Fig. 1- Site map and stations location Fig. 1. Site map an stations location.
BGD
1, 803–823, 2004 Biogeochemical processes in sediments of the Manfredonia Gulf F. Spagnoli et al. Title Page Abstract Introduction Conclusions References Tables Figures J I J I Back CloseFull Screen / Esc
Print Version Interactive Discussion © EGU 2004 2.0 0 20 40 60 80 100 120 0.0 0.5 Wt. % C org1.0 1.5 2.0 S2_Winter S2_Summer 0 0 20 20 40 40 60 60 80 80 100 100 120 120 0.0 0.5 1.0 1.5 D D e e p p t t h h ( ( c c m m ) ) Wt. % C org S1_Winter S1_Winter S1_Winter S1_Summer S1_Summer S1_Summer S2_Summer S2_Summer S2_Winter S2_Winter Porosity 0 20 40 60 80 100 120 0.3 0.3 0.5 0.5 0.7 0.7 0.9 0.9 0 20 40 60 80 100 120 Porosity C/N 0 5 10 15 20 C/N 0 20 40 60 80 100 120 0 5 10 15 20
Fig. 2 Sediment profiles of porosity, wt.% C and C vs N total from cores colletcted in Gulf of Manfredonia. Depth intervals were 0.5 cm for
the first four points, 1cm for the next 4 points, 3 and 5 for the subsequent point., data are plotted at the mid-point of the interval.org org
Fig. 2. Sediment profiles of porosity, wt.% Corgand Corgvs. N total from cores colletcted in Gulf
of Manfredonia. Depth intervals were 0.5 cm for the first four points, 1cm for the next 4 points, 3 and 5 for the subsequent point, data are plotted at the mid-point of the interval.
BGD
1, 803–823, 2004 Biogeochemical processes in sediments of the Manfredonia Gulf F. Spagnoli et al. Title Page Abstract Introduction Conclusions References Tables Figures J I J I Back CloseFull Screen / Esc
Print Version Interactive Discussion © EGU 2004 1850 1875 1900 1925 1950 1975 2000 0 5 10 15 20 0 10 20 30 40 50 60 1850 1875 1900 1925 1950 1975 2000 0 5 10 15 20 137Cs (Bq/Kg) Date 0 0 10 10 20 20 30 30 40 40 50 50 60 60 0 50 100 150 0 50 100 150 0.35g cm-2y-1 0 10 20 30 40 50 60 0 20 40 60 0 10 20 30 40 50 60 0 10 20 30 40 50 60 0 20 40 60 0 10 20 30 40 50 60 0.43g cm-2y-1 Depth (cm) Depth (cm) Depth (cm) Depth (cm) 0 10 20 30 40 50 60 Depth (cm) Depth mass (g cm ) -2 Depth mass (g cm ) -2 Date Depth (cm) 137Cs (Bq/Kg) 234Th (Bq/Kg) 234Th (Bq/Kg) 210Pb (Bq/Kg) ex 210Pb (Bq/Kg) ex A D E F C B
Fig. 3 - Profiles of solid phase constituents at representative inshore (Sta S1-a, b, c) and offshore (Sta S2-d, e, f) stations. The solid red line shows the fit of an exponential function to excess Pb-210 vs. mass depth.
Fig. 3. Profiles of solid phase constituents at representative inshore (Sta. S1 (a), (b), (c)) and offshore (Sta. S2 (d), (e), (f)) stations. The solid red line shows the fit of an exponential function to excess Pb-210 vs. mass depth.
BGD
1, 803–823, 2004 Biogeochemical processes in sediments of the Manfredonia Gulf F. Spagnoli et al. Title Page Abstract Introduction Conclusions References Tables Figures J I J I Back CloseFull Screen / Esc
Print Version Interactive Discussion © EGU 2004 S1_Winter -1 -1 0 0 10 10 20 20 30 30 40 40 50 50 0 0 50 50 100 100 150 150 200 200 250 250 O2 (µM) O2 (µM) S2_Winter Depth (mnm) Depth (mm)
Fig. 4 - Dissolved oxygen profiles in cores collected in winter cruise. Fig. 4. Dissolved oxygen profiles in cores collected in winter cruise.
BGD
1, 803–823, 2004 Biogeochemical processes in sediments of the Manfredonia Gulf F. Spagnoli et al. Title Page Abstract Introduction Conclusions References Tables Figures J I J I Back CloseFull Screen / Esc
Print Version Interactive Discussion © EGU 2004 NO3 -1 -1 19 19 39 39 59 59 79 79 99 99 119 119 0 1 2µM 3 4 µM µM µM De pt h (c m ) NH4 -1 19 39 59 79 99 119 0 200 400 600 800 1000 PO4 -1 19 39 59 79 99 119 0 0.5 1 1.5 2 µM Si(OH)4 -1 19 39 59 79 99 119 0 50 100 150 200 µM TCO2 -1 19 39 59 79 99 119 0 3 6mM 9 12 De pth ( cm ) Mn 0 20 40 60 80 100 Fe -1 19 39 59 79 99 119 0 20 40 60 80 100 SO4 -1 19 39 59 79 99 119 0 2x10⁴ 4x10⁴ 6x10⁴ 8x10⁴ 10x104 µM
Fig. 5 a - Pore water profiles of nutrients and TCO from cores colletcted in Gulf of Manfredonia in S1 station. Depth intervals were 0.5 cm for the first four points, 1cm for the next 4 points, 3 and 5 for the subsequent point., data are plotted at the mid-point of the interval. Two season are identified by the different symbols ( Winter, Summer). Points at -1 depth indicate bottom water values.
2
Fig. 5. (a) Pore water profiles of nutrients and TCO2from cores colletcted in Gulf of
Manfredo-nia in S1 station. Depth intervals were 0.5 cm for the first four points, 1 cm for the next 4 points, 3 and 5 for the subsequent point, data are plotted at the mid-point of the interval. Two season
are identified by the different symbols (red triangle = Winter, yellow square = Summer). Points
BGD
1, 803–823, 2004 Biogeochemical processes in sediments of the Manfredonia Gulf F. Spagnoli et al. Title Page Abstract Introduction Conclusions References Tables Figures J I J I Back CloseFull Screen / Esc
Print Version Interactive Discussion © EGU 2004 NO3 -1 19 39 59 79 99 119 0 0.5 1uM 1.5 2 NH4 -1 19 39 59 79 99 119 0 200 400uM 600 800 PO4 -1 19 39 59 79 99 119 0.0 0.5 1.0µM 1.5 2.0 Si(OH)4 -1 19 39 59 79 99 119 0 50 100 150 200 µM TCO2 -1 19 39 59 79 99 119 0 3 6mM 9 12 Mn -1 19 39 59 79 99 119 0 20 40uM60 80 100 Fe -1 19 39 59 79 99 119 0 20 40 60 80 100 uM SO4 -1 19 39 59 79 99 119 0 2x1044x1046x1048x10410x104 µM D D e e p p t t h h ( ( c c m m ) )
Fig. 5 b - Pore water profiles of nutrients and TCO from cores colletcted in Gulf of Manfredonia in S2 station. Depth intervals were 0.5 cm for the first four points, 1cm for the next 4 points, 3 and 5 for the subsequent point, data are plotted at the mid-point of the interval. Two season are identified by the different symbols ( Winter, Summer). Points at -1 depth indicate bottom water values.
2
Fig. 5. (b) Pore water profiles of nutrients and TCO2from cores colletcted in Gulf of
Manfredo-nia in S2 station. Depth intervals were 0.5 cm for the first four points, 1 cm for the next 4 points, 3 and 5 for the subsequent point. data are plotted at the mid-point of the interval. Two season
are identified by the different symbols (red triangle = Winter, yellow square = Summer). Points
BGD
1, 803–823, 2004 Biogeochemical processes in sediments of the Manfredonia Gulf F. Spagnoli et al. Title Page Abstract Introduction Conclusions References Tables Figures J I J I Back CloseFull Screen / Esc
Print Version Interactive Discussion © EGU 2004 -2000 -1500 -1000 -5000 500 1000 1500 2000 2500 S2_Summer S2_Winter -2000 -1500 -1000-500 0 500 1000 1500 2000 2500 O2
d x100 NO3 Mnx10 x10Fe NH4 TCO2x10 PO4x10 Si(OH)4 SO4
S1_Summer S1_Winter
10000
O2 Mn Fe
x100 NO3 x10 x10 NH4 TCO2x10 PO4x10 Si(OH)4 1000010000SO4
Fig. 6 Benthic fluxes of nutrients and TCO from deployments used in Gulf of Manfredonia in S1 and S2 station. Units are µmol m d for
nutrients and mmol m d for O and TCO2 2 2
-2 -2
Fig. 6. Benthic fluxes of nutrients and TCO2from deployments used in Gulf of Manfredonia in