HAL Id: hal-03010516
https://hal.archives-ouvertes.fr/hal-03010516
Submitted on 17 Nov 2020
HAL is a multi-disciplinary open access
archive for the deposit and dissemination of sci-entific research documents, whether they are pub-lished or not. The documents may come from teaching and research institutions in France or abroad, or from public or private research centers.
L’archive ouverte pluridisciplinaire HAL, est destinée au dépôt et à la diffusion de documents scientifiques de niveau recherche, publiés ou non, émanant des établissements d’enseignement et de recherche français ou étrangers, des laboratoires publics ou privés.
The dissolution anisotropy of pyroxenes: Experimental
validation of a stochastic dissolution model based on
enstatite weathering
Arnaud Bouissonnié, Damien Daval, François Guyot, Philippe Ackerer
To cite this version:
Arnaud Bouissonnié, Damien Daval, François Guyot, Philippe Ackerer. The dissolution anisotropy of pyroxenes: Experimental validation of a stochastic dissolution model based on enstatite weath-ering. Journal of Physical Chemistry C, American Chemical Society, 2020, 124 (5), pp.3122-3140. �10.1021/acs.jpcc.9b10824�. �hal-03010516�
The dissolution anisotropy of pyroxenes: Experimental validation
1
of a stochastic dissolution model based on enstatite weathering
2 3
Arnaud Bouissonnié1,*, Damien Daval1, François Guyot2, Philippe Ackerer1 4
5
1 Université de Strasbourg – CNRS / ENGEES – EOST, Laboratoire d’Hydrologie et de 6
Géochimie de Strasbourg, 1 Rue Blessig, 67084 Strasbourg, France 7
2 Institut de Minéralogie, de Physique des Matériaux et de Cosmochimie, Museum National 8
d'Histoire Naturelle, Sorbonne-Université, UMR 7590 CNRS, 61 rue Buffon 75005 Paris, 9
France 10
11
*corresponding author: [email protected] (A. Bouissonnié) 12
Tel: +33 (0)3 68 85 05 47; Fax: +33(0)3 68 85 04 02 13
Abstract
15
The understanding of the atomic-scale mechanisms controlling silicate dissolution 16
represents a necessary prerequisite for the success of upscaling exercises aimed at predicting 17
the rates of water-silicate interactions over large space and time scales. In that respect, it has 18
been recently shown that physically-based stochastic models of crystal dissolution at the 19
atomic scale represent a promising alternative to the conventional treatment of silicate 20
dissolution rates, which consists in using empirical rate laws adjusted to the results of powder 21
dissolution experiments. However, most stochastic simulations conducted so far have been 22
based on simple cubic solid structure, and very few were directed to ascertaining the extent to 23
which the simulation outputs quantitatively compare to experimental measurements. In the 24
present study, we take advantage of the anisotropic crystallographic structure and reactivity of 25
chain silicates (pyroxenes) to tackle this issue. Face-specific enstatite dissolution experiments 26
conducted at pH 0 and 90 °C reveal that the face-specific dissolution rates observe the 27
following trend: 𝑟( ) ≫ 𝑟( ) > 𝑟( ) ≥ 𝑟( ). Electron microscopy characterizations
28
additionally show that lenticular etch pits elongated following the c axis grow on (hk0) faces, 29
and that nm-thick amorphous Mg-depleted layers cover the reacted enstatite surfaces. A 30
stochastic model was developed, and we show that simulations conducted with bond-breaking 31
probability ratios (and therefore, activation energy differences) that are consistent with the 32
existing literature regarding the hydrolysis of Mg-O-Mg, Mg-O-Si and Si-O-Si bonds can 33
quantitatively account for the measured dissolution rates. In addition, the lenticular shape, the 34
orientation and the symmetry of the pits generated numerically on (hk0) faces are also 35
consistent with those observed experimentally, while predicting the formation of Mg-depleted 36
surface layers. As a consequence, this study provides a first milestone to the application of 37
stochastic simulations to investigate the dissolution of pyroxenes. 38
Keywords: stochastic model; pyroxene dissolution anisotropy; dissolution kinetics.
Abstract graphic
40
41 42
1. Introduction
43
The interactions between aqueous fluids and silicates play a central role in many major 44
geological, environmental and industrial processes. Silicate dissolution and precipitation 45
reactions control on various space and time scales many aspects of the continental surfaces 46
such as providing nutrients to living organisms1, participating to the surface water chemistry,
47
mobilizing 2 or sequestrating natural and anthropic contaminants3, shaping landscapes4 and
48
ultimately regulating the long-term carbon cycle and climate5-6. On an equal footing,
49
predicting the reactivity of silicate surfaces is further important for industrial purposes, such 50
as cement hydration7-8 and kinetics of catalyzed reactions9. As a consequence, the dissolution
51
rates of silicates have now been investigated for more than half a century, giving rise to a 52
dense body of literature (e.g. Brantley et al.10 for a review).
53
From a mechanistic standpoint, the conventional treatment of mineral reactivity has long 54
been based on the fundamental assumption that silicate dissolution may be described within 55
the framework of the transition state theory (TST), early developed by Eyring11 for
56
elementary and homogeneous reactions. The extension of TST by Aagaard and Helgeson12to
57
heterogeneous fluid-solid reactions supposes that silicate dissolution reactions are controlled 58
by a unique rate-limiting step, implicitly requiring that the surface reactivity is homogeneous, 59
isotropic and immutable for a given fluid composition13. Although the resulting ‘kinetic rate
60
laws’ have been implemented into reactive transport codes for several decades, an increasing 61
number of studies has consistently challenged this conceptual framework: 62
First, it has been theoretically and experimentally demonstrated that mineral reactivity is 63
highly heterogeneous, resulting from the distribution of reactive sites at the fluid-solid 64
interface14. The ‘rate spectra’ concept15, which provides a measurement of the rate
65
distribution at the mineral surface in the spatial domain, was developed to indirectly capture 66
this energetic landscape. 67
Second, the advent of nanoscale imaging of surface topography has resulted in the 68
demonstration that crystal dissolution is a highly anisotropic process8, 16-24. These studies
69
showed that the anisotropic reactivity of minerals results from the anisotropic distribution of 70
atomic positions in the crystal lattice, and may be described in the framework of the periodic 71
bond chain (PBC) theory25. This theory suggests that crystal faces may be sorted following
72
the number of chains of energetically strong bonds (PBCs) they contain, with the faces 73
containing the largest numbers of PBCs dissolving slower, and vice versa. Pollet-Villard et 74
al.21 further proposed that the recognition of the anisotropy of crystal reactivity challenged the
75
idea of a unique relation between the overall dissolution rate of a crystal and the Gibbs free 76
energy of reaction (∆G), which is constitutive of the TST formulation, while questioning the 77
existence of a unique intrinsic dissolution rate constant for crystals. 78
Finally, silicate dissolution is accompanied with gradual physicochemical and structural 79
modifications of their surface, resulting in the formation of nm- to µm-thick silica-rich surface 80
layers26-31. Accounting for the transport properties of such layers, especially when developed
81
under mildly aggressive conditions (circum-neutral pH, low temperature), was also proposed 82
to be essential to develop reliable models of silicate dissolution23, 32.
83
In a nutshell, all these studies converge towards the same conclusion: providing a better 84
theoretical description of mineral dissolution crucially requires gaining knowledge on the 85
relation between the atomic configuration of (and therefore, the energetic distribution at) the 86
dissolving mineral surface and the overall dissolution rate of a given crystal. 87
Driven by this assertion, studies dedicated to the molecular-scale description of the 88
silicate dissolution process following ab initio quantum mechanical calculations emerged 89
some 20 years ago33-38. Such studies shed light on essential theoretical information regarding
90
the dissolution process such as suggesting reaction paths, determining transition state 91
configurations (i.e., bond lengths and angles) and calculating activation energies of the 92
hydrolysis reactions in various pH domains. They also independently confirmed that the 93
dissolution process cannot be boiled down to the kinetics of a single surface reaction. 94
Actually, the large number of possible configurations of dangling atoms at the silicate surface 95
over the course of the dissolution translates into as many possible different hydrolysis 96
reactions, justifying the need for specific numerical simulations of the dissolution process at a 97
scale exceeding clusters of a few atoms. This was precisely one of the motivations for the 98
development of kinetic models using a Monte Carlo approach (often abbreviated as kMC)9, 22,
99
39-47, whose parametrization may strongly rely on the results of ab initio calculations
100
mentioned above. However, with the noticeable exception of a few recent studies9, 22, 45, to
101
date, most of these modelling studies were conducted with simple Kossel crystals48, making
102
difficult the direct comparison of the outputs of the simulations with experimental data. 103
In the present study, we combined experimental measurements of the anisotropy of 104
silicate dissolution (face-specific topographic features and dissolution rates) with stochastic 105
simulations to critically assess the validity of a simple dissolution model. Because of its very 106
anisotropic crystallographic structure made of chains of silica tetrahedrons running parallel to 107
one of the main crystallographic axes, pyroxene was chosen as a case study. It was previously 108
shown that the anisotropic structure of this family of silicates (also known as inosilicates) 109
resulted in a strong anisotropy of dissolution18, 23, 49, intensifying the differences of reactivity
110
between the various faces that define their usual crystal habit. Owing to its simple chemical 111
composition (MgSiO3) and structure (orthorhombic), enstatite was chosen as a model within 112
the pyroxene group. 113
After a brief description of the methods used and the ensuing information, we will 114
discuss the experimental results (i.e., the anisotropy of enstatite dissolution rates and surface 115
features observed using electron microscopy) in regard of pre-existing studies based on 116
pyroxene dissolution. These results will then be compared to the outputs of the simulations, 117
which will lead to a validation of the dissolution model and a discussion of the wider 118
implications and conclusions for pyroxene dissolution and dissolution mechanisms at the 119
fluid-silicate interface. 120
121
2. Materials and methods
122
2.1 Starting materials and preparation
123
The enstatite samples used in this study come from Kilosa (Tanzania), and were supplied 124
by Mawingu Gems Company. Negligible amounts of clinoenstatite (around a few wt. %) were 125
detected using X-ray diffraction (Fig. S1). Monolithic enstatite samples (up to several tens of 126
mm on a side) were cut with a diamond blade saw and polished down to the nanometer scale 127
through a multi-step abrasive sequence. The crystallographic orientation of each sample was 128
determined using an electron backscatter diffraction (EBSD) detector attached to a scanning 129
electron microscope (SEM) (TESCAN® Vega 2). The initial roughness of each surface was 130
measured at different scales with vertical scanning interferometer (VSI; ZYGO® NewView 131
7300). For each sample, the initial average arithmetic roughness (Ra), defined as the 132
arithmetic average of the absolute values of the roughness profile, ranged between 5 nm and 133
15 nm, and Rq (the roughness calculated with the root-mean-square of the vertical distance 134
between the surface elevation and the mean surface line) ranged between 19 nm and 70 nm. 135
These initial roughness parameters were measured on 270 × 360 µm2 images obtained using 136
VSI. 137
2.2 Dissolution experiments and analytical procedures
138
Oriented samples were mounted in a passivated titanium support as designed by Daval et 139
al.18, where a Viton® disk held with a screw creates a non-wetted reference area. Partially
for durations ranging from 6 hours to 3 weeks to check for the linearity of the surface retreat 142
as a function of time. 143
The aqueous solutions were made with ultrapure deionized water (18.2 MΩ.cm) and 144
analytical grade nitric acid. The pH was adjusted to 0.0 ± 0.2. Nitric acid was chosen to avoid 145
the dissolution of the titanium support that was observed in preliminary tests conducted with 146
hydrochloric acid under similar conditions. Solution sampling was regularly carried out for 147
the analyses of Si, Mg and Fe using ICP-AES (Thermo ICAP 6000). The CHESS code50 was
148
used to determine the in situ pH and saturation indices with respect to enstatite and secondary 149
phases. It was verified that all solutions were undersaturated with respect to any secondary 150
phase. 151
For each orientation, at least two solid samples were analyzed for topography 152
measurements. While the first one was periodically recovered to perform the analyses and put 153
back in reactor, the second sample was left in the reactor all over the duration of the 154
experiment. This protocol was followed to make sure that the reactivity of samples that 155
experience wetting/drying cycles to get time-resolved topography measurements remains 156
similar to the reactivity of samples continuously immersed in solution. The topography 157
measurements were performed using VSI in stitching mode (magnification: ×5) to estimate 158
the average changes in height between the unreacted reference surface and the reacted mineral 159
surface. For each oriented sample, dissolution rates were calculated according to the 160
following equation (see e.g. Lüttge et al.51):
161
𝑟( ) = ∆ℎ
∆𝑡𝑉 (1)
where 𝑟( ) (mol.m-2.s-1) is the dissolution rate of the (hkl) face, Δh is the surface retreat (m), 162
Δt is the alteration duration (s) and 𝑉 (m3.mol-1) is the molar volume of enstatite. As detailed 163
below, the minute lateral extension of etch pits (~ a few tens of nm) prevented the 164
300 nm), rendering impossible more sophisticated treatment of the surface topography using 166
e.g. rate spectra. 167
After completion of the surface topography measurements, the formation of nm-thick, 168
amorphous Si-rich layers (ASSL) was verified to make sure that the layer thickness was 169
negligible compared to the corresponding surface retreat measured by VSI. The samples were 170
either platinum- or carbon-coated and thin sections perpendicular to the investigated faces 171
were prepared by focused ion beam (FIB) milling using the FEI Helios 600 Nanolab dual-172
beam operating at CP2M (Marseille, France). The FIB Ga ion milling was carried out at an 173
ion beam voltage of 30 kV and with beam currents from 3 nA to 10 pA for the final steps. 174
Micrometer-thick sections were lifted out in situ using an Omniprobe 200 micromanipulator 175
and transferred to a half copper grid for final ion milling to electron transparency (final 176
thickness of about 100 nm). High-resolution transmission electron microscopy (HRTEM) and 177
scanning transmission electron microscopy (STEM) observations were performed on FIB 178
foils using a JEOL 2100F microscope operating at 200 kV, equipped with a field emission 179
gun. Energy dispersive X-ray (EDX) spectra were acquired in STEM mode to probe the 180
chemical compositions, with a focused electron beam (1 nm). When the FIB thin section 181
intersected etch pits (i.e., for the (100) and (010) samples), TEM was further used to 182
characterize their morphologies. 183
2.3 Modeling strategy
184
The stochastic approach for mineral dissolution studies has emerged in the mid-80’s52.
185
Since then, numerous studies have used stochastic simulations to describe mineral dissolution 186
at the atomic scale, principally using simple Kossel crystals43, 47-48 (simple cubic crystal
187
lattice; 6-fold coordinated atoms) but some have also applied them on more complex mineral9,
188
22, 41 and glass40, 44, 53 structures. These studies have shown the robustness of these models
through their ability to reproduce etch pit shapes9, 22 and sometimes, by comparing modeled
190
and measured dissolution rates22.
191
These models are based on a simple relation that links the bond-breaking probability 192
to the activation energy of the hydrolysis of this bond52:
193
𝑃 = 𝑒 ∆ (2)
where P is the bond-breaking probability, ∆Ea, the activation energy (J), kB, the Boltzmann 194
constant (J/K) and T the temperature (K). 195
196
Fig. 1. Projection of enstatite structure following [100] (A), [001] (B), [010] (C) zone axes and a rotation view of 197
the enstatite volume (D) to highlight the chains of silicate tetrahedrons. The Mg, Si and O atoms are represented 198
by red, green and blue spheres respectively. Si tetrahedrons are represented in light green. 199
200
2.3.1 Modeling enstatite crystal structure
201
Enstatite is an inosilicate made of chains of silicate tetrahedrons running parallel to the c-202
axis. The crystal lattice of orthoenstatite (used in the present study) is orthorhombic and 203
belongs to the Pbca space group. Hugh-Jones et al.54 have provided the coordinates of the
204
atomic positions (Table 1) that allow forming the enstatite cell with the following relations 205
corresponding to the Pbca system: 206 x y z ½ - x ½ + y z x ½ - y ½ + z ½ + x y ½ - z (3) -x -y -z ½ + x ½ - y -z -x ½ +y ½ -z ½ -x -y ½ +z
The lengths of the a, b and c axes are 18.233, 8.8191 and 5.1802 Å respectively and the 207
angles α, β and γ are equal to 90° (orthorhombic system). 208
The enstatite unit cell was created based on these parameters, and is composed of 16 209
atoms of magnesium, 16 atoms of silicon and 48 atoms of oxygen. The cell is then repeated 210
following the three space dimensions in order to get a simulated crystal of several tenths to 211
hundreds of nanometers on a side. 212
Mg and Si atoms were connected to O atoms according to the following rules: (i) Mg 213
atoms are located in octahedral sites and Si atoms in tetrahedral sites (i.e., Mg atoms are 214
connected to 6 O atoms and Si atoms are connected to 4 O atoms) and (ii) the closest O atoms 215
were considered to create the coordination spheres surrounding each cation. The resulting 216
modeled surfaces ((100), (010) and (001)) are shown in Fig. 1. 217
Atoms x/a y/b z/c Mg 1 0.3763 0.6541 0.8663 Mg 2 0.3769 0.4872 0.3589 Si 1 0.2715 0.3418 0.0506 Si 2 0.4736 0.3374 0.7981 O 1 0.1835 0.3407 0.0340 O 2 0.3114 0.5029 0.0430 O 3 0.3025 0.2224 0.8320 O 4 0.5622 0.3414 0.7980 O 5 0.4324 0.4836 0.6900 O 6 0.4483 0.1951 0.6030 219
Table 1. Atomic coordinates in enstatite cell54used in Eq. (3) to form the entire cell. 220
221
2.3.2 Bond-breaking probabilities
222
Most stochastic simulations performed at the atomic scale on silicate materials 223
consider the cleavage of M-O-M bonds instead of single M-O bonds9. Hence, the oxygen
224
atoms are only considered as bridges between two cations (Obr), and the cations connected to 225
the oxygens of a specific Si or Mg atoms are referred to as their first coordination spheres9. In
226
enstatite, three types of bonds exist: Mg-Obr-Mg, Mg-Obr-Si and Si-Obr-Si bonds. 227
Two different strategies may be considered to develop stochastic models: the former 228
considers that the release of a cation results from the sequential cleavage of each bond which 229
connects it to the surface, and the latter considers that the cation release results from the 230
simultaneous cleavage of all these bonds at a given iteration step. The difference between the 231
two methods stands in the number of information required to run a simulation (for a single 232
enstatite cell, 160 bonds need to be considered following the first strategy whereas only 32 233
atoms (16 Mg and 16 Si atoms; O atoms being considered as “bridges”) are required for the 234
second strategy). For this reason, the second strategy is generally used and has previously 235
proven successful9, 22, 41, 44, 53. Accordingly, our simulations were run using the following
236
probability for the release of Mg and Si atoms: 237
𝑃 = 𝑒
∆
where M = Mg or Si and n and m correspond to the number of Mg and Si atoms linked to the 238
considered M atom, respectively. This equation, together with knowledge of the connectivity 239
of each atom, represents the core description of the physical basis adopted for our stochastic 240
simulations. Importantly, more sophisticated relations may be found in the literature, which 241
attempt to account for various physical processes such as lattice resistance34, 45, steric
242
constraints9 or backward attachment reactions possibly resulting in self-healing of disrupted
243
Si-Obr-Si bonds34, 40-41, 44. Importantly, even if the resulting stochastic models are physically
244
more robust, they also introduce significant degrees of freedom in the parametrization of the 245
resulting bond-breaking probabilities (see bond-breaking probability expressions and 246
parametrization derived in, e.g., 9, 40). In contrast, the present work was intended to assess the
247
extent to which a stochastic approach with the simplest physical basis can satisfactorily 248
account for the main face-specific features of enstatite dissolution, explaining why we used 249
the simple relations provided by Eq. (4). 250
Various algorithms may be used to run stochastic simulations. In the present study, we 251
followed a strategy close to the “random select and test” approach previously described and 252
used in e.g. 40, 43 (see section 2.3.4). As described in these studies, this approach consists in
253
scaling to unity the most probable event, and scaling accordingly the probabilities of all other 254
events. Equation (4) then simply becomes: 255
𝑃 = 𝑃 × 𝑃 (5)
with 0 < PM-O-Mg, PM-O-Si < 1. According to ab initio and experimental studies, the most 256
probable event is the detachment of an Mg atom bonded to the surface via a single Mg-O-Mg 257
bond. The corresponding probability was then set to 0.99 and can be associated, by 258
identification, to the Mg-O-Mg activation energy term in Eq. (4). The two other elementary 259
probabilities (PMg-O-Si and PSi-O-Si) were calculated in order to observe the theoretical 260
difference of activation energies between the hydrolysis of Mg-O-Mg and that of Mg-O-Si or 261
Si-O-Si, respectively. Considering the ab initio data from36, 38for the activation energy of
Si-262
O-Si (∆𝐸 = 69 kJ/mol) and Mg-O-Si (∆𝐸 = 59 kJ/mol) hydrolyses and the 263
experimental data from 55 for Mg-O-Mg hydrolysis (∆𝐸 = 60 ± 12 kJ/mol), the
264
range of difference in activation energy that was explored is [0 ; 10 kJ/mol] for the {Si-O-Si ; 265
Mg-O-Si} pair and [0 ; 4 kJ/mol] for the {Mg-O-Mg; Mg-O-Si} pair. 266
267
2.3.3 Dislocations
268
Etch pits are known to nucleate at dislocations outcropping at crystal surfaces56. In
269
order to compare the observed and simulated morphology of etch pits on each face, screw 270
dislocations were introduced in the model. The main dislocations for enstatite follow the 271
[001], [010] and [100] axes57. Therefore, screw dislocations are perpendicular to the different
272
studied orientations, except for the (210) face. In order to propagate the dislocation in the 273
volume, the distances between the first atom (located at the center of the reactive surface) and 274
its neighbors in the xOy plan are calculated. The shortest distance defines the atom that will 275
be the next one belonging to the dislocation line. The same process is repeated until reaching 276
the opposite face of the simulated crystal. For the (210) face, a rotation of the volume is made 277
before applying these steps in order to respect the dislocation directions ([100] and [010]). 278
Finally, when all the atoms that belong to the dislocation line are identified, their bond-279
breaking probabilities are set to 19, 22.
280
281
2.3.4 Dissolution algorithm
282
The “random select and test” (RST40, 43) and “divide and conquer” approaches (DaC43,
283
58) are two different algorithms commonly used in stochastic simulations. Nowadays, the DaC
284
algorithm is usually preferred because it requires less computer time. Furthermore, it provides 285
a correspondence between iteration and time9. However, DaC algorithms cannot reproduce
simultaneous events, and favor a “layer-by-layer” removal of atoms41. For these reasons, we
287
preferred using an approach close to the “primitive” RST despite its poor computation 288
efficiency. Moreover, time cannot be associated a priori to a number of iterations. This 289
relation has to be inferred using at least two experimental data sets (e.g., two dissolution rates 290
for two different faces). By measuring mean dissolution rates for 4 different faces, we made 291
sure that the problem was overconstrained, ensuring a well-established relationship between 292
time and simulation steps (iterations). 293
The crystal is described by the coordinates of the Mg and Si atoms and the 294
connectivity of each atom to its neighbors follows the rules described in Section 2.3.1. Only 295
the cations that have an incomplete first coordination sphere (incomplete connectivity), are 296
considered to be located at the crystal surface, and may experience dissolution. For each Mg 297
and Si atom, an integer number indicates the three possible states of the atom: (i) dissolved, 298
(ii) at the crystal surface, or (iii) inside the crystal. This indicator allows counting the number 299
of dissolved cations and their nature (Mg or Si) and identifying the atoms located at the 300
surface in an efficient way. 301
The algorithm for simulating the dissolution process is as follows: 302
1. At each iteration step k, all cations of the simulated crystal volume are scanned 303
sequentially (Loop 1 in Fig. S2). 304
2. For each surface cation, a random number Z uniformly distributed between 0 305
and 1 is generated. The probability of dissolution of that atom PM is computed as 306
the product of the bond-breaking probabilities of the bonds that link it to the 307
crystal following Eq. (5). If Z < PM, the atom is released (dissolved). If not, the 308
scan of the atoms is moving on (Loop 2 in Fig. S2). 309
3. When the scan of all atoms is completed, the first coordination spheres of the 310
remaining atoms are updated if necessary (i.e., when a removed atom was 311
belonging to the coordination spheres of one of the remaining atoms; cf. Loop 3 in 312
Fig. S2). Because the coordination spheres are modified, the probability of 313
dissolution PM of the corresponding atoms are increased. 314
4. The number of released Si and Mg atoms at iteration k is saved for post-315
processing. 316
5. The iteration number is incremented and the process continues step 1. 317
2.3.5 Model outputs
318
The outputs of the simulations were used to document face-specific features of 319
enstatite dissolution, such as (i) the mean dissolution rates at steady-state conditions, (ii) the 320
thickness of the Si-rich surface layer that may result from preferential leaching of Mg (if any) 321
and (iii) the etch pit morphology. 322
The dissolution rates may be calculated following two different approaches. First, the 323
list of surface cations after a given iteration is used to calculate the corresponding mean 324
elevation of the surface (𝑧 = ∑ , 𝑧 𝑁
, ) and infer the
325
corresponding mean surface retreat rate ([nm/iteration]), which can be converted into a 326
surface normalized dissolution rate 𝑟( ,) ([mol/m²/iter]) using Eq. (1) (in which the 327
number of iterations is substituted for time). When steady-state conditions are reached (i.e., 328
when 𝑟( ,) becomes constant), this approach can be related to the dissolution rates 329
estimated using VSI (see section 2.2). Of note, the difference in terms of surface areas 330
between the simulated (0.33 µm² for the largest) and measured (dozens of mm²) surfaces 331
preclude any direct use of the rate spectra concept15, so that in the present study, only the
332
mean surface retreat rates were subsequently used as a criterion to assess the correspondence 333
between simulated and measured dissolution rates. 334
A second approach considers the amount of Mg and Si atoms released at each 335
iteration, as could be determined experimentally using ICP-AES solution analyses. Distinct 336
rates based on Mg (𝑟( ,) ([mol/m²/iter])) and Si (𝑟( ,) ([mol/m²/iter])) release were 337 calculated following: 338 𝑟( ,) = ∑ 𝑁 , ∗ 𝑉 𝑖𝑡 ∗ 𝑁 , ∗ 𝑆 ∗ 𝑉 (6a) 𝑟( ,) = ∑ 𝑁 , ∗ 𝑉 𝑖𝑡 ∗ 𝑁 , ∗ 𝑆 ∗ 𝑉 (6b)
where it represents the iteration step at which the calculation is performed, NM,i, the number of 339
Mg or Si atoms released after the ith iteration, NM,cell, the number of Mg or Si atoms in the cell 340
(16), Vcell the enstatite cell volume, 𝑉 the molar volume of enstatite and S, the geometric 341
surface area of the reactive surface. 342
While this approach eventually yielded results very close to the previous method, it 343
further provided information regarding the stoichiometry of the dissolution by comparing the 344
evolution of the departure of the Mg and Si atoms, and eventually, regarding the existence 345
and thickness of a Si-rich surface layer, which was previously documented for inosilicates 346
weathered experimentally18, 23, 59-61. Since the model does not consider the backward reaction
347
of Si attachment to the surface (see discussion in 41, 62), it only indicates a lower bound for the
348
thickness of the layer resulting from cation depletion, ignoring possible Si re-deposition 349
following an interfacial dissolution-reprecipitation mechanism. 350
Finally, for simulations run with dislocations, the resulting etch pits and surface 351
retreats were calculated using Surfer©. The coordinates of the atoms at the surface were 352
stored and used as an input file for Surfer. The minimum curvature method was used to 353
calculate the mean surface retreat at a given iteration. 354
355
2.3.6 Linking time to iteration
As mentioned above, simulation results are normalized to the number of iterations 357
instead of elapsed time. However, in order to compare modeled and measured dissolution 358
rates, it is necessary to link a single iteration to a physical time increment. The 359
correspondence between time and iteration was determined following Eq. (7): 360 𝑡 = 〈𝑟 ( ) 𝑟( )〉 𝑖𝑡 (7) 361
3. Results
3623.1 Face-specific dissolution rates of enstatite revealed experimentally
363
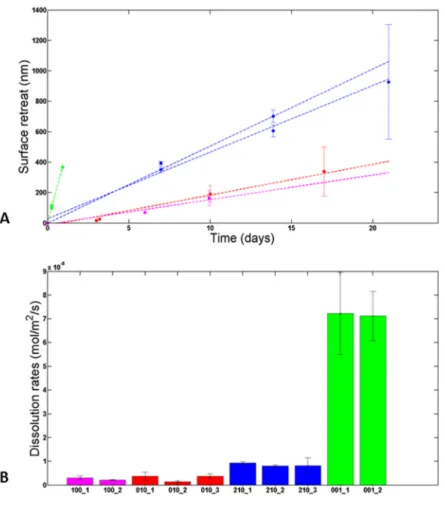
Fig. 2A shows the temporal evolution of the mean surface retreat measured using VSI. 364
Whereas the (hk0) faces were reacted for durations of up to three weeks, the rapid increase of 365
the roughness of the (001) face prevented the measurements of surface topography for 366
durations exceeding a couple of days. The main results are as follows: 367
(i) the dissolution rate is constant through time (at least from the first experimental 368
measurements) for all of the four faces, within experimental uncertainties; 369
(ii) the dissolution rates of the samples left in the reactor all over the duration of the 370
experiments are similar to those that were periodically retrieved from the reactors; 371
(iii) enstatite dissolution is an anisotropic process (i.e., the slopes of the linear 372
regressions differ from one face to the other). The face-specific dissolution rates (𝑟( )) 373
observe the following trend: 𝑟( ) ≫ 𝑟( ) > 𝑟( ) ≥ 𝑟( ). The mean values of 374
dissolution rates are 71.8 ± 13.9, 8.5 ± 1.5, 3.0 ± 1.0 and 2.6 ± 0.6 nmol/m²/s for the (001), 375
(210), (010) and (100) faces, respectively (Fig. 2B). 376
377
Fig. 2. A. Face-specific temporal evolution of the mean surface retreat measured with VSI and associated linear 378
regressions. B. Measured face-specific dissolution rates. For both graphs, magenta, red, green and blue colors 379
stand for the results obtained for (100), (010), (001) and (210) faces, respectively. 380
381
3.2 Face-specific microstructural features revealed experimentally
382
The etch pits possibly formed on each surface were too small to be properly 383
investigated by VSI, whose resolution is close to 300 nm at the maximum 100x-384
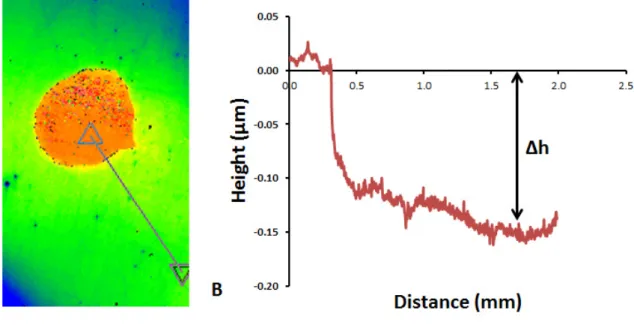
magnification. Apart from the surface retreat between the masked and unmasked portions of 385
the samples (Fig. 3), no specific topography feature could be evidenced using VSI. 386
387
Fig. 3. A. Surface topography of the (001) surface dissolved for ~ 8h measured using VSI. The red spot 388
represents the mask (non-reacted) area while the blue/green area represents the reacted surface. B. Topography 389
of the surface (straight line in A) after dissolution. The upper part corresponds to mask area while the lower part 390
corresponds to the reacted area. 391
392
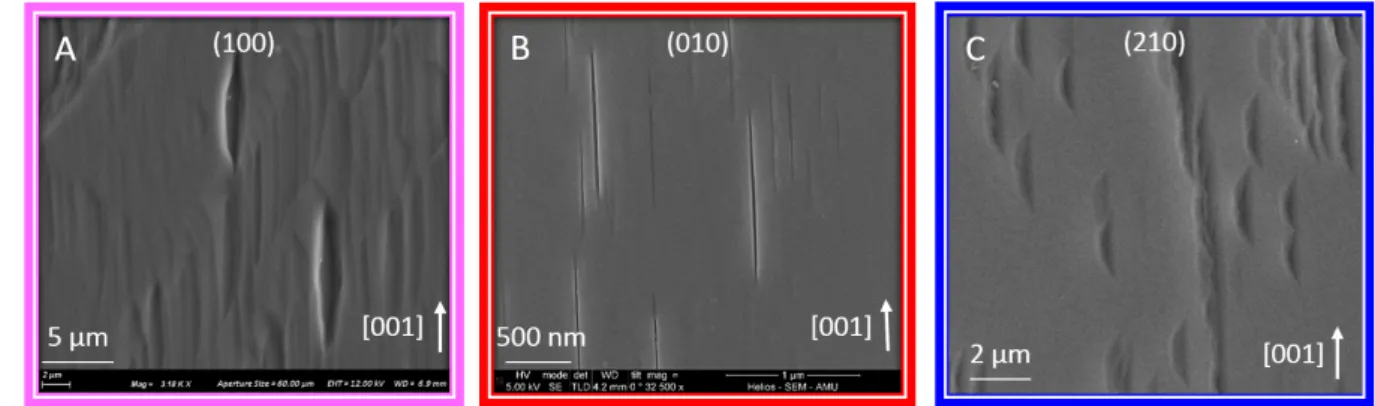
SEM imaging of the reacted surfaces revealed that etch pits did nucleate on three of 393
the four investigated faces (Fig. 4), and confirmed that their lateral extension was too modest 394
to be imaged by VSI. The (100) and (010) faces exhibited similar lenticular pits elongated 395
following the c-axis (the major axis is more than 6 times larger than the minor axis). The 396
shape of the pits projected to the horizontal surface shows a central symmetry, consistent with 397
the shape previously described in the literature for pyroxenes in general18, 60, 63-65. Two types
398
of pits are visible on the (210) face: while the former is similar to the ones observed on the 399
(100) and (010) faces (with a small minor axis compare to the major axis), the latter, also 400
elongated following the c-axis, presents a wider minor axis (3 times smaller than the major 401
axis). In addition to this difference of minor-axis length, these pits differ from the ones 402
observed on the other faces by their non-symmetrical, half-moon shape. Whereas the lowest 403
points for the pits developed on the (100) and (010) faces are located at the center of the pits, 404
conversely, for pits developed on the (210) face, the lowest point is located at the center of the 405
major-axis but shifted on one edge of the minor-axis (Fig. 4C). 406
The dislocation density is also a function of crystallographic orientation. The number 407
of dislocations has been calculated on each face by counting the number of etch pits observed 408
by SEM on surface areas of ~ 300 µm². Of note, polishing scratches also represented an 409
important source of etch pits. Because they can contribute to the global dissolution rate by 410
exposing step sites, they have been taken into account in the calculation of the dislocation 411
density. 412
413
Fig. 4. SEM images of the surface of (001) (A), (010) (B) and (210) faces reacted at pH 0 for 7 to 21 days. The 414
images reveal the nucleation of lenticular etch pits elongated following the [001] direction. Note the asymmetric 415
shape of the pits nucleated on the (210) face, as opposed to those developed on the other two faces. 416
417
The dislocation density on the (100) and (210) faces was found to be similar (on the 418
order of 4.9 ± 0.3 × 10⁸ dislocations / cm²), and is about two orders of magnitude greater than 419
that measured on the (010) face (9.8 × 10⁶ dislocation / cm²). The dislocation density on the 420
(001) face could not be determined because of the rapid roughening of the surface, which 421
impeded the identification of individual etch pits. These dislocation densities are in agreement 422
with other studies66-67, which reported dislocation densities ranging between 4.0 x 10⁷ and 7.0 423
x 108 dislocations / cm². The close correspondence between the dislocation density calculated 424
for the (100) and the (210) faces may be explained by the main orientation of screw 425
dislocations for the enstatite structure. As mentioned in section 2.3.3, the main dislocations in 426
enstatite follow the [100], [010] and [001] directions57. Therefore, outcropping dislocations at
427
the (210) surface should represent the sum of the dislocation outcropping at the (100) and the 428
(010) surfaces, which is consistent with our observations. 429
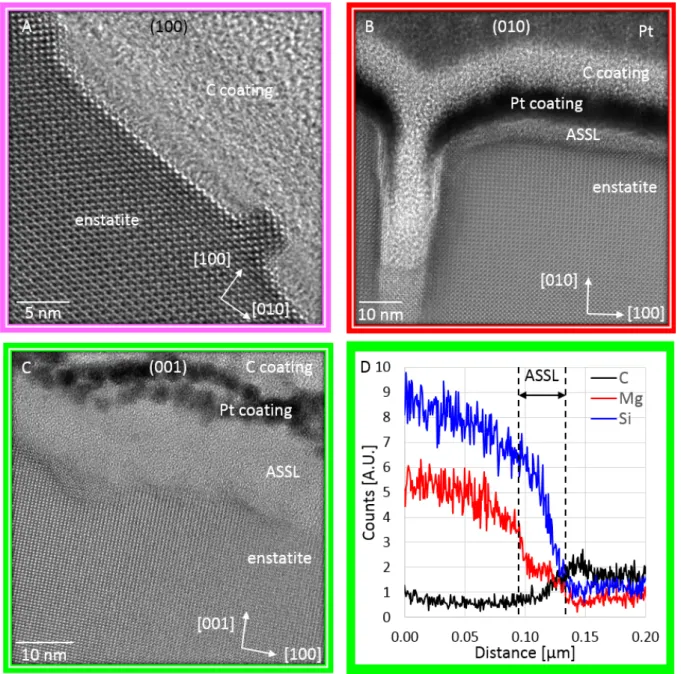
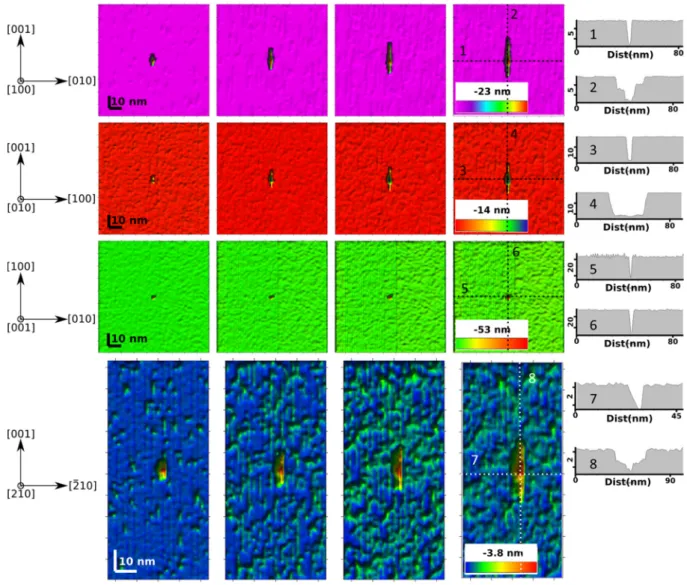
TEM investigations performed on FIB thin sections prepared on the reacted samples 430
revealed the occurrence of amorphous surface layers on (010), (210) and (001) samples, with 431
a thickness specific to the surface orientations (Fig. 5). The thickest layers were evidenced on 432
(001) samples (15-20 nm; cf. Figs. 5C-D). The layers developed on (210) and (010) samples 433
have similar thickness (≤ 4 nm; cf. Fig. 5B), whereas no surface layer could be clearly 434
evidenced on (100) samples (Fig. 5A). The layers developed on (001) samples were thick 435
enough to analyze their chemical composition with STEM-EDX, which revealed that they are 436
Si-rich and Mg-depleted (Fig. 5D). The similarity of these results with those reported by 437
Daval et al.18 for diopside dissolved at pH 1 is noteworthy. Finally, it was possible to
438
determine the cross-section morphology of etch pits nucleated on the (100) and (010) faces, as 439
the FIB thin sections were realized in locations where etch pits were particularly abundant. 440
Regarding the (010) face, TEM images revealed that the pit geometry observes an axial 441
symmetry with respect to the [010] axis, and that the pit walls are particularly steep, forming 442
an angle of 93° ± 2° with the (010) surface (Fig. 5B). Similarly, the walls of the pits 443
developed on the (100) face formed an angle of 97° ± 5° with the (100) surface, although the 444
pits appear to be flat-bottomed (Fig. 5A). Overall, these results confirmed that profilometry 445
techniques such as atomic force microscopy or vertical scanning interferometry would have 446
failed to reveal the 3D-geometry of such etch pits. 447
449
Fig. 5. TEM characterizations of FIB thin sections prepared on (100) (A), (010) (B), and (001) (C and D) reacted 450
surfaces. HRTEM images in (B) and (C) reveal the formation of a nm-thick amorphous layer formed on the 451
surface, with a sharp crystallographic boundary between enstatite and the surface layer. For the FIB thin section 452
realized on (001) surface, STEM-EDX profiles measured parallel to the [001] direction reveal that the surface 453
layer is Si-rich and Mg-depleted (D). 454
455
3.3 Model outputs
456
3.3.1 Dissolution stoichiometry and steady-state dissolution rates
458
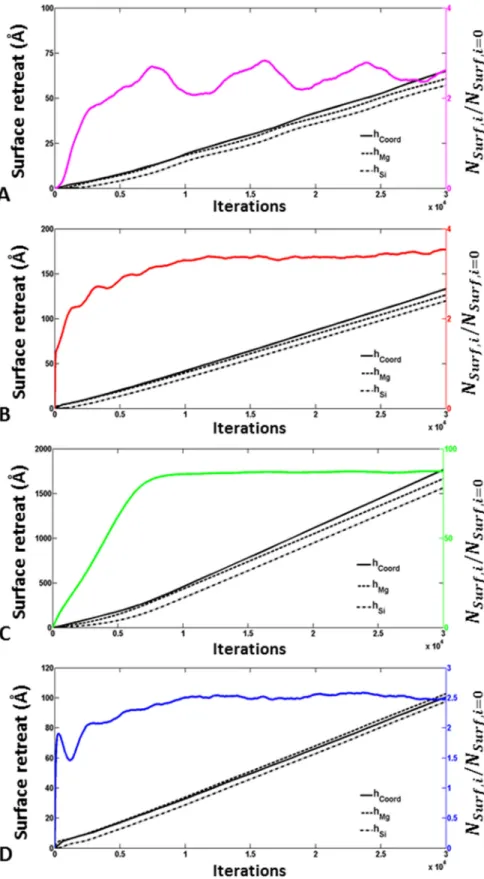
Fig. 6. Outputs of the simulations conducted with the bond-breaking probabilities corresponding to the best 459
agreement between measured and modeled dissolution rates (see text for details) for (100) (A), (010) (B), (001) 460
(C) and (210) (D) faces. The evolution of the modeled surface retreat calculated following three different 461
cations, normalized to the initial number of cations at the enstatite surface. Note that the increase of the number 463
of surface atoms is much greater for (001) face (about an 80-fold factor) than for the other (hk0) faces (between a 464
2.5- and 3.8-fold factor). 465
466
A common trait to all of the simulation outputs, irrespective to the set of bond-467
breaking probabilities that have been tested, is the attainment of a steady-state dissolution 468
regime, which is characterized by a congruent release of Mg and Si cations and a constant 469
dissolution rate (Fig. 6). This steady-state regime was found to result from the attainment of a 470
constant number of atoms at the surface of each face, as illustrated in Fig. 6 (color lines). 471
During the initial transient period, Mg is released preferentially, and enstatite dissolution 472
rate based on Si release increases gradually. The duration and the shape of the transient period 473
depend on the set of bond-breaking probabilities that are used to run the simulations and is a 474
function of surface orientation. In a general manner, the steady-state regime is achieved 475
earlier for the (hk0) faces than for the (001) face, for which the initial non-congruence of the 476
dissolution is also more pronounced (Fig. 6). As a consequence, thicker ASSLs are expected 477
to build up on the (001) face, compared to the (hk0) faces. When one considers the set of 478
bond-breaking probabilities that allows for the best agreement between the modeled and 479
measured steady-state face-specific dissolution rates (see below), the modeled thickness of 480
ASSL is on the order of 1-2 atomic monolayers for all (hk0) faces, as opposed to ~ 10 nm for 481
the ASSL developed on the (001) face. 482
The modeled absolute values of steady-state dissolution rates and the relative differences 483
between the reactivity of the four faces depend on the set of bond-breaking probabilities that 484
were used to conduct the simulations. Considering a range of probabilities that is consistent 485
with the literature (see section 2.3.2) and the dislocation density determined experimentally 486
for each face, the modeled face-specific dissolution rates 𝑟( ) observe the following trend: 487
various (hk0) faces depend on the set of probabilities used to run the simulations. The best 489
agreement between modeled and measured steady-state dissolution rates is obtained for P Mg-O-490
Mg = 0.99; PMg-O-Si = 0.4 and PSi-O-Si = 0.0146 (i.e., ∆𝐸 − ∆𝐸 = 10 kJ/mol 491
and ∆𝐸 − ∆𝐸 = 2.7 kJ/mol), for which the modeled face-specific 492
dissolution rates 𝑟( ) observe the following trend: 𝑟( ) ≫ 𝑟( ) > 𝑟( ) > 𝑟( ). 493
Whereas the amplitude of the reactivity measured between the fastest and slowest dissolving 494
face is well reproduced by the model, one can note that it slightly overestimates the reactivity 495
of the (010) face (or slightly underestimates the reactivity of the (210) face). 496
497
3.3.2 Morphology of modeled etch pits
498
The implementation of dislocation lines in the simulated crystals allowed to document 499
the morphology of etch pits for the four investigated faces. Fig.7 depicts the modeled surface 500
evolution of the four studied faces, centered on an outcropping dislocation line, for 501
simulations ranging from 0 to 2,000 iterations. Screw dislocation orientations were chosen 502
following those determined by Skrotzki57 for enstatite: [100] for (100) and (210) faces, [010]
503
for the (010) face and [001] for the (001) face. These results were obtained using the set of 504
bond-breaking probabilities corresponding to the best agreement between the modeled and 505
measured steady-state face-specific dissolution rates. 506
Etch pits growing on the (100) face were found to be lenticular and symmetric with 507
respect to the b- and c-axes, respectively (cross-sections 1 and 2). Their aspect ratio evolves 508
as a function of the reaction progress, as their length following the c-axis increases faster than 509
along the b-axis. In addition, they exhibit a single lower point that may result from a slow step 510
propagation (and thus, difficult pit opening), as suggested by the shape of their bottom along 511
the c-axis. The bottom of the pits developed on the (100) face are surrounded by steep pit 512
walls (θ ≈ 93° ± 1° between the surface and pit walls). 513
The morphology of etch pits growing on the (010) face displays similar features 514
(elongated following the c-axis, and symmetric with respect to the a- and c-axes, with similar 515
length and width (≈5-10 nm) after 2,000 iterations), although the pits are deeper (≈ 20 nm 516
against ≈ 10-15 nm after 2,000 iterations) and thinner than those developed on the (100) face. 517
Of note, their growth rate is lower than that of pits developed on the (100) face. The bottom of 518
the pits developed on the (010) face is surrounded by steep pit walls (θ ≈ 95° between the 519
surface and pit walls). 520
The morphology of etch pits growing on the (210) face is similar to that of etch pits 521
developed on (100) and (010) faces. However, their lenticular shape is not as well defined and 522
approaches that of a half-moon: indeed, one edge of the pit subparallel to the c-axis is 523
straighter than the other, which is more curvilinear. In addition, whereas the deepest point of 524
pits modeled on (100) and (010) faces is located at the center of the pit, the pits developed on 525
the (210) face are asymmetric (see cross- section 7) and the deepest point (3-4 nm) is located 526
at the center of the pit following the c-axis, but shifted on one edge of the minor-axis ([-210]). 527
Finally, although no etch pit could be evidenced experimentally on (001) faces, the 528
model predicts that small (≈ 10 nm) and deep (> 40 nm) subcircular etch pits may grow on the 529
(001) face if screw dislocations parallel to the c-axis are implemented. However, unlike the 530
other faces, etch pits developed on the (001) face reach a stable radius or tend to vanish, as a 531
result of the increasing roughness of the surrounding surface, possibly explaining why such 532
etch pits remained out of reach of our analytical characterizations. 533
534
Fig. 7. Evolution of modeled etch pits and associated cross-sections following the directions depicted by the 535
doted lines. For all pictures, magenta, red, green and blue colors stand for the results obtained for (100), (010), 536 (001) and (210) faces. 537 538
4. Discussion
5394.1 Factors influencing the face-specific dissolution rates of enstatite and comparison
540
with previous studies
541
As reported above, the face-specific dissolution rates of enstatite range between 2.6 542
and 71.8 nmol/m²/s at pH 0 and T = 90 °C. These values are between one and two orders of 543
magnitude lower than expected using the dissolution rate law derived from powder 544
dissolution experiments conducted by Oelkers68 (between 730 and 973 nmol/m²/s), which
545
represents the largest enstatite dissolution kinetics dataset that we are aware of. Such 546
discrepancies may either be ascribed to the contribution of edges and corners, whose 547
reactivity is much greater than that of faces13, 46 and which are overrepresented when using
548
powders. It may also be due to the very low pH investigated in the present study, which may 549
result in a saturation of proton surface sites69, possibly leading to a weaker pH-dependence of
550
silicate dissolution rate than expected in the extreme acidic pH domain. In any case, the 551
present study illustrates the unsuitability of isotropic dissolution rate laws derived from 552
powder dissolution experiments to predict the amplitude and absolute values of face-specific 553
dissolution rates, as pointed out in previous studies15, 21, 70.
554
The results show that the dissolution rate of the (001) face is about one order of 555
magnitude greater than that of the other investigated (hk0) faces. Among these latter faces, the 556
dissolution rates of the (100) and (010) faces are similar within uncertainties, and are about 557
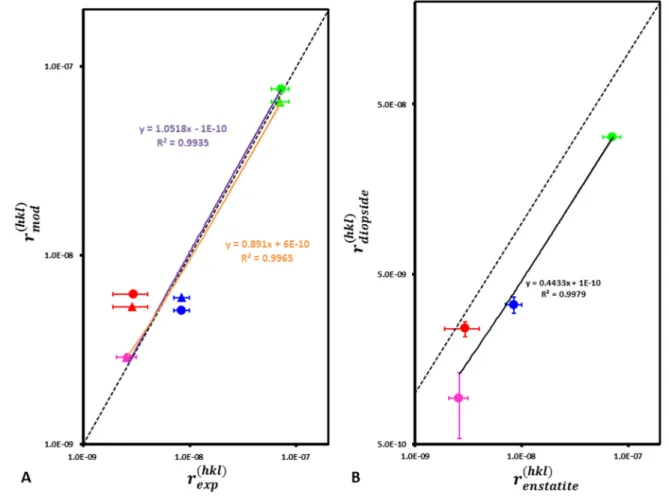
three times slower than that of the (210) face. If one considers the crystallographic similarities 558
existing between the (110) face of diopside and the (210) face of enstatite (both faces 559
correspond to the cleavage plane of these minerals, and intersect the highest density of Mg-O-560
Si bonds), these results are in excellent agreement with those obtained on diopside 561
(Ca0.5Mg0.5SiO3)18, which also belongs to the pyroxene group (Fig. 8B). Note however that
562
the anisotropic reactivity of enstatite seems to be less pronounced than that of diopside. This 563
is likely due to the presence of Ca ions in the diopside structure, which offers more 564
combinations for the bond-breaking probabilities (and therefore, detachment rates) of Mg and 565
Si atoms. Indeed, the hydrolysis rates of Ca-O-Si and Ca-O-Ca bonds are faster than that of 566
Mg-O-Si and Mg-O-Mg bonds, as demonstrated experimentally71 and indirectly confirmed
567
theoretically following ab initio calculations38.
569
Fig. 8. A. Best agreement between modeled and measured face-specific enstatite dissolution rates. The triangles 570
and circles stand for simulations conducted with and without dislocations, respectively. Note that the modeled 571
dissolution rate of the (001) face is also affected because the time for one iteration changes as a function of the 572
mean ratio between experimental and modeled dissolution rates (Eq. 7). B. Comparison between enstatite and 573
diopside 18 face-specific dissolution rates. For both graphs, magenta, red, green and blue colors stand for the 574
results obtained for (100), (010), (001) and (210) faces, respectively. 575
576
The factors that are most frequently invoked to account for the anisotropy of silicate 577
dissolution include (i) the crystallographic bonding structure and in particular, the 578
connectedness of silicate tetrahedrons18, 23, 72 (ii) the dislocation density and orientation18, 21, 23,
579
73-74 and (iii) the formation of ASSLs, whose transport properties may differ as a function of
580
the crystallographic orientation18, 20, 23.
Considering the conditions that are thought be required for the development of 582
passivating ASSLs (i.e., oxic conditions and mildly acidic pHs, see 20, 23, 75-76), the latter factor
583
(iii) can be safely ruled out in the present study. 584
Unravelling the relative contributions of factors (i) and (ii) to the observed anisotropic 585
reactivity may benefit from the comparison between the outputs of the simulations and the 586
experimental results. When the simulations are run without implementing any dislocation in 587
the enstatite structure, the reactivity of the (001) face is strikingly greater than that of the other 588
(hk0) faces, as observed experimentally (Fig. 6). Therefore, this suggests that the 589
connectedness of silicate tetrahedrons dictates the anisotropic reactivity of enstatite at first 590
order: as previously pointed out by Daval et al.18, the release of Si atoms from the (001) face
591
to the solution requires the cleavage of one Si-O-Si bond only, while it would require the (less 592
likely) simultaneous cleavage of two Si-O-Si bonds on the (hk0) faces, which are parallel to 593
the silicate tetrahedron chains. 594
The connectedness of SiO4 tetrahedrons cannot be invoked to distinguish between the 595
reactivity of the three other investigated (hk0) faces, because it is the same for all of them. 596
However, because the outputs of the simulations show that the dissolution rates of these three 597
faces are different even without implementing any dislocation, this suggests that the 598
crystallographic bonding structure also exerts a strong control on the face-specific reactivity. 599
As it can be seen in Fig. 1, the Mg and Si atoms are organized following planes that are 600
parallel to the (100) face. If one supposes that the detachment rate of Si atoms connected to 601
two other Si atoms is lower than that of Mg atoms (in agreement with the respective 602
activation energies for the hydrolysis of Si-O-Si, Si-O-Mg and Mg-O-Mg bonds, see section 603
2.3.1), it can be assumed that the progression of the dissolution in the [100] direction will be 604
hampered by the sluggishness of the dissolution of these Si-rich planes. Conversely, the 605
detachment of accessible Mg atoms located below the first atomic plane of the (010) face may 606
contribute to destroying the first coordination spheres of the topmost Si atoms, which 607
eventually increase their probability of detachment. In turn, this explanation would account 608
for the fact that the slowest dissolving face is (100), and the dissolution rates inferred from the 609
simulations therefore observe the following trend: 𝑟( ) < 𝑟( ) < 𝑟( ) << 𝑟( ), the 610
(210) face representing an intermediate configuration between the (100) and (010) faces. 611
Finally, these simple crystallographic considerations do not account for the 612
observation that the dissolution rate of the (210) face is greater than that of the (010) face. 613
Interestingly, running the simulations with the appropriate dislocation density measured 614
experimentally allows to obtain a global trend for the face-specific reactivity of enstatite 615
which matches exactly to that measured experimentally, with 𝑟( ,) < 𝑟( ,) < 𝑟( ,) 616
<< 𝑟( ,) (see details in section 4.2). These results confirm the critical contribution of 617
dislocations to mineral dissolution rates (e.g., 9, 21, 74, 77-78).
618
To sum up, both the crystallographic bonding structure and the presence of crystal 619
defects (and in particular, dislocations) contribute to the observed anisotropic reactivity of 620
enstatite, in agreement with previous studies dedicated to the face-specific dissolution rates of 621
minerals. 622
623
4.2 Assessing the agreement between measured and simulated rate data
624
A total of 45 sets of activation energies for the thermally activated probabilities of 625
breaking Mg-O-Mg, Mg-O-Si and Si-O-Si bonds were tested to cover the possible range of 626
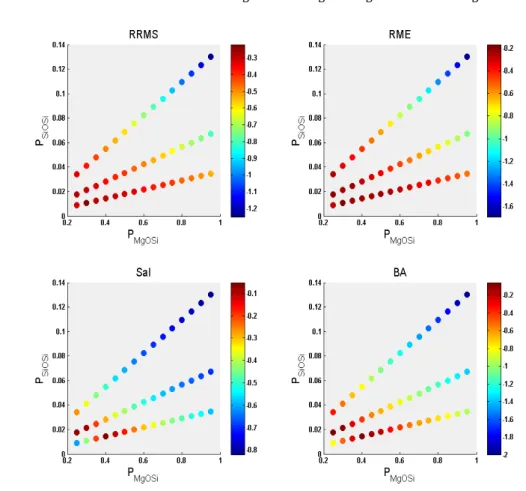
hydrolysis described in section 2.3.2. Three different complementary metrics were used to 627
evaluate quantitatively the agreement between simulation outputs and experimental results: 628
classical metrics such as the relative root mean square error (RRMS) and the relative mean 629
error (RME), and an additional original metrics (SaI) based on a linear combination of the 630
slope and the intercept of the line of best fit, i.e., the line obtained through linear regression 631
between modeled dissolution rates vs. measured dissolution rates. These metrics are defined 632 by: 633 𝑅𝑅𝑀𝑆 = 1 𝑁 𝑟( ) − 𝑟( ) 𝑟( ) (8) 𝑅𝑀𝐸 = 1 𝑁 𝑟( ) − 𝑟( ) 𝑟( ) 𝑆𝑎𝐼 = 𝑎𝑏𝑠(1 − 𝑎) + 𝑎𝑏𝑠 𝑏 < 𝑟( ) >
where 𝑟( ) (resp. 𝑟( )) is the dissolution rate for face (hkl) estimated experimentally (resp. 634
by the model), NE is the number of experimental values (4 in our case), a is the slope of the 635
best fit line, b is the intercept of the best fit line and < 𝑟( ) > the average of all 636
experimental dissolution rates. 637
The RRMS index indicates how spread out are the differences between the modelled 638
values and the observed values or how close are, in average, these differences around the line 639
of best fit. The RME index allows detecting possible bias, i.e., if RME is significantly greater 640
than 0 (resp. lower than 0), the model overestimates (resp. underestimates) the observed 641
values. The information provided by the best fit line is gathered in the SaI index. Because of 642
differences in units (a is dimensionless, b has the dimension of the dissolution rate), the 643
second term of SaI is divided by < 𝑟( ) >. We used this reference for model performance 644
comparisons because it is a common reference for all data. 645
RRMS-RME indices and the SaI index provide different kinds of information. Any set
646
of probabilities (or their corresponding activation energies) that minimizes the RRMS and 647
RME indices does not necessarily minimizes the SaI index as well (e.g., the set of
probabilities that minimizes the RRMS and RME indices is [PMgOMg = 0.99, PSiOMg = 0.3 and 649
PSiOSi = 0.0109] (RRMS = 22% and RME = 17%), whereas it overestimates the dissolution rate 650
anisotropy (SaI = 0.52). On the other hand, the set that allows for the best SaI is [PMgOMg = 651
0.99, PSiOMg = 0.40 and PSiOSi = 0.0146] (SaI = 0.06), corresponding to RRMS and RME of 652
30% and 22%, respectively). In order to compare the 45 sets of probabilities, we finally 653
defined a composite metric that we called best agreement (BA) for each set i by the following 654 formulation: 655 𝐵𝐴 =1 2 𝑅𝑅𝑀𝑆 − min (𝑅𝑅𝑀𝑆) max(𝑅𝑅𝑀𝑆) − min(𝑅𝑅𝑀𝑆)+ 𝑅𝑀𝐸 − min(𝑅𝑀𝐸) max(𝑅𝑀𝐸) − min(𝑅𝑀𝐸) + 𝑆𝑎𝐼 − min (𝑆𝑎𝐼) max(𝑆𝑎𝐼) − min(𝑆𝑎𝐼) (9)
In this formulation, the three metrics are scaled by their max-min values, and we balanced the 656
classical metrics RRMS and RME with the new metric SaI. Other formulations could have 657
been used for BA but we privileged the balanced linear formulation that is more robust than 658
other formulations based on single values like min-max values. Due to the small number of 659
experimental data, more sophisticated composite metrics would have been questionable. 660
Following this formulation, the smallest the BA, the better is the agreement between 661
experimental dissolution rates and simulated dissolution rates. 662
Based on the BA metric, only a narrow range of probabilities provided a satisfactory 663
agreement between simulation outputs and experimental data (Fig. 9) and one set of 664
probabilities ([PMgOMg = 0.99, PSiOMg = 0.4; PSiOSi = 0.0146]) yielded the lowest value of BA 665
(BA = 0.05). This set has been selected to further discuss the outputs of the simulations below, 666
although it is noteworthy that a couple of sets of probabilities also returns similarly low BA 667
values (e.g., the two sets of probabilities [PMgOMg = 0.99, PSiOMg = 0.25; PSiOSi = 0.0177] and 668
[PMgOMg = 0.99, PSiOMg = 0.3; PSiOSi = 0.0212] correspond to BA values of 0.07 and 0.09, 669
respectively), pointing towards the existence of a narrow range of possible PMgOSi and PSiOSi 670
(and therefore, of ∆𝐸 − ∆𝐸 and ∆𝐸 − ∆𝐸 ) values.
671
672
Fig. 9. Color maps of the agreement between modeled and measured dissolution rates in regards to the sets of 673
probabilities that have been tested. The browner the color, the better agreement. See section 4.2 for a description 674
of the RRMS, RME, SaI and BA indices. 675
676
The discrepancies between the results of the simulations conducted with and without 677
dislocations are shown in Fig. 8A. As mentioned above, the main impact of the 678
implementation of the right dislocation density for the (100), (010) and (210) faces consists in 679
an inversion between the reactivities of the (210) and (010) faces. Whereas the face-specific 680
dissolution rates observe the following trend without dislocations : 𝑟( ) < 𝑟( ) < 𝑟( ) << 681
𝑟( ), it becomes 𝑟( ) < 𝑟( ) < 𝑟( ) << 𝑟( ) when dislocations are added, in good 682
agreement with the experimental measurements. In detail, the implementation of dislocations 683
increased the dissolution rates of the (210) and (100) faces, while the reactivity of the (010) 684
face remains unaffected, probably because of the low dislocation density observed on this 685
face. Finally, the outcropping of dislocations at the surface of the (001) face has not been 686
considered, since it was not possible to evidence etch pits on the corresponding samples. Of 687
note, the implementation of dislocations also has an impact on the agreement between 688
simulation outputs and experimental results. Whereas the implementation of dislocations tend 689
to minimize the RRMS and RME values (RRMS = 22% and RME = 13% with dislocations vs. 690
RRMS = 30% and RME = 22% without dislocations), this also results in a modest increase of
691
the SaI (SaI = 0.11 vs. SaI = 0.05), implying that the dissolution rate anisotropy becomes 692
slightly underestimated. Overall, it can be concluded that adding dislocations to the model 693
slightly improves the general agreement between simulation outputs and experimental results 694
in terms of RRMS and RME but slightly degrades the account for the anisotropy of dissolution 695
rates (increase of the SaI value). However, the BA index remains unaffected (BA = 0.06 in 696
both cases), which indicates that for this set of probabilities, the simulations conducted with 697
dislocations are statistically equivalent to those run without dislocations. 698
To sum up, the model satisfactorily accounts for enstatite face-specific dissolution 699
rates measured experimentally, using bond-breaking probabilities consistent with what can be 700
inferred from literature. Moreover, adding dislocations to the simulations in proportions that 701
are consistent with the analytical characterizations allows one to reproduce the order of the 702
face-specific dissolution rates observed experimentally. 703
4.3 Comparison between observed and modeled etch pits and related implications for
704
enstatite dissolution mechanisms
705
The improvement of the agreement between modeled and experimental dissolution 706
rates is not the only interesting output resulting from the implementation of dislocations in the 707
simulated crystals. It also offers the possibility to compare the morphology of simulated etch 708
pits developed at the dislocation outcrop to their counterparts revealed by electron microscopy 709
![Fig. 1. Projection of enstatite structure following [100] (A), [001] (B), [010] (C) zone axes and a rotation view of](https://thumb-eu.123doks.com/thumbv2/123doknet/14793967.602753/11.892.109.775.405.1029/fig-projection-enstatite-structure-following-zone-axes-rotation.webp)