HAL Id: hal-01937190
https://hal.archives-ouvertes.fr/hal-01937190
Submitted on 18 Nov 2020HAL is a multi-disciplinary open access archive for the deposit and dissemination of sci-entific research documents, whether they are pub-lished or not. The documents may come from teaching and research institutions in France or abroad, or from public or private research centers.
L’archive ouverte pluridisciplinaire HAL, est destinée au dépôt et à la diffusion de documents scientifiques de niveau recherche, publiés ou non, émanant des établissements d’enseignement et de recherche français ou étrangers, des laboratoires publics ou privés.
Rock mass strength and elastic modulus of the
Buntsandstein: An important lithostratigraphic unit for
geothermal exploitation in the Upper Rhine Graben
Michael Heap, Marlène Villeneuve, Alexandra R.L. Kushnir, Jamie
Farquharson, Patrick Baud, Thierry Reuschlé
To cite this version:
Michael Heap, Marlène Villeneuve, Alexandra R.L. Kushnir, Jamie Farquharson, Patrick Baud, et al.. Rock mass strength and elastic modulus of the Buntsandstein: An important lithostratigraphic unit for geothermal exploitation in the Upper Rhine Graben. Geothermics, Elsevier, 2019, 77, pp.236 -256. �10.1016/j.geothermics.2018.10.003�. �hal-01937190�
Rock mass strength and elastic modulus of the Buntsandstein: an
1
important lithostratigraphic unit for geothermal exploitation in the
2
Upper Rhine Graben
3
4
Michael J. Heap1*, Marlène Villeneuve2, Alexandra R.L. Kushnir1, Jamie I. Farquharson1,3,
5
Patrick Baud1, and Thierry Reuschlé1
6 7
1Géophysique Expérimentale, Institut de Physique de Globe de Strasbourg (UMR 7516 CNRS,
8
Université de Strasbourg/EOST), 5 rue René Descartes, 67084 Strasbourg cedex, France
9
2Department of Geological Sciences, University of Canterbury, Private Bag 4800, Christchurch, New
10
Zealand.
11
3Department of Marine Geosciences, Rosenstiel School Of Marine And Atmospheric Sciences,
12
University of Miami, 4600 Rickenbacker Causeway, Miami, United States of America
13 14
*Corresponding author: [email protected] 15
16
Abstract 17
Geothermal exploitation in the Upper Rhine Graben increasingly targets the interface between 18
the granitic basement and the overlying Buntsandstein unit. Results from deformation experiments are 19
combined with structural assessments to provide reservoir-scale wet and dry strength and elastic 20
modulus profiles for the Buntsandstein at Soultz-sous-Forêts (France). Our analysis finds five zones 21
characterised by low strength and elastic modulus. The strength and elastic modulus of “massive” zones 22
are lower when the rock is wet (i.e. water-saturated), highlighting the importance of performing wet 23
deformation experiments for geothermal rock mass assessments. These data and methods can be used 24
to provide assessments of other geothermal sites within the region to assist prospection, stimulation, and 25
optimisation strategies. 26
27
Keywords: Buntsandstein; uniaxial compressive strength; triaxial deformation experiments; porosity; 28
clay content; geothermal reservoir 29
30
Highlights 31
32
• Buntsandstein sandstone is of lower strength when wet. 33
• Water-weakening in sandstone is likely due to the presences of clays. 34
• Five low strength and stiffness zones exist within the Buntsandstein at Soultz. 35
• Wet experiments are important for geothermal rock mass assessments. 36
• Method presented can be adopted to provide assessments for other geothermal sites. 37
38
1 Introduction 39
An understanding of the strength and elastic modulus of rock within a geothermal reservoir is 40
an important input in models that guide reservoir prospection, stimulation, and optimisation strategies. 41
Laboratory experiments designed to measure these parameters are typically performed on samples with 42
dimensions shorter than the meso- or macrofracture length scale. As a result, laboratory data gathered 43
on nominally intact rock cannot be directly applied to large-scale geotechnical practices. Although 44
upscaling laboratory values to the reservoir- or borehole-scale is non-trivial, widely used empirical 45
geotechnical tools exist to bridge this length scale discrepancy. Two equations from the geotechnical 46
toolbox, which provide estimates for rock mass strength and rock mass elastic modulus, respectively, 47
are the generalised Hoek-Brown failure criterion (Hoek et al., 2002) and the Hoek-Diederichs equation 48
(Hoek and Diederichs, 2006). Both of these approaches take an assessment of the rock mass structure 49
(e.g., fracture density) and the surface condition of the fractures (e.g., smooth/rough, the pervasiveness 50
of weathering or alteration, the nature of the fracture infilling) into account to determine the rock mass 51
strength and elastic modulus, which will be often less than that of the intact material. 52
Geothermal energy exploitation is common in the Upper Rhine Graben, a 350 km-long and 50 53
km-wide Cenozoic rift valley that extends from Frankfurt (Germany) down to Basel (Switzerland), due 54
to the presence of anomalously high thermal gradients (areas of geothermal interest typically have 55
thermal gradients > 80 °C) attributed to hydrothermal circulation within the fractured Palaeozoic granitic 56
basement and the overlying Permian and Triassic sedimentary rocks (e.g., Pribnow and Schellschmidt, 57
2000; Buchmann and Connelly, 2007; Guillou-Frottier et al., 2013; Baillieux et al., 2013; Magnenet et 58
al., 2014; Freymark et al., 2017). A total of 15 geothermal wells have been drilled (to depths between 59
~1000 and ~5000 m) in the Upper Rhine Graben since the 1980s (Vidal and Genter, 2018) and notable 60
geothermal sites include Soultz-sous-Forêts (e.g., Kappelmeyer et al., 1991; Baria et al., 1999; Gérard 61
et al., 2006; Figure 1) and Rittershoffen (e.g., Baujard et al., 2017; Glaas et al., 2018; Figure 1) in France, 62
Brühl (e.g., Bauer et al., 2017), Insheim, Trebur, and Bruchsal in Germany, and Riehen in Switzerland. 63
A recent study (Villeneuve et al., 2018) provided rock mass strengths (using the generalised 64
Hoek-Brown failure criterion; Hoek et al., 2002) and elastic moduli (using the Hoek-Diederichs 65
equation; Hoek and Diederichs, 2006) for the fractured Palaeozoic granitic basement from exploration 66
well EPS-1 at the Soultz-sous-Forêts geothermal site (Figure 1) using laboratory experiments on intact 67
material and structural data from core analyses. Our goal here, using the same approach, is to provide 68
estimates of borehole-scale rock mass strength and elastic modulus for the lowermost overlying Permian 69
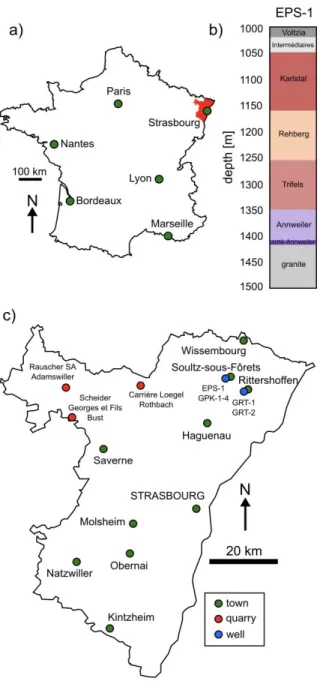
and Triassic sedimentary rocks sampled from exploration well EPS-1 (located about 1 km southwest of 70
Soultz-sous-Forêts; Figure 1), from a depth of 1008 to 1414 m (i.e. the Buntsandstein lithostratigraphic 71
unit). The reasons for choosing Soultz-sous-Forêts as a case study are twofold. First, the Buntsandstein 72
was continuously cored at exploration well EPS-1 (to a core diameter of 78 mm), providing the samples 73
required for laboratory testing (uniaxial and triaxial compression experiments). Second, there exists a 74
wealth of structural data (fracture density and fracture fill, for example) for the borehole at EPS-1, 75
providing the data required for the assessment of rock mass structure. Since the Buntsandstein is known 76
to be laterally extensive (Aichholzer et al., 2016; Vidal and Genter, 2018), the results of this study can 77
not only be used to help optimise current geothermal sites in the Upper Rhine Graben, but also to help 78
guide and optimise future geothermal sites currently in development, such as those at Illkirch and 79
Vendenheim (both in Alsace, France). One of the principal motivations for this study is that recent (e.g., 80
Rittershoffen; Baujard et al., 2017; Figure 1) and future geothermal exploitation in the Upper Rhine 81
Graben has and will target the interface between the granitic basement and the overlying Permian and 82
Triassic sedimentary rocks. 83
Providing estimates of rock mass strength and elastic modulus for the Buntsandstein is 84
complicated for two principal reasons. First, the petrophysical variability of the Buntsandstein (e.g., 85
Vernoux et al., 1995; Aichholzer et al., 2016; Heap et al., 2017) demands that the intact rock properties 86
(strength and elastic modulus) are characterised for materials sampled from a number of different depths. 87
Although the assumption of mechanical homogeneity (i.e. similar intact strength and elastic modulus at 88
different depths) was justified when providing rock mass properties of the porphyritic granite 89
(monzogranite) from EPS-1 from a depth of 1414 to 2200 m (Villeneuve et al., 2018), the mechanical 90
properties of the Buntsandstein vary considerably due to the variability in porosity and microstructural 91
attributes such as pore size and grain size (Vernoux et al., 2005; Haffen et al., 2013; Griffiths et al., 92
2016; Heap et al., 2017; Kushnir et al., 2018a), parameters known to greatly influence the strength and 93
stiffness of rocks, including sandstone (e.g., Palchik et al., 1999; Chang et al., 2006; Baud et al., 2014). 94
Here, therefore, we perform systematic laboratory measurements on material sampled at regular depth 95
intervals (from 1008 to 1414 m) from the EPS-1 core at the Soultz-sous-Forêts geothermal site. Second, 96
experimental studies have shown that clay plays an important role in the observed weakening of 97
sandstone in the presence of water (e.g., Rutter and Mainprice, 1978; Hawkins and McConnell, 1992; 98
Baud et al., 2000; Demarco et al., 2007). For example, Hawkins and McConnell (1992) found that the 99
uniaxial compressive strength (UCS) of sandstone was reduced by 78% for clay-rich sandstones and by 100
only 8% for siliceous sandstones in the presence of water. The variable, and sometimes high, clay 101
contents of the Buntsandstein sandstones (e.g., Heap et al., 2017) thus calls into question the use of 102
laboratory strength and elastic moduli data determined for dry rocks typically used in geotechnical rock 103
mass assessments. Therefore, we here perform dry and wet laboratory deformation measurements to 104
provide estimations of the dry and wet rock mass strength and elastic modulus for the Buntsandstein 105
unit at the Soultz-sous-Forêts geothermal site. 106
107
2 Methods and materials 108
2.1 Intact failure criteria 109
The strength of intact rock, including sandstone, in the brittle regime increases with increasing 110
confining pressure or depth (e.g., Wong et al., 1997; Baud et al., 2000; Bésuelle et al., 2003). The Hoek-111
Brown failure criterion for intact rock is an empirical failure criterion that provides strength estimates 112
for intact rock at depth using the uniaxial compressive strength, 𝐶", (i.e., the strength of the rock at 113
ambient pressure) and a constant, 𝑚$: 114 115 𝜎&' = 𝜎 )'+ 𝐶"+𝑚$ 𝜎)' 𝐶"+ 1-..0 (1) 116 117
where 𝜎&' and 𝜎
)' are the effective maximum and minimum principal stresses, respectively. The unitless
118
constant 𝑚$ describes the shape of the failure envelope on a graph of 𝜎&' as a function of 𝜎
)', and is
119
therefore related to the microstructural and mineralogical attributes of the rock (mineral content, grain 120
size, grain shape, pore size, and pore shape, amongst many others) (Eberhardt, 2012). The most reliable 121
method to determine 𝑚$ is to run a series of triaxial deformation experiments on the rock of interest 122
(Hoek and Brown, 1980); however values of 𝑚$ are often estimated using charts that offer values for
123
common lithologies (e.g., Hoek and Brown, 1997). 124
In this study, 𝐶" is determined for samples of Buntsandstein sandstone taken from regular depth 125
intervals (every 40 to 50 m) from the continuous core available at the EPS-1 exploration well (Figure 126
1). Values of empirical constant 𝑚$ are often taken from tables of “standard” values for common 127
lithologies; the recommended value of 𝑚$ for sandstone is 19 (Hoek and Brown, 1997). However, in
128
our study, we chose instead to perform a suite of triaxial experiments on samples from one of the 129
sampled depth intervals in order to better constrain 𝑚$ for the Buntsandstein (see Section 2.6). Uniaxial 130
experiments were performed under both dry and wet conditions to provide the dry intact uniaxial 131
strength, 𝐶"_5, and the wet intact uniaxial strength, 𝐶"_6 (see Section 2.5). Similarly, wet and dry triaxial 132
experiments provide estimates for 𝑚$ under dry conditions, 𝑚$_5, and under wet conditions, 𝑚$_6 (see
133
Section 2.6). Therefore, Equation (1) can be modified to provide the intact rock strength with depth for 134
dry (Equation 2) and wet rock (Equation 3), respectively: 135
𝜎&'= 𝜎 )'+ 𝐶"_5+𝑚$_5 𝜎)' 𝐶"+ 1-..0 (2) 137 138 𝜎&'= 𝜎 )'+ 𝐶"_6+𝑚$_6 𝜎)' 𝐶"+ 1-..0 (3) 139 140
2.2 Rock mass strength failure criteria 141
Rock mass strength can be determined using the generalised Hoek-Brown failure criterion: 142 143 𝜎&'= 𝜎 )'+ 𝐶"+𝑚9 𝜎)' 𝐶"+ 𝑠-; (4) 144 145
where mb, s, and a are unitless fitting parameters for a fractured rock mass and are defined as follows
146 (Hoek et al., 2002): 147 148 𝑚9= 𝑚$ 𝑒> ?@AB&.. CDB&EF G (5) 149 𝑠 = 𝑒>?@AB&..IB)F G (6) 150 𝑎 =1 2+ 1 6L𝑒B ?@A &0 + 𝑒BC.) M (7) 151 152
where D is a unitless disturbance factor related to blasting damage in large excavations (since well 153
drilling does not use explosives, D = 0 in our case study; we provide the full equation here for 154
completeness) and GSI is the Geological Strength Index, a unitless value that describes the rock mass 155
characteristics (Marinos et al., 2005). Values of GSI range from 0 to 100, where high values indicate 156
intact or massive rock masses with fresh surfaces and low values indicate 157
blocky/disintegrated/laminated rock masses with highly weathered surfaces and clay coatings or fillings 158
(Marinos et al., 2005). GSI is typically obtained from rock outcrop exposures, but for this study values 159
of GSI were determined using structural data collected on the EPS-1 core material (see Section 2.7), as 160
described in Villeneuve et al. (2018). Equation (4) can be recast to provide the rock mass strength with 161
depth for dry (Equation 8) and wet rock (Equation 9), respectively: 162 163 𝜎&' = 𝜎 )'+ 𝐶"_5+𝑚9_5 𝜎)' 𝐶"_5+ 𝑠-; (8) 164 165 𝜎&'= 𝜎 )'+ 𝐶"_6+𝑚9_6 𝜎)' 𝐶"_6+ 𝑠-; (9) 166 167
where 𝑚9_5 and 𝑚9_6 are given as, respectively:
168 169 𝑚9_5 = 𝑚$_5 𝑒> ?@AB&.. CDB&EF G (10) 170 𝑚9_6 = 𝑚$_6 𝑒>?@AB&..CDB&EF G (11) 171 172
2.3 Intact and rock mass elastic modulus 173
The elastic modulus of intact rock, 𝐸$, can be determined from the elastic portion of the stress-174
strain curve of a rock deforming in compression. The rock mass elastic modulus, 𝐸ST, can be determined 175
using the Hoek-Diederichs equation (Hoek and Diederichs, 2006): 176 177 𝐸ST = 𝐸$U0.02 + 1 −𝐷2 1 + 𝑒X(Y.Z&0FB?@A)/&&\] (12) 178 179
As for the rock strength equations in Section 2.2, the disturbance factor 𝐷 is equal to zero for our 180
application. As mentioned in Section 2.2, values of GSI were determined using structural data collected 181
on the EPS-1 core material (see Section 2.7). Equation (12) can be modified to provide values for the 182
elastic modulus of a dry (Equation 13) and wet rock mass (Equation 14), respectively: 183
𝐸ST_5 = 𝐸$_5U0.02 + 1 − 𝐷 2 1 + 𝑒X(Y.Z&0FB?@A)/&&\] (13) 185 186 𝐸ST_6= 𝐸$_6U0.02 + 1 − 𝐷 2 1 + 𝑒X(Y.Z&0FB?@A)/&&\] (14) 187 188
where 𝐸$_5 and 𝐸$_6 are the intact elastic moduli of dry and wet rock, respectively. 189
190
2.4 Experimental materials and sample preparation 191
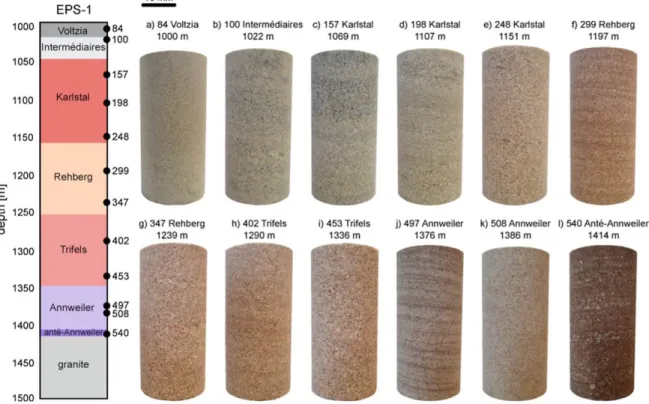
The Buntsandstein lithostratigraphic unit was sampled at regular (~40-50 m) depth intervals 192
(between 1008 to 1414 m; Figure 1b) from the EPS-1 exploration well from the Soultz-sous-Forêts 193
geothermal site (Figures 1 and 2). This Permian and Triassic sedimentary unit (described in, for example, 194
Vernoux et al., 2005; Haffen et al., 2013; Vidal et al., 2015; Aichholzer et al., 2016; Griffiths et al., 195
2016; Heap et al., 2017; Kushnir et al., 2018a) directly overlies the fractured Palaeozoic granitic 196
reservoir (described in, for example, Genter and Traineau, 1996; Genter et al., 1997; Sausse et al., 2006; 197
Dezayes et al., 2010; Genter et al., 2010). We collected 1 m-long pieces of the 78 mm-diameter core at 198
each of the sampled depths. In total, twelve depths were sampled (one sandstone from the Voltzia unit, 199
one from the Couches Intermédiaires unit, three from the Karlstal unit, two from the Rehberg unit, two 200
from the Trifels unit, two from the Annweiler unit, and one from the Anté-Annweiler unit; Figure 1b). 201
Four or five cylindrical samples, 20, 18.75, or 12 mm in diameter (depending on the strength of the 202
sandstone), were cored from each of the twelve cores collected and precision-ground to a nominal length 203
of 40, 37.5, or 24 mm, respectively. These samples were cored so that their axes were parallel to the 204
EPS-1 borehole (i.e. perpendicular to bedding; Figure 2). We complement these borehole samples with 205
samples prepared from blocks (all from the Buntsandstein) acquired from local quarries (from Rothbach, 206
Adamswiller, and Bust, all in France; see Figure 1c for quarry locations). Samples from the quarry 207
blocks were cored perpendicular to bedding to a diameter of 20 mm and precision-ground to a nominal 208
length of 40 mm. All of the samples were washed using tapwater and then dried in a vacuum oven at 40 209
°C for at least 48 hours. 210
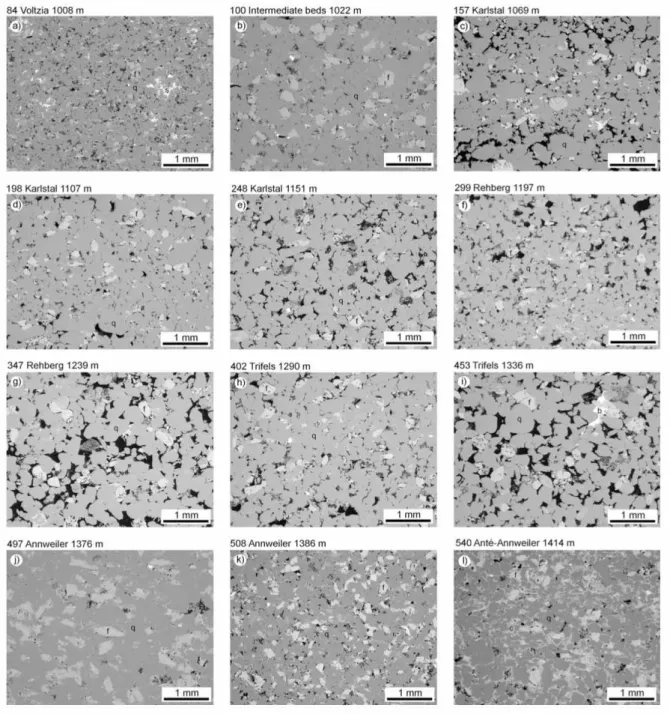
The twelve samples collected from exploration well EPS-1 are feldspathic (>10 wt.% feldspar) 211
or quartz-rich (<10 wt.% feldspar) sandstones that contain variable amounts of pore-filling clay 212
(muscovite/illite–smectite) (from 2 to 13.1 wt.%) (Figure 3; Table 1; Heap et al., 2017). Most of the 213
sandstones are homogeneous at the sample scale, although a few (in particular samples 299, 497, and 214
540) contain obvious bedding-parallel laminations (Figure 2). The average grain diameter of these 215
samples varies from 142 to 424 µm (Figure 3; Table 2; Heap et al., 2017). The microstructural and 216
textural features of these samples are summarised in Table 2, and are described at length in Heap et al. 217
(2017). The three quarry rocks are all feldspathic sandstones (Table 1). The sandstones from Bust and 218
Adamswiller do not contain any obvious laminations/bedding, although the Adamswiller sandstone is 219
known to exhibit a mechanical anisotropy (Baud et al., 2005). Rothbach sandstone, a rock that also 220
shows significant mechanical anisotropy (Louis et al., 2009), however, contains alternating layers that 221
show differences in grain size and porosity (Louis et al., 2005). 222
Before the samples were deformed, their connected porosity was determined using the 223
connected (skeletal) volume measured by a helium pycnometer (Micromeritics AccuPyc II 1340) and 224
the bulk volume calculated using the sample dimensions. 225
226
2.5 Determining 𝐶" (intact uniaxial compressive strength) and 𝐸$ (intact elastic modulus)
227
The prepared cylindrical samples were deformed uniaxially at a strain rate of 1.0 × 10⁻⁶ s-1 until
228
macroscopic failure. Half of the samples were deformed “dry” (dried at 40 °C in a vacuum-oven for at 229
least 48 hours prior to deformation) and half were deformed “wet” (vacuum-saturated in deionised water 230
and deformed in a water bath) (see Heap at al. (2014) for a schematic of the experimental device). A 231
lubricating wax was applied to the end-faces of the dry samples to avoid problems associated with the 232
friction between the sample and the pistons. We chose to deform the samples at a relatively low strain 233
rate of 1.0 × 10⁻⁶ s-1 to ensure drainage in the low-porosity, low-permeability samples deformed under
234
saturated conditions. During deformation, axial displacement and axial load were measured using a 235
linear variable differential transducer (LVDT) and a load cell, respectively. These measurements were 236
converted to axial strain and axial stress using the sample dimensions. 𝐶"_5 and 𝐶"_6 were taken as the 237
peak stress obtained in these uniaxial compressive strength tests under dry and wet conditions, 238
respectively. Values of 𝐸$_5 and 𝐸$_6 were determined using the slope of the linear elastic portion of the 239
dry and wet uniaxial stress-strain curves, respectively (Ulusay and Hudson, 2007). 240
241
2.6 Determining 𝑚$ 242
The unitless parameter 𝑚$ describes the shape of the failure envelope in a graph of 𝜎&' as a
243
function of 𝜎)' (i.e. the principal stress space). We determined 𝑚
$ using triaxial experiments conducted
244
on dry and wet cylindrical cores (20 mm in diameter and 40 mm in length) prepared from the core 245
sampled from a depth of 1239 m (from the Rehberg unit; porosity 0.18). Constant strain rate (1.0 × 10⁻⁶
246
s-1) triaxial experiments were performed at constant effective pressures (defined here as the confining
247
pressure minus the pore fluid pressure) of 2.5, 5, 7.5, 10, and 15 MPa. Samples deformed under dry 248
conditions were therefore deformed at constant confining pressures of 2.5, 5, 7.5, 10, and 15 MPa (pore 249
pressure = 0 MPa). A lubricating wax was applied to the end-faces of the dry samples to avoid problems 250
associated with the friction between the sample and the pistons. Samples deformed under wet conditions 251
were deformed using a constant pore fluid (deionised water) pressure of 10 MPa, and confining pressures 252
of 12.5, 15, 17.5, 20, and 25 MPa. The confining and pore pressures were maintained constant during 253
deformation using a confining and pore fluid pressure intensifier, respectively. During deformation, 254
axial displacement and axial load were measured using an LVDT and a load cell, respectively. These 255
measurements were converted to axial strain and axial stress using the sample dimensions. We 256
determined 𝑚$_5 and 𝑚$_6 using the compressive strengths measured for these experiments using the 257
data fitting function (modified cuckoo fit algorithm, basic error summation, and absolute error type) in 258
RocData (Rocscience, 2017). 259
260
2.7 Determining the Geological Strength Index (GSI) 261
The GSI is a unitless value that describes the rock mass characteristics using an assessment of 262
the rock mass structure (e.g., fracture density) and the surface condition of the fractures (e.g., 263
smooth/rough, the pervasiveness of weathering or alteration, the nature and thickness of the fracture 264
infilling) (Marinos et al., 2005). The logging data from EPS-1 in the Bundsandstein contains the type, 265
location (depth), orientation, infilling type, and infilling thickness of all discontinuities mapped along 266
the core. The locations (depths) were used to derive a fracture frequency. The discontinuity type, 267
infilling type, and infilling thickness were used to assess the joint condition. The rock mass structure 268
and surface condition were assigned broad descriptors, such as “blocky” and “poor”, respectively, which 269
were then used to determine a GSI value using a visual look-up chart (Marinos et al., 2005). Due to the 270
available logging data and core photographs, we consider that our GSI estimates lack the subjectivity 271
often associated with estimates of GSI. 272
The determination of the surface quality is relatively straightforward in this case study because 273
of the high quality of the core logs in the Bundsandstein. Despite not having descriptions of joint 274
roughness, we feel confident that our assessments using discontinuity type, infilling type, and infilling 275
thickness provide a suitable basis for assessing the joint condition. For example, discontinuities 276
identified as faults can be assumed to have smooth to slickensided surfaces, resulting in a condition 277
assessment of fair if they have no infilling, or very poor if they have thick (> 2 mm), clayey infilling. 278
Discontinuities identified as joints can be assumed to have rough to smooth surfaces, resulting in a 279
condition assessment of very good if they have no infilling, or very poor if they have thick (> 2 mm), 280
clayey infilling. 281
The determination of the rock mass structure requires the selection of the scale at which the rock 282
mass assessment is conducted. For example, Villeneuve et al. (2018) assessed the rock mass strength 283
and elastic modulus of the granite underlying the Bundsandstein at the borehole scale. These authors 284
demonstrated that the rock mass is so densely fractured in some intervals that the intact rock parameters 285
are not appropriate. Villeneuve et al. (2018) suggested a range of 7-10 fractures per metre as the cut-off 286
fracture density to decide between using the intact rock failure criterion (Equation 1) and using the rock 287
mass failure criterion (Equation 4). In the present case study we derive the rock mass parameters at the 288
reservoir scale (tens of metres). Based on the recommendations of Schultz (1996), we use a block size 289
to reservoir scale ratio of 5-10 as the cutoff for using rock mass strength and elastic modulus. We use 290
fracture densities of 1 fracture per metre and 2 fractures per metre to differentiate between massive and 291
blocky, and blocky and very blocky, respectively. In accordance with the reasoning detailed in 292
Villeneuve et al. (2018), the cut-off between intact and rock mass failure criteria corresponds to 293
approximately 2 fractures per metre. 294
295
3 Laboratory testing 296
3.1 Uniaxial compressive strength experiments 297
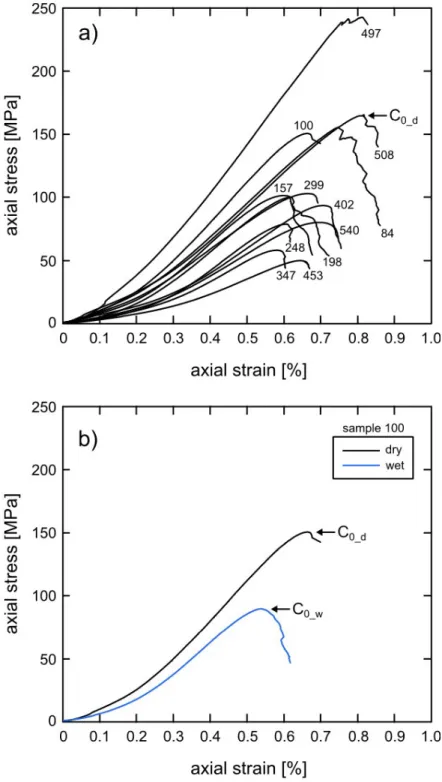
Representative uniaxial stress-strain curves for the dry Buntsandstein samples are shown in 298
Figure 4a. These stress-strain curves (Figure 4a) are typical of those for brittle rock in compression (e.g., 299
Hoek and Bieniawski, 1965; Brace et al., 1966; Scholz, 1968). The maximum axial stress obtained 300
during the experiment is the uniaxial compressive strength, 𝐶" (as labelled for one of the dry curves in 301
Figure 4a). Representative uniaxial stress-strain curves for a dry and wet sample of sample 100 are 302
shown in Figure 4b. These curves show that the uniaxial compressive strength is lower when the sample 303
is wet. In the example shown in Figure 4b, the dry strength, 𝐶"_5, was 150.8 MPa and the wet strength, 304
𝐶"_6, was 89.9 MPa. These representative curves also show that the slope of the stress-strain curve in
305
the elastic region (i.e. the elastic modulus) and the axial strain at macroscopic failure are lower when 306
the sample is wet (Figure 4b). 307
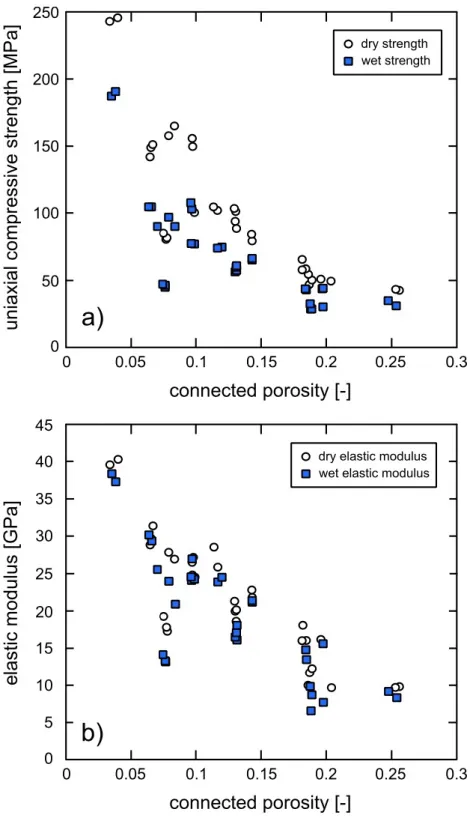
Dry (white circles) and wet (blue squares) uniaxial compressive strengths (𝐶"_5 and 𝐶"_6, 308
respectively) and elastic moduli (𝐸$_5 and 𝐸$_6, respectively) are plotted as a function of connected 309
porosity in Figures 5a and 5b, respectively (data available in Table 3). These data show that the strength 310
(Figure 5a) and elastic modulus (Figure 5b) of the Buntsandstein samples studied here both decrease as 311
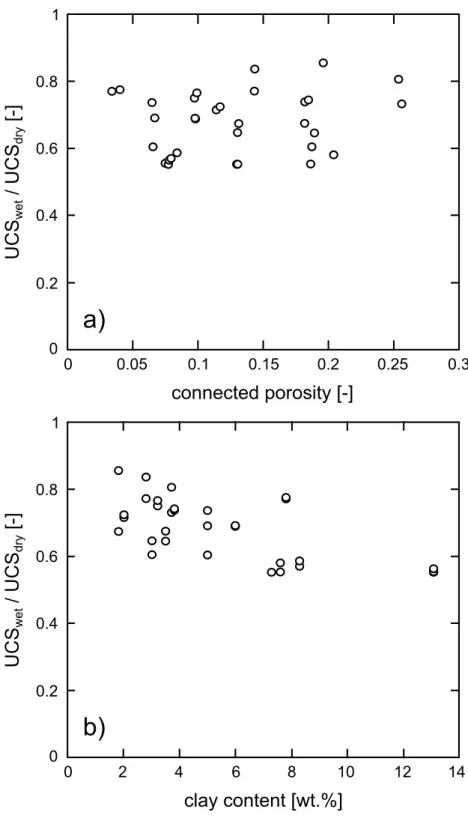
the connected porosity is increased. For example, the dry strength and dry elastic modulus of the 312
Buntsandstein samples tested herein range from ~50 MPa and ~10 GPa, respectively, at a porosity of 313
~0.25 up to ~250 MPa and ~40 GPa, respectively, at a porosity of ~0.04 (Figures 5a and 5b). These data 314
also show that the wet strength and wet elastic modulus of the sandstones is systematically lower than 315
the dry strength and elastic modulus across the entire tested porosity range (Figures 5a and 5b). 316
The ratios of wet to dry strength are plotted as a function of connected porosity and clay content 317
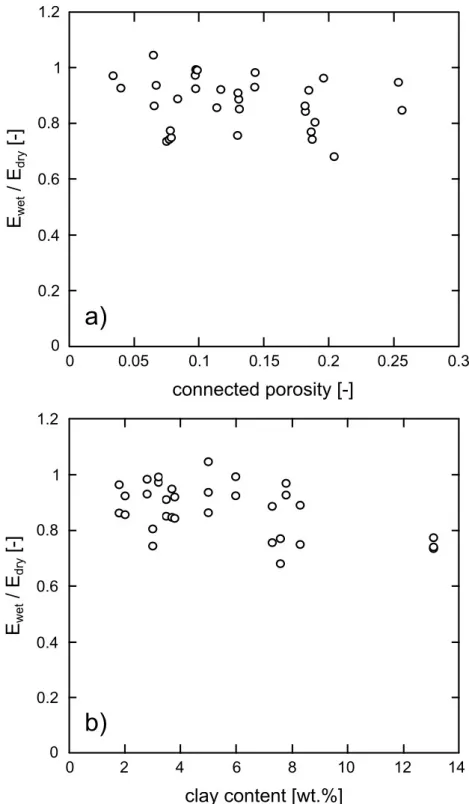
in Figures 6a and 6b, respectively. These data show that the ratio of wet to dry strength varies from 318
~0.55 to ~0.84 for the rocks tested herein (Figure 6). Figure 6a shows that the observed water-weakening 319
does not appear to depend on the connected porosity. However, although there is some scatter in the 320
data, there is a trend of increasing water-weakening as clay content is increased (Figure 6b). Indeed, the 321
sample that contains the most clay (13.1 wt.%; sample 540) has the lowest ratio of wet to dry strength, 322
and the sample containing the least clay (1.8 wt.%; Rothbach sandstone) has the highest ratio of wet to 323
dry strength (Figure 6b). The ratios of wet to dry elastic modulus are plotted as a function of connected 324
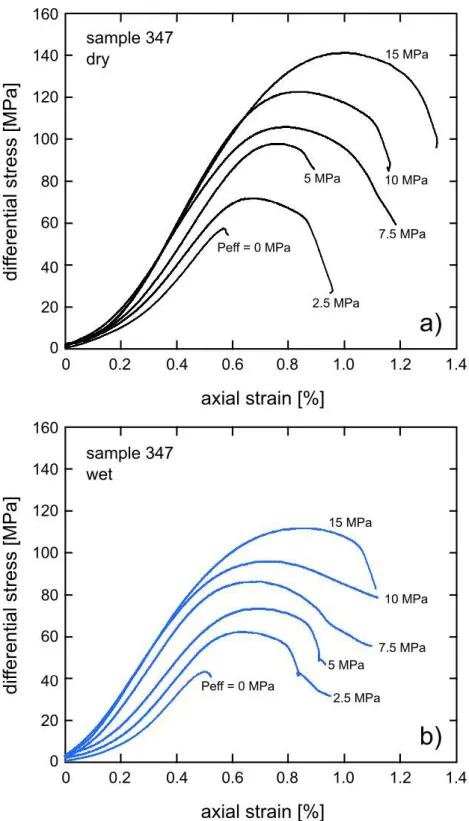
porosity and clay content in Figures 7a and 7b, respectively. These data show that the ratio of wet to dry 325
elastic modulus varies from ~0.74 to ~1.00 for the rocks tested herein (Figure 7). The ratio of wet to dry 326
elastic modulus does not appear to depend on either connected porosity (Figure 7a) or clay content 327
(Figure 7b). 328
329
3.2 Triaxial compressive strength experiments 330
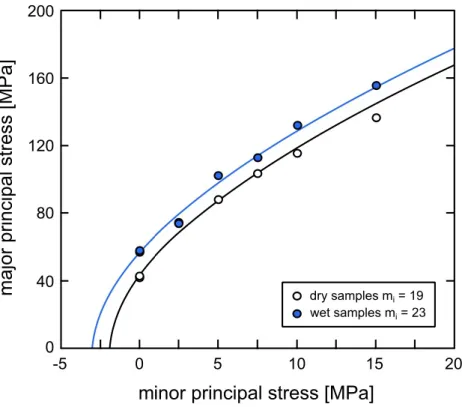
The stress-strain curves for the dry and wet triaxial experiments (on samples from sample 347) 331
are shown in Figures 8a and 8b, respectively (experiments unique to this study). The sandstone is brittle 332
over the tested pressure range and failure (marked by a stress drop in the stress-strain data; Figure 8) 333
was manifest as a through-going shear fracture. These data show that the dry (Figure 8a) and wet (Figure 334
8b) strength increases as the effective pressure is increased, in accordance with many experimental 335
studies on sandstones in the brittle field (e.g., Wong et al., 1997; Baud et al., 2000; Bésuelle et al., 2003). 336
For example, the dry strength was increased from ~58 MPa at an effective pressure of 0 MPa to ~141 337
MPa at an effective pressure of 15 MPa (Figure 8a) (data available in Table 4). Our triaxial experiments 338
also show that sample 347 is weaker when wet over the entire tested range of effective pressure (i.e. up 339
to 15 MPa) (Figure 8). 340
The triaxial data plotted in principal stress space ( 1 as a function of 3; Figure 9) show that
341
the failure envelope for the wet samples (blue symbols in Figure 9) is lower than the failure envelope 342
for the dry samples (white symbols in Figure 9). The fits to these data were provided by the Modified 343
Cuckoo data fitting algorithm using basic (vertical) error summation, and relative (divided by the y-344
value of the curve fit) error type) in RocData (Rocscience, 2017). These fits provide values of 19 345
(relative residuals 0.008) and 23 (relative residuals 0.012) for 𝑚$_5 and 𝑚$_6, respectively. We note that 346
the value for dry sandstone is within the range of 𝑚$ values typically associated with sandstone (17 ± 4, 347
as given in Hoek (2007)), whereas the value for wet sandstone is slightly higher than this range. 348
349
3.3 Geological Strength Index (GSI) 350
The rock mass descriptions, based on fracture frequency, infilling type, and infilling thickness 351
are summarised in Table 5, along with their associated rock mass descriptions at the reservoir scale. 352
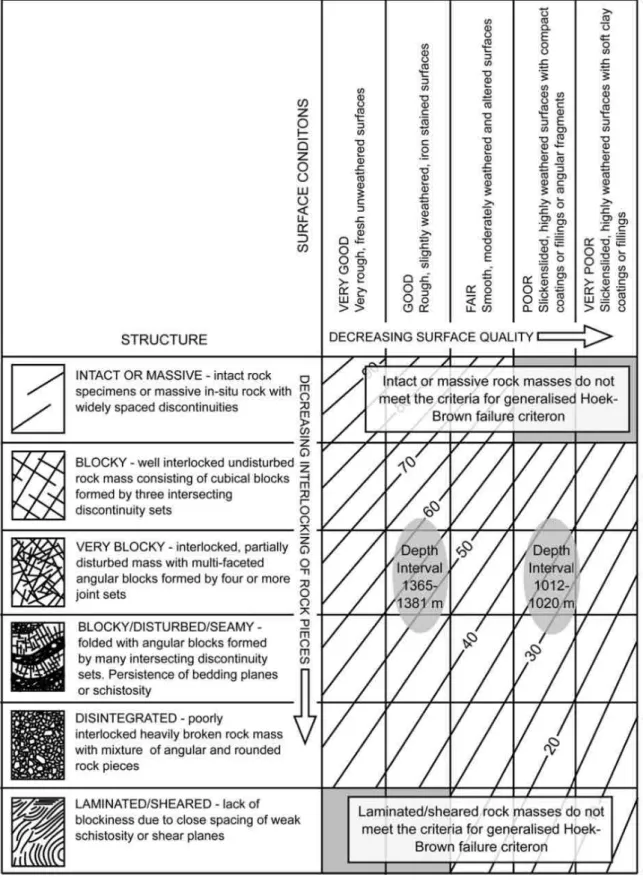
Figure 10 shows how the look-up chart from Marinos et al. (2005) was used to assess the GSI for two 353
example intervals. For the depth interval 1365-1381 m the fracture density is 2.1 fractures per metre, 354
and is therefore assessed as a “very blocky” (see Figure 10) rock mass structure. The fractures are infilled 355
with barite and minor calcite (both hard minerals that tend to seal fractures) with an infilling thickness 356
averaging 2 mm. The surface condition of the fractures is therefore assessed as “good” (see Figure 10) 357
because barite and calcite are precipitated mineral infillings and will therefore contribute cohesive and 358
frictional strength to the fracture. The combination of the two assessments results in a GSI range of 45-359
60. Since our analysis requires a single value of GSI, we use GSI = 55 for this interval (1365-1381 m) 360
(Table 5). Similarly, the depth interval 1012-1020 m has been assessed a “very blocky” (see Figure 10) 361
structure. Because of the presence of four faults within an 8 m thick interval, and an infilling thickness 362
averaging 9 mm, the surface condition is assessed as “poor” (see Figure 10). The combination results in 363
a range of GSI of 25-40. Again, since our analysis requires a single value of GSI, we use GSI = 35 for 364
this interval (1012-1020 m) (Table 5). 365
The majority of the rock mass in the Bundsandstein has a GSI of 100 (Table 5) because of its 366
low fracture density (< 2 fractures per metre), with the resulting assessment of “massive” for the rock 367
structure and the use of the intact Hoek-Brown failure criterion (Equation 1) to determine rock strength 368
over these intervals. The intervals with GSI less than 100, of which there are five, are associated with 369
highly fractured zones (e.g., the interval between depths 1151 and 1156 m has a fracture density of 2 370
discontinuities per metre) (Table 5). The five zones that are characterised by low values of GSI are 371
located at depths of ~1012-1020, ~1151-1156, ~1205-1216, ~1347-1350, and ~1365-1381 m (Table 5). 372
The zones with the lowest GSI (GSI = 35) are associated with highly fractured zones that contain 373
fractures with a very thick average infilling (e.g., the interval between depths 1205 and 1216 m has an 374
average infilling thickness of 11 mm; Table 5). The three zones with the lowest GSI (Table 5) were 375
previously identified as the three main fractured zones within the EPS-1 core (Vernoux et al., 2005). 376
377
4 Reservoir-scale strength and elastic modulus for the Buntsandstein 378
The dry and wet intact and rock mass strength and elastic modulus, calculated using the reservoir 379
scale GSI and Equations 1, 2, 3, 8, and 9 (for the strength) and Equations 13 and 14 (for the elastic 380
modulus) are given in Table 5. The fracture density with depth (Figure 11a) is plotted alongside the dry 381
and wet strength and elastic modulus in Figures 11b and 11c, respectively. Figures 11b and 11c clearly 382
show the five zones for which the rock mass strength and rock mass elastic modulus is applicable (at 383
depths of ~1012-1020, ~1151-1156, ~1205-1216, ~1347-1350, and ~1365-1381 m; indicated by the 384
black arrows in Figure 11), as opposed to those where the intact values of either property are appropriate. 385
These zones are characterised by low values of strength (Figure 11b) and elastic modulus (Figure 11c). 386
Apart from these five zones, the strength and elastic modulus of the rock mass is given by the intact 387
strength and the intact elastic modulus (GSI = 100; Table 5). Excluding the rock at the interface between 388
the granite and the sedimentary rocks (the Anté-Annweiler), which has relatively high values of strength 389
and elastic modulus, the overall strength (Figure 11b) and elastic modulus (Figure 11c) of the 390
Buntsandstein appears to decrease with depth; this is especially true for the elastic modulus (Figure 11c). 391
We also note that, in the five zones where the strength and elastic modulus are described by the 392
rock mass strength and elastic modulus, respectively, there is essentially no difference between the dry 393
and wet values (Figures 11b and 11c). In these zones, the strength and elastic modulus of the rock mass 394
very much depends on the fractures present within the rock mass, rather than the condition (wet or dry) 395
of the rock mass. However, in the depths characterised by the intact strength and elastic modulus, a large 396
difference can be observed between the wet and dry values (Figures 11b and 11c). 397 398 5 Discussion 399 5.1 Water-weakening in sandstones 400
Water-weakening in rocks can be the result of both mechanical and chemical processes. 401
Mechanically, pressurised pore fluids typically weaken and embrittle rocks (e.g. Paterson and Wong, 402
2005). Chemically, rock can be weakened by subcritical crack growth processes (e.g., Atkinson, 1984) 403
and the reduction of surface free energy (e.g., Parks, 1984). The mechanical effect can be expressed in 404
terms of the effective pressure law, where the effective pressure equals the confining pressure minus the 405
pore fluid pressure multiplied by a poroelastic constant. The study of Baud et al. (2015) shows that this 406
poroelastic constant is very close to unity for porous sandstone. As a result, we do not consider herein 407
the mechanical influence of pore fluids on the strength of our sandstone samples. 408
Our deformation experiments have shown that sandstone is weaker in the presence of water 409
(Figures 4, 5, 6, 7, and 8), in accordance with many published studies (e.g., Rutter and Mainprice, 1978; 410
Bell, 1978; Hadizadeh and Law, 1991; Dyke and Dobereiner, 1991; Hawkins and McConnell, 1992; 411
Kasim and Shakoor, 1996; Zang et al., 1996; Bell and Culshaw, 1998; Baud et al., 2000; Cuss et al., 412
2003; Lin et al., 2005; Vásárhelyi and Ván, 2006; Demarco et al., 2007; Shakoor and Barefield, 2009; 413
Nespereia et al., 2010; Siedel, 2010; Wasantha and Ranjith, 2014). A handful of these studies highlight 414
that the observed water-weakening in sandstones is related to their clay content. For example, Hawkins 415
and McConnell (1992) found that the uniaxial compressive strength (UCS) of sandstone was reduced 416
by 78% for clay-rich sandstones and by only 8% for siliceous sandstones in the presence of water. 417
Although our data suggest that the water-weakening in sandstone does not depend on connected porosity 418
(Figure 6a), they do highlight that water-weakening may increase as clay content is increased (Figure 419
6b). To better understand the role of connected porosity and clay content on water-weakening in 420
sandstone, we plot ratios of wet to dry strength from numerous studies (data available in Table 6) 421
alongside our new data (Table 3) as a function of porosity and clay content in Figures 12a and 12b, 422
respectively. Figure 12a shows that there is no discernible trend between water-weakening in sandstone 423
and porosity. However, Figure 12b shows that, although there is some scatter in the data, water-424
weakening increases as clay content is increased. Indeed, the sample containing the highest clay content 425
(~70 %) has the lowest ratio of wet to dry strength (Figure 12b). 426
To explore the reason for the reduction in strength in the presence of water we use the 427
micromechanical model of Sammis and Ashby (1986). This model, based on the classic work of 428
Griffiths, has been previously used to describe the brittle failure of porous sandstones (e.g., Baud et al., 429
2014). The micromechanical model of Sammis and Ashby (1986) is an inclusion model comprising a 430
two-dimensional elastic medium populated by circular holes of uniform radius, 𝑟. As the stress on the 431
medium increases, cracks nucleate and propagate from the circular holes (parallel to the direction of the 432
applied stress) when the stress intensity at the tip of a small crack on the circular surface reaches a 433
critical value (𝐾A`, the fracture toughness). The cracks interact once they are long enough, thus
434
increasing the local tensile stress intensity. Eventually, the cracks coalesce and conspire to induce the 435
macroscopic failure of the elastic medium. In the case of uniaxial compression, Zhu et al. (2010) provide 436
an analytical approximation of Sammis and Ashby’s (1986) model to estimate UCS as a function of 437 porosity, 𝜙: 438 439 𝐶. = 1.325 𝜙..E&E 𝐾A` √𝜋𝑟 (15) 440 441
Assuming that Equation (15) can capture the behaviour of the sandstones of Table 6, there are three 442
variables that influence uniaxial compressive strength: the porosity, 𝜙, the fracture toughness, 𝐾A`, and
443
the pore radius, 𝑟. If we assume that the porosity and pore radius are the same for a given sandstone 444
then, according to Equation (15), the observed water-weakening (Figure 12) must be due to a decrease 445
in 𝐾A`. Figure 13 shows strength as a function of porosity using Equation (15) for a fixed pore radius 446
(125 µm) and different values of 𝐾A` (𝐾A` = 0.1, 0.3, 0.5, and 0.8 MPa m-1/2) alongside the dry (white
447
circles) and wet (blue squares) data for the compiled sandstones. These modelled curves aptly 448
demonstrate that decreasing the 𝐾A` at a given porosity and pore size lowers the strength (Figure 13). 449
The reduction in uniaxial compressive strength observed in wet rocks has been attributed to a reduction 450
in fracture surface free energy due to the adsorption of water on the fracture surface (e.g., Parks, 1984; 451
Baud et al., 2000). We conclude here, in line with the conclusions of Baud et al. (2000), that a lower 452
fracture surface free energy in the presence of water reduces 𝐾A` and therefore strength. Additionally, 453
we highlight that water adsorption on clay minerals is extremely efficient due to their large surface areas. 454
To emphasise, the specific surface areas of samples 157 (clay content = 2 wt.%) and 540 (clay content 455
= 13.1 wt.%) are 204 and 6170 m2/kg, respectively (Heap et al., 2017; Tables 1 and 2). Therefore, a
456
higher clay content should ensure that more water is adsorbed on the surface of the fracture, perhaps 457
explaining the correlation between clay content and water-weakening (Figure 12b). The scatter in the 458
data of Figure 12b suggests that clay content does not govern water-weakening in sandstones alone. One 459
factor likely to play a key role is whether the clays are pore-coating or pore-filling, or whether the clays 460
are present within the rock matrix. For water adsorption on clay minerals to influence the fracture surface 461
free energy, the clays must be present within the material through which the fracture propagates (i.e. the 462
matrix). By contrast, clay present within pores may not exert a significant influence on the water-463
weakening process. 464
We further highlight that the micromechanics of low-porosity rocks is often described using the 465
wing-crack model of Ashby and Sammis (1990), although we note that no or few microcracks were 466
found in the intact microstructure of the studied materials (Figure 3). If the wing-crack model was 467
considered appropriate for the low-porosity materials studied herein, then there is an additional 468
micromechanical parameter—the coefficient of friction—could also be influenced by the presence of 469
water. 470
471
5.2 Implications for geothermal energy exploitation 472
We have provided estimates of the rock mass strength (Figure 11b) and elastic modulus (Figure 473
11c) for the Bundsandstein sedimentary sequence (from the Soultz-sous-Forêts geothermal site) that 474
directly overlies the fractured granitic basement used throughout the Upper Rhine Graben as a 475
geothermal resource. One of the main motivations for this study is that recent (e.g., Rittershoffen; 476
Baujard et al., 2017) and future geothermal exploitation in the Upper Rhine Graben has and will target 477
rock at or close to this interface. Since the Buntsandstein is known to be a laterally extensive unit (e.g. 478
Aichholzer et al., 2016; Vidal and Genter, 2018), these new reservoir-scale strength and elastic modulus 479
estimates could assist prospection, stimulation, and optimisation strategies (for instance, the 480
Buntsandstein was stimulated at the Rittershoffen site in 2013; Vidal et al., 2016; Baujard et al., 2017) 481
at geothermal sites within the Upper Rhine Graben. We can combine our strength and elastic modulus 482
estimates for the Buntsandstein with those for the granite reservoir provided in Villeneuve et al. (2018) 483
to give strength (Figure 14b) and elastic modulus (Figure 15b) estimates for the EPS-1 borehole from a 484
depth of ~1000 to ~2200 m. These data highlight, for example, that the rock mass strength of the granitic 485
reservoir can be lower than that for the Buntsandstein, due to the high fracture density of the granite 486
(Figure 14). 487
However, since the rock mass strength and elastic modulus estimations (Figures 11b, 11c, 14b, 488
and 15b) are very much dependent on the fracture density (and their surface condition), the estimations 489
provided herein may not be directly applicable to the Buntsandstein sedimentary sequence found at other 490
geothermal sites, which will likely be characterised by different fracture densities and intersect regional 491
scale faults at different depths. For example, the Buntsandstein is much deeper at the Rittershoffen site 492
(from ~1800 to ~2200 m; Aichholzer et al., 2016) than at Soultz-sous-Forêts and major fracture zones 493
are found at depths of ~1975, ~1986, and ~2140 m (Vidal et al., 2017). Further, the extent of fracture 494
infilling will also be spatially variable. For instance, Vidal et al. (2015) note that the extent of the fracture 495
sealing can differ in the same fractured zone at different wells (e.g., GPK-2, GPK-3, and GPK-4, which 496
are separated by no more than 1.5 km) at Soultz-sous-Forêts. We further note that the sedimentary units 497
overlying the granitic reservoir can be appreciably different from those at the Soultz-sous-Forêts site at 498
a distance of several tens of kilometres (Kushnir et al., 2018b). However, we highlight that our 499
laboratory data can be re-used to provide upscaled strength and elastic modulus profiles for other sites, 500
using the methods outlined herein, as long as site-specific rock mass descriptions are performed. We 501
highlight that direct core data will provide a more complete characterisation of the fracture network than 502
borehole imaging tools (Genter et al., 1997). A recent study by Bauer et al. (2017) also highlights that, 503
when core materials are not available, care should be taken when selecting outcrop analogues for 504
geothermal reservoir rock. 505
Our laboratory data have shown that the Buntsandstein sandstones are weaker when wet (Figure 506
5). In zones characterised by the intact rock strength and elastic modulus (i.e. all zones except the five 507
highly fractured zones) (Figures 11b and 11c), the reservoir-scale strength and the elastic modulus are 508
lower when the rock is wet. Differences between the dry and wet strength and elastic modulus within 509
the five fractured zones are small: the strength and elastic modulus in these zones is primarily dictated 510
by the rock mass structure (fractures) (Figures 11b and 11c). Since the pore space of rocks within a 511
geothermal reservoir will be saturated with liquid water/brine in-situ, our measurements and analysis 512
therefore highlight the importance of performing wet deformation experiments to provide upscaled 513
strength and elastic modulus assessments for geothermal applications. Indeed, not only are the wet and 514
dry strengths and elastic moduli different (Figure 5), but we also measured a difference between the dry 515
and wet 𝑚$ term (Figure 9). We recommend that future studies that adopt this technique also perform 516
wet deformation experiments, particularly because water-weakening has been reported in a wide range 517
of rock types (e.g., sandstone: Hawkins and McConnell, 1992, tuff: Zhu et al., 2011; Heap et al., 2018, 518
basalt: Zhu et al., 2016, carbonates: Baud et al., 2016). 519
Although we performed wet deformation measurements to provide more accurate strength and 520
elastic modulus assessments, we highlight that our experiments were performed at room temperature 521
and used deionised water. First, the temperature of the Buntsandstein rocks at Soultz-sous-Forêts, for 522
example, is between 120 and 140 °C (e.g., Genter et al., 2010). The intact strength and stiffness of 523
sandstone measured in the laboratory may be different at high-temperature, although there is a paucity 524
of data. For example, Ranjith et al. (2012) found that the uniaxial compressive strength and stiffness of 525
Hawkesbury sandstone (containing 20% clay) increased from 36.5 to 42.5 MPa and from 2.8 to 3.3 GPa, 526
respectively, as the testing temperature was increased from 25 to 200 °C. Rao et al. (2007) also observed 527
an increase in uniaxial compressive strength and stiffness for sandstone as temperature was increased 528
from 25 to 150 °C. Therefore, based on these few data, it would appear that the rock mass strength and 529
elastic modulus assessments provided herein (measured at room temperature) may underestimate the 530
strength and elastic modulus of the rock in-situ. However, firm conclusions cannot be drawn without 531
further experimental investigations. For example, Heap et al. (2009a) showed that the compressive 532
strength of three sandstones under triaxial testing conditions (an effective pressure of 30 MPa) was 533
slightly lower at 75 °C than at room temperature. At present it is unclear as to the influence of, for 534
example, mineral content, porosity, and grain size on the compressive strength of sandstone at high-535
temperature. Second, the rocks within the reservoir are saturated with hydrothermal brines with a pH 536
between 5.2 and 5.5 (e.g., Scheiber et al., 2002). A lower pH should reduce the fracture surface free 537
energy (e.g., Parks, 1984) and therefore reduce intact strength. Indeed, Singh et al. (1999) measured a 538
reduction in uniaxial compressive strength in sandstone from ~65 to ~40 MPa as the pH was reduced 539
from 7 to 2. The uniaxial compressive strength of sandstone samples was also found to decrease with 540
increasing salinity (Shukla et al., 2013; Rathanweera et al., 2014). However, recent triaxial experiments 541
showed that the triaxial compressive strength of sandstone increased with increasing NaCl concentration 542
(Huang et al., 2018). It is therefore difficult to draw firm conclusions as to the influence of the pore fluid 543
composition and pH on the strength and stiffness of sandstone without further laboratory testing. 544
We highlight that the reservoir-scale strength and elastic modulus estimates provided here are 545
representative of the short-term strength. These rock properties, and empirical term 𝑚$, were all 546
determined at a laboratory strain rate of 1 × 10⁻⁶ s-1. Although this strain rate is an order of magnitude
547
lower than typically used in laboratory testing, we highlight that the strength of rock, including 548
sandstone, decreases as strain rate is decreased due to time-dependent subcritical crack growth processes 549
(Atkinson, 1984; Brantut et al., 2013). There are many experimental studies on time-dependent 550
deformation in sandstone (e.g., Ngwenya et al., 2001; Baud and Meredith, 1997; Heap et al., 2009a; 551
2009b; Yang and Jiang, 2010; Brantut et al., 2014; Tang et al., 2018). For example, Heap et al. (2009b) 552
showed that sandstone fails at 80% of its short-term failure stress in about 60 hours. Further, and 553
pertinent to the geothermal reservoir case study, the deformation rate during a brittle creep test can 554
increase by up to three orders of magnitude as the temperature is increased from 20 to 75 °C (Heap et 555
al., 2009a). Based on the data provided in these studies, the long-term strength of the Buntsandstein 556
sedimentary sequence may be lower than the short-term strength estimates provided herein. 557
558
5 Concluding remarks 559
Recent geothermal exploitation in the Upper Rhine Graben has targeted the interface between 560
the fractured granitic basement and the overlying Permian and Triassic sedimentary rocks (the 561
Buntsandstein), and geothermal projects being developed in the region will continue to do so. Our study 562
provides wet and dry strength and elastic modulus estimates for the Buntsandstein sedimentary sequence 563
(from 1008 to 1414 m) at the Soultz-sous-Forêts geothermal site in France. To provide such estimates 564
we performed 64 uniaxial (32 dry and 32 wet) and 10 triaxial deformation experiments (5 dry and 5 565
wet). These data were coupled with Geological Strength Index (GSI) assessments to provide down-well 566
wet and dry strength and elastic modulus profiles using the Brown failure criterion and the Hoek-567
Diederichs equation, respectively. Our analysis finds five zones characterised by low values of GSI 568
(zones with high fracture densities and infilling thicknesses) that have low values of rock mass strength 569
and elastic modulus. The zones with low fracture densities (i.e. a “massive” rock structure) are 570
characterised by the intact rock properties (i.e. a GSI value of 100) and therefore have higher values of 571
strength and elastic modulus. Additionally, we find that the strength and elastic modulus of these 572
massive zones are lower when the rock is wet, highlighting the importance of performing wet 573
deformation experiments for rock mass assessments of rock that is typically saturated with a liquid 574
phase, such as in a geothermal reservoir. We combine these new data with those for the underlying 575
fractured granite reservoir to produce down-well strength and elastic modulus profiles from a depth of 576
~1000 to ~2200 m for the Soultz-sous-Forêts geothermal site. Although this type of analysis is somewhat 577
site specific, the methods used and data provided herein can be easily adapted to provide strength and 578
elastic modulus estimates for other geothermal sites within the Upper Rhine Graben to assist reservoir 579
prospection, stimulation, and optimisation strategies. 580
581
Acknowledgements 582
This study was funded by LABEX grant ANR-11-LABX-0050_G-EAU-THERMIE-583
PROFONDE (this research therefore benefited from state funding managed by the Agence National de 584
la Recherche (ANR) as part of the “Investissements d'avenir” program) and ANR grant CANTARE 585
(ANR-15-CE06-0014-01). We are extremely grateful to Albert Genter, who provided the fracture data 586
from EPS-1 (we therefore also acknowledge the Bureau de Recherches Géologiques et Minières 587
(BRGM)). We also wish to thank Chrystal Dezayes, Bertrand Renaudié, Coralie Aichholzer, and 588
Philippe Duringer. The comments of two anonymous reviewers helped clarify certain aspects of this 589 manuscript. 590 591 Author contributions 592
M.J. Heap led the project and co-wrote the manuscript with M. Villeneuve. P. Baud, M.J. Heap, 593
and A.R.L. Kushnir chose and collected the samples from the Merkwiller core repository. M.J. Heap 594
and A.R.L. Kushnir measured the porosity of the experimental samples. M.J. Heap performed all the 595
uniaxial compressive strength tests. M.J. Heap, A.R.L. Kushnir, and J.I. Farquharson performed the 596
triaxial compressive strength tests. M. Villeneuve performed the geotechnical analyses. All authors had 597
a hand in the preparation of the manuscript and the interpretation of the data. 598
References 599
600
Aichholzer C, Duringer P, Orciani S, Genter A (2016) New stratigraphic interpretation of the Soultz-601
sous-Forêts 30-year-old geothermal wells calibrated on the recent one from Rittershoffen (Upper 602
Rhine Graben, France). Geotherm Energy 4:13. 603
Atkinson BK (1984) Subcritical crack growth in geological materials. Journal of Geophysical Research: 604
Solid Earth 89:4077-4114. 605
Baillieux P, Schill E, Edel JB, Mauri G (2013) Localization of temperature anomalies in the Upper 606
Rhine Graben: insights from geophysics and neotectonic activity. Int Geol Rev 55:1744-62. 607
Baria R, Baumgärtner J, Gérard A, Jung R, Garnish J (1999) European HDR research programme at 608
Soultz-sous-Forêts (France) 1987–1996. Geothermics 28(4):655-669. 609
Baud P, Meredith PG (1997) Damage accumulation during triaxial creep of Darley Dale sandstone from 610
pore volumometry and acoustic emission. International Journal of Rock Mechanics and Mining 611
Sciences 34:24-e1. 612
Baud P, Zhu W, Wong Tf (2000) Failure mode and weakening effect of water on sandstone. Journal of 613
Geophysical Research: Solid Earth 105(B7):16371-89. 614
Baud P, Louis L, David C, Rawling GC, Wong Tf (2005) Effects of bedding and foliation on mechanical 615
anisotropy, damage evolution and failure mode. Geological Society, London, Special 616
Publications 245:223-249. 617
Baud P, Wong Tf, Zhu W (2014) Effects of porosity and crack density on the compressive strength of 618
rocks. Int J Rock Mech Min Sci 67:202-11. 619
Baud P, Reuschlé T, Ji Y, Cheung CS, Wong Tf (2015). Mechanical compaction and strain localization 620
in Bleurswiller sandstone. Journal of Geophysical Research: Solid Earth 120(9):6501-6522. 621
Baud P, Rolland A, Heap MJ, Xu T, Nicolé M, Ferrand T, Reuschlé T, Toussaint R, Conil N (2016). 622
Impact of stylolites on the mechanical strength of limestone. Tectonophysics 690:4-20. 623
Bauer JF, Krumbholz M, Meier S, Tanner DC (2017). Predictability of properties of a fractured 624
geothermal reservoir: the opportunities and limitations of an outcrop analogue study. Geothermal 625
Energy 5(1):24. 626
Baujard C, Genter A, Dalmais E, Maurer V, Hehn R, Rosillette R, Vidal J, Schmittbuhl J (2017). 627
Hydrothermal characterization of wells GRT-1 and GRT-2 in Rittershoffen, France: Implications 628
on the understanding of natural flow systems in the Rhine graben. Geothermics 65: 255-268. 629
Bell FG (1978) Petrographical factors relating to porosity and permeability in the Fell Sandstone. 630
Quarterly Journal of Engineering Geology and Hydrogeology 11(2):113-26. 631
Bell FG, Culshaw MG (1998) Petrographic and engineering properties of sandstones from the Sneinton 632
Formation, Nottinghamshire, England. Quarterly Journal of Engineering Geology and 633
Hydrogeology 31(1):5-19. 634
Bésuelle P, Baud P, Wong, Tf (2003). Failure mode and spatial distribution of damage in Rothbach 635
sandstone in the brittle-ductile transition. Pure and Applied Geophysics 160(5-6):851-868. 636
Brace WF, Paulding Jr BW, Scholz CH (1966) Dilatancy in the fracture of crystalline rocks. Journal of 637
Geophysical Research 71:3939-3953. 638
Brantut N, Heap MJ, Meredith PG, Baud P (2013) Time-dependent cracking and brittle creep in crustal 639
rocks: A review. Journal of Structural Geology 52:17-43. 640
Brantut N, Heap MJ, Baud P, Meredith PG (2014) Rate‐and strain‐dependent brittle deformation of 641
rocks. Journal of Geophysical Research: Solid Earth 119:1818-1836. 642
Buchmann TJ, Connolly PT (2007) Contemporary kinematics of the Upper Rhine Graben: a 3D finite 643
element approach. Global and Planetary Change 58:287-309. 644
Chang C, Zoback MD, Khaksar A (2006) Empirical relations between rock strength and physical 645
properties in sedimentary rocks. J Petrol Sci Eng 51:223-37. 646
Cuss RJ, Rutter EH, Holloway RF (2003) The application of critical state soil mechanics to the 647
mechanical behaviour of porous sandstones. International Journal of Rock Mechanics and Mining 648
Sciences 40(6):847-62. 649
David C, Wong TF, Zhu W, Zhang J (1994) Laboratory measurement of compaction-induced 650
permeability change in porous rocks: Implications for the generation and maintenance of pore 651
pressure excess in the crust. Pure and Applied Geophysics 143(1-3):425-56. 652
Demarco MM, Jahns E, Rüdrich J, Oyhantcabal P, Siegesmund S (2007) The impact of partial water 653
saturation on rock strength: an experimental study on sandstone [Der Einfluss einer partiellen 654
Wassersättigung auf die mechanischen Gesteinseigenschaften: eine Fallstudie an Sandsteinen]. 655
Zeitschrift der Deutschen Gesellschaft für Geowissenschaften 58(4):869-82. 656
Dezayes C, Genter A, Valley B (2010) Structure of the low permeable naturally fractured geothermal 657
reservoir at Soultz. Comptes Rendus Geoscience 342:517-530. 658
Dyke CG, Dobereiner L (1991) Evaluating the strength and deformability of sandstones. Quarterly 659
Journal of Engineering Geology and Hydrogeology 24:123-134. 660
Eberhardt E (2012) The Hoek–Brown failure criterion. In: R. Ulusay (ed.), The ISRM Suggested 661
Methods for Rock Characterization, Testing and Monitoring: 2007–2014:233-240. 662
Freymark J, Sippel J, Scheck-Wenderoth M, Bär K, Stiller M, Fritsche JG, Kracht M (2017) The deep 663
thermal field of the Upper Rhine Graben. Tectonophysics, 694, 114-129. 664
Gérard A, Genter A, Kohl T (2006) The deep EGS (Enhanced Geothermal System) project at Soultz-665
sous-Forêts (Alsace, France). Geothermics 35:473-483. 666
Genter A, Traineau H (1996) Analysis of macroscopic fractures in granite in the HDR geothermal well 667
EPS-1, Soultz-sous-Forêts, France. Journal of Volcanology and Geothermal Research 72:121-668
141. 669
Genter A, Castaing C, Dezayes C, Tenzer H, Traineau H, Villemin T (1997) Comparative analysis of 670
direct (core) and indirect (borehole imaging tools) collection of fracture data in the Hot Dry Rock 671
Soultz reservoir (France). Journal of Geophysical Research: Solid Earth 102:15419-15431. 672
Genter A, Evans K, Cuenot N, Fritsch D, Sanjuan B (2010) Contribution of the exploration of deep 673
crystalline fractured reservoir of Soultz to the knowledge of enhanced geothermal systems 674
(EGS). Comptes Rendus Geoscience 342:502-516. 675
Glaas C, Genter A, Girard JF, Patrier P, Vidal J (2018) How do the geological and geophysical signatures 676
of permeable fractures in granitic basement evolve after long periods of natural circulation? 677
Insights from the Rittershoffen geothermal wells (France). Geotherm Energy, 6:14. 678
Griffiths L, Heap MJ, Wang F, Daval D, Gilg HA, Baud P, Schmittbuhl J, Genter A (2016) Geothermal 679
implications for fracture-filling hydrothermal precipitation. Geothermics 64:235-245. 680
Guillou-Frottier L, Carré C, Bourgine B, Bouchot V, Genter A (2013) Structure of hydrothermal 681
convection in the Upper Rhine Graben as inferred from corrected temperature data and basin-682
scale numerical models. J Volcanol Geotherm Res 256:29-49. 683
Hadizadeh J, Law RD (1991) Water-weakening of sandstone and quartzite deformed at various stress 684
and strain rates. Int J Rock Mech Min Sci Geomech Abs 28:431-439. 685
Haffen S, Géraud Y, Diraison M, Dezayes C (2013) Determination of fluid-flow zones in a geothermal 686
sandstone reservoir using thermal conductivity and temperature logs. Geothermics 46:32-41. 687
Hawkins AB, McConnell BJ (1992) Sensitivity of sandstone strength and deformability to changes in 688
moisture content. Quarterly Journal of Engineering Geology and Hydrogeology 25:115-30. 689
Heap MJ, Baud P, Meredith PG (2009a). Influence of temperature on brittle creep in 690
sandstones. Geophysical Research Letters 36(19) https://doi.org/10.1029/2009GL039373 691
Heap MJ, Baud P, Meredith PG, Bell AF, Main IG (2009b). Time‐dependent brittle creep in Darley 692
Dale sandstone. Journal of Geophysical Research: Solid Earth 114(B7) 693
https://doi.org/10.1029/2008JB006212 694
Heap MJ, Lavallée Y, Petrakova L, Baud P, Reuschlé T, Varley NR, Dingwell DB (2014). 695
Microstructural controls on the physical and mechanical properties of edifice‐forming andesites 696
at Volcán de Colima, Mexico. Journal of Geophysical Research: Solid Earth 119(4):2925-2963. 697
Heap MJ, Kushnir ARL, Gilg HA, Wadsworth FB, Reuschlé T, Baud P (2017) Microstructural and 698
petrophysical properties of the Permo-Triassic sandstones (Buntsandstein) from the Soultz-sous-699
Forêts geothermal site (France). Geotherm Energy 5(1):26. 700
Heap MJ, Farquharson JI, Kushnir AR, Lavallée Y, Baud P, Gilg HA, Reuschlé T (2018) The influence 701
of water on the strength of Neapolitan Yellow Tuff, the most widely used building stone in Naples 702
(Italy). Bulletin of Volcanology 80(6):51. 703
Hoek E, Bieniawski ZT (1965) Brittle fracture propagation in rock under compression. International 704
Journal of Fracture Mechanics 1:137-155. 705