HAL Id: hal-00298510
https://hal.archives-ouvertes.fr/hal-00298510
Submitted on 25 Jan 2008
HAL is a multi-disciplinary open access
archive for the deposit and dissemination of
sci-entific research documents, whether they are
pub-lished or not. The documents may come from
teaching and research institutions in France or
abroad, or from public or private research centers.
L’archive ouverte pluridisciplinaire HAL, est
destinée au dépôt et à la diffusion de documents
scientifiques de niveau recherche, publiés ou non,
émanant des établissements d’enseignement et de
recherche français ou étrangers, des laboratoires
publics ou privés.
Glacier annual balance measurement, forecasting and
climate correlations, North Cascades, Washington
1984?2006
M. S. Pelto
To cite this version:
M. S. Pelto. Glacier annual balance measurement, forecasting and climate correlations, North
Cas-cades, Washington 1984?2006. The Cryosphere, Copernicus 2008, 2 (1), pp.13-21. �hal-00298510�
© Author(s) 2008. This work is licensed under a Creative Commons License.
Glacier annual balance measurement, forecasting and climate
correlations, North Cascades, Washington 1984–2006
M. S. Pelto
Nichols College Dudley, MA 01571, USA
Received: 23 May 2007 – Published in The Cryosphere Discuss.: 18 June 2007 Revised: 1 October 2007 – Accepted: 7 December 2007 – Published: 25 January 2008
Abstract. North Cascade glacier annual balance measured
on 10 glaciers from 1984–2006 yielded mean annual balance (ba) of −0.54 m/a, and −12.38 m cumulatively. This is a significant loss for glaciers that average 30–60 m in thick-ness, 20–40% of their entire volume. Two observed glaciers, Lewis Glacier and Spider Glacier, no longer exist.
The ba of North Cascade glaciers is reliably calculated, correlation coefficient 0.91, using 1 April snowpack wa-ter equivalent and ablation season temperature. Utilizing ba from 10 glaciers 1984–2006 and net balance (bn) from South Cascade 1960–2005, a set of forecast rules for glacier mass balance were derived utilizing October–April Pacific Decadal Oscillation and Multivariate El Nino Southern Os-cillation index values. The forecast rules provide a correct assessment in 41 of the 46 years for South Cascade Glacier and 20 of 23 years for NCGCP glaciers. Glacier annual bal-ance forecasting is an important step for summer water re-source management in glacier runoff dominated stream sys-tems. The forecast for North Cascade glaciers in 2007 is for a negative ba.
1 Introduction
Glaciers have been studied as sensitive indicators of climate for more than a century. Glacier behavior integrates wa-ter and energy balance factors to exhibit a maximum cli-mate change signaling effect (IPCC, 1996). The North Cas-cades climate is known to be sensitive to inter-annual and decadal fluctuations in Pacific Basin climate (Walters and Meier, 1989; Hodge et al., 1998; Pelto and Hedlund, 2001; Bitz and Battisti, 1999). How reliably do North Cascade glaciers record climate? Can we forecast annual balance of Correspondence to: M. S. Pelto
(mspelto@nichols.edu)
North Cascade glaciers from atmospheric circulation indices of the Pacific Basin? This paper is the first step in approach-ing the problem of glacier mass balance forecastapproach-ing. Many papers have focused on modelling glacier mass balance from climate records, but this has limited utility for water resource management purposes, as the calculation postdates the hy-drologic year.
The North Cascade region contains more than 700 glaciers, which cover 250 km2 and range in elevation from 1500–2500 m (Post et al., 1971). During the 1984–2006 period all 47 observed glaciers have been retreating (Pelto, 2006). The importance of monitoring glacier mass balance was recognized during the International Geophysical Year in 1957. A series of benchmark glaciers around the world were chosen where mass balance would be monitored. This network has proven valuable, although coverage within any region is sparse. For example, there is just one benchmark glacier (South Cascade Glacier) in the lower 48 United States with ongoing measurements. Regional variation in glacier mass balance is due to variation in geographic characteristics such as aspect, elevation and location with respect to prevail-ing winds. No sprevail-ingle glacier is representative of all others. Therefore, to understand the causes and nature of changes in glacier surface mass balance throughout a mountain range, it is necessary to monitor a significant number of glaciers (Fountain et al., 1991). The North Cascade Glacier Climate Project (NCGCP) was founded in 1983 to monitor glaciers throughout the range and identify the response of North Cas-cade Range, Washington glaciers to regional climate change. In 1983 the NCGCP selected for a long term annual balance monitoring 10 glaciers representing each part of the range and each type of glacier (Pelto, 1988). The glaciers represent a range of geographic conditions (Table 1). Annual balance has been continued on the 8 original glaciers that still exist, two have disappeared, Lewis and Spider Glacier, the latter on the north flank of Chiwawa Peak. No relict glacier ice
14 M. S. Pelto: Glacier annual balance measurement, prediction, forecasting
Table 1. The geographic characteristics of the ten glaciers where annual balance is being monitored annually. Accumulation sources: wind
drifting=WD, avalanche accumulation=AV, direct snowfall=DS.
Glacier Aspect Area Accumulation From Elevation (m) (km2) divide
Columbia SSE 0.9 DS, DW, AV 15 km west 1750–1450 Daniels E 0.4 DS, WD 1 km east 2230–1970 Easton SSE 2.9 DS 75 km west 2900–1700 Foss NE 0.4 DS At divide 2100–1840 Ice Worm SE 0.1 DS, AV 1 km east 2100–1900 Lower Curtis S 0.8 DS,WD 55 km west 1850–1460 Lynch N 0.7 DS,WD At divide 2200–1950 Rainbow ENE 1.6 DS,AV 70 km west 2040–1310 Sholes N 0.9 DS 70 km west 2070–1630 Yawning N 0.3 DS At divide 2100–1880
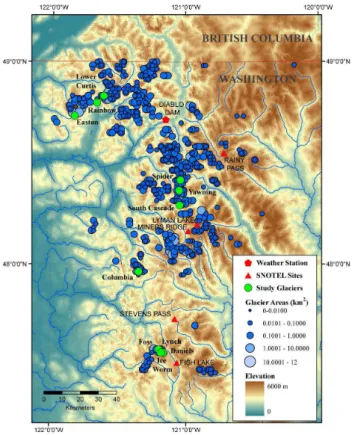
Fig. 1. Regional locator map showing glaciers discussed.
remains in the Lewis Glacier basin, and the largest relict ice is 0.006 km2for Spider Glacier. In 1990, Easton Glacier and Sholes Glacier were added to the annual balance program to offset the loss.
This paper focuses on data from this twenty-three year mass balance program and a 47 year record from the regional benchmark glacier, South Cascade Glacier monitored by the USGS (Krimmel, 2000; Bidlake et., 2007).
2 Methods
Annual mass balance measurements are the most sensitive indicator of short-term glacier response to climate change. Annual mass balance is the difference between accumulation of snow and ice in winter and loss of snow and ice by ablation in summer. It is typically measured on a fixed date near the end of the water year, beginning 1 October and ending 30 September.
NCGCP methods emphasize surface mass balance mea-surements with a relatively high density of sites on each glacier (>100 sites/km2), consistent measurement methods, applied on fixed dates, and at fixed measurement locations (Pelto, 1996; Pelto and Riedel, 2001). Glaciers monitored in this program do not lose significant mass by calving or avalanching, thus changes observed are primarily a function of winter accumulation and summer ablation on the glacier’s surface.
NCGCP essentially measures conditions on a glacier near the time of minimal mass balance at the end of the water year, using a fixed date method. This is known as annual balance (Mayo et al, 1972; Pelto, 1997). Measurements are made at the same time each year in July-August and again in late September near the end of the ablation season. Any additional ablation that occurs after the last visit to a glacier is measured during the subsequent hydrologic year. Annual balance can be determined with this approach because win-ter and summer balance quantities, not measured prior to the NCGCP field season, cancel each other (Pelto and Riedel, 2001). Net balance in contrast (bn) is defined as the change observed on a glacier’s surface between successive balance minimums (Mayo et al., 1972).
Detailed descriptions of NCGCP methods have been doc-umented in (Pelto, 1996, 1997, 2000; Pelto and Riedel, 2001). The use of a high measurement density and consistent methods provides that errors resulting from an imperfectly
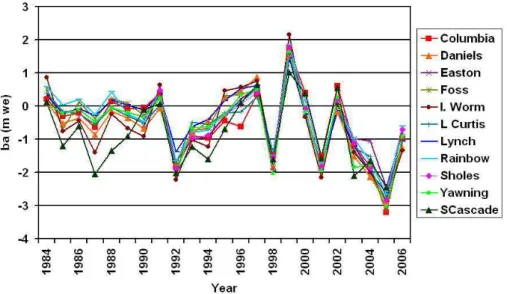
Fig. 2. The ba of North Cascade glaciers and bn for South Cascade glacier 1984–2006, records for individual glaciers are difficult to
distinguish due to the consistently high correlation between glaciers.
representative measurement network are largely consistent and correctable (Pelto, 2000).
3 Results and discussion
The cumulative balance trend, for the 10 NCGCP glaciers indicate an increasing trend of negative mass balance. The trend has become more negative and the interannual varia-tion has increased. The mean annual balance from 1984 to 2006 on North Cascade glaciers is −0.54 m/a (Table 2). The cumulative balance is −12.38 m, equal to an ice thickness loss of at least 14 m (Fig. 3). Given a mean thickness of 30– 60 m the mass loss is a 20–40% loss in total glacier volume. The increase in negative balance during a period of substan-tial retreat, suggests that the current retreat is insufficient for the glaciers to approach equilibrium. Glacier retreat during a period of fixed climate would increase mass balance as a glacier approached equilibrium.
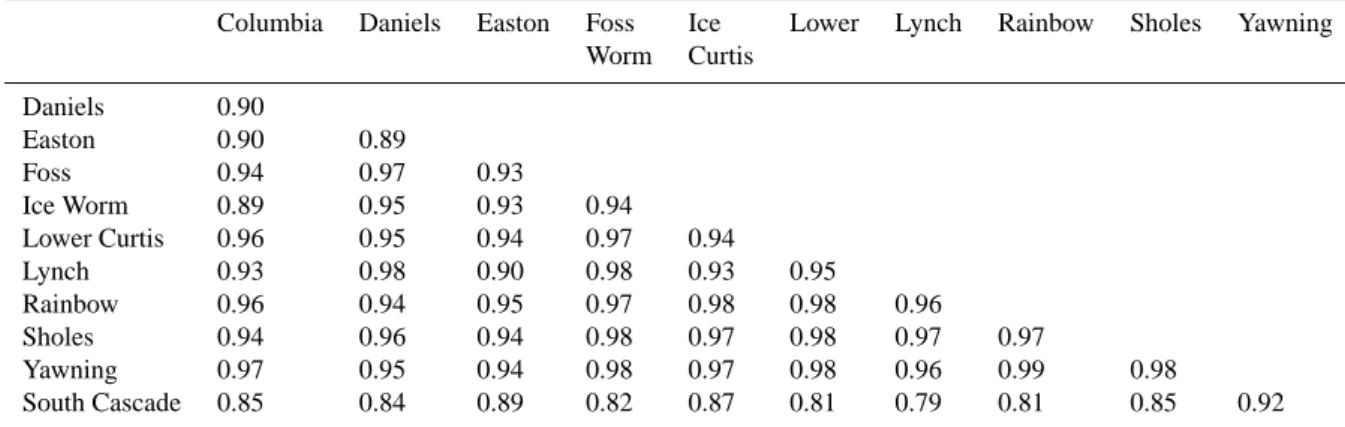
Cross correlation of annual balance and net balance data from NCGCP and USGS programs support the comparison of the two data sets. Correlation coefficients between glaciers using the different field methods range from r2=0.79 to 0.92 (Table 3). South Cascade Glacier has the largest negative bal-ance, and has had the most significant retreat of this group in the last 20 years. The extensive retreat further supports that its mass balance has been more negative. Annual data from the eleven glaciers demonstrate the high degree of correla-tion (Fig. 2; Table 3). The linear trends overlap consistently enough that picking out an individual glacier record is diffi-cult in Fig. 2, indicating the similarity in sensitivity to annual climate conditions. There is a substantial annual range from maximum to minimum bavalues averaging 0.75 m. however the variation from year to year is remarkably similar for all glaciers. Some years peculiarities occur that alter the annual
Fig. 3. Cumulative mass balance record of North Cascade glaciers,
1984–2006, in meters of water equivalent. The increasingly nega-tive trend is evident.
balance of a particular glacier. For example a huge avalanche descended onto the Columbia Glacier in 2002 resulting in the most positive ba of any glacier. In 2003, snowpack depths were below normal on all glaciers except above 2200 m on Easton Glacier, and it had the least negatvie ba.
The loss in volume represents an extensive thinning, which has led to significant retreat of each glacier. This resulted in the final loss of Spider and Lewis Glacier. The Foss Glacier and Ice Worm Glacier have lost more than 30% of their total area since 1984 changing their character substantially, nei-ther glacier will persist long with the current climate.
4 Modeled versus measured annual balance
NCGCP has a temporally long enough glacier ba record to be contrasted meaningfully with climate data and climate
16 M. S. Pelto: Glacier annual balance measurement, prediction, forecasting
Table 2. The annual balance of the 9 NCGCP, and net balance for South Cascade Glacier from the USGS study (Krimmel, 2000; Bidlake et
al., 2007) in waterequivalent meters.
Glacier Columbia Daniels Easton Foss I.Worm L.Curtis Lynch Rainbow Sholes Yawning Scascade
Year NCGCP NCGCP NCGCP NCGCP NCGCP NCGCP NCGCP NCGCP NCGCP NCGCP USGS 1984 0.21 0.11 0.51 0.86 0.39 0.33 0.58 0.09 0.12 1985 −0.31 −0.51 −0.69 −0.75 −0.16 −0.22 0.04 −0.23 −1.20 1986 −0.20 −0.36 0.12 −0.45 −0.22 −0.07 0.20 −0.10 −0.61 1987 −0.63 −0.87 −0.38 −1.39 −0.56 −0.30 −0.26 −0.47 −2.06 1988 0.14 −0.15 0.23 −0.24 −0.06 0.17 0.43 −0.06 −1.34 1989 −0.09 0.37 0.09 −0.67 −0.29 0.03 −0.24 −0.19 −0.91 1990 −0.06 −0.68 −0.58 −0.27 −0.92 −0.51 −0.12 −0.46 −0.32 −0.32 −0.11 1991 0.38 −0.07 0.41 0.30 0.63 0.04 0.36 0.44 0.48 0.23 0.07 1992 −1.85 −1.70 −1.67 −1.92 −2.23 −1.76 −1.38 −1.65 −1.88 −2.06 −2.01 1993 −0.90 −0.83 −1.01 −0.73 −1.02 −0.48 −0.62 −0.80 −0.96 −0.66 −1.23 1994 −0.96 −0.45 −0.92 −0.68 −1.23 −0.55 −0.40 −0.72 −0.88 −0.62 −1.86 1995 −0.45 0.24 −0.31 0.31 0.47 −0.21 0.18 −0.20 −0.25 −0.26 −0.69 1996 −0.62 0.45 0.22 0.34 0.57 −0.18 0.53 0.12 0.06 0.34 0.10 1997 0.35 0.88 0.53 0.50 0.76 0.27 0.62 0.51 0.42 0.50 0.63 1998 −1.46 −1.82 −1.87 −1.95 −1.64 −1.38 −1.97 −1.49 −1.56 −2.03 −1.60 1999 1.75 1.52 1.61 1.56 2.15 1.55 1.45 1.84 1.76 1.63 1.02 2000 0.40 −0.25 −0.10 −0.10 −0.33 −0.25 −0.24 0.15 −0.08 −0.18 0.38 2001 −1.52 −1.75 −1.93 −1.92 −2.15 −1.88 −1.82 −1.71 −1.83 −1.94 −1.57 2002 0.60 −0.18 0.18 0.10 0.05 0.13 −0.13 0.12 0.21 0.26 0.55 2003 −1.17 −1.52 −0.98 −1.35 −1.40 −1.25 −1.20 −0.98 −1.12 −1.85 −2.10 2004 −1.83 −2.13 −1.06 −1.94 −2.00 −1.51 −1.98 −1.67 −1.86 −1.78 −1.65 2005 −3.21 −2.90 −2.45 −3.12 −2.85 −2.75 −2.62 −2.65 −2.84 −3.02 −2.45 2006 −0.98 −1.25 −0.79 −1.02 −1.35 −1.06 −1.05 −0.61 −0.71 −0.93
Table 3. Cross correlation of mass balance on North Cascade glaciers, range from 0.79–0.99.
Columbia Daniels Easton Foss Ice Lower Lynch Rainbow Sholes Yawning Worm Curtis Daniels 0.90 Easton 0.90 0.89 Foss 0.94 0.97 0.93 Ice Worm 0.89 0.95 0.93 0.94 Lower Curtis 0.96 0.95 0.94 0.97 0.94 Lynch 0.93 0.98 0.90 0.98 0.93 0.95 Rainbow 0.96 0.94 0.95 0.97 0.98 0.98 0.96 Sholes 0.94 0.96 0.94 0.98 0.97 0.98 0.97 0.97 Yawning 0.97 0.95 0.94 0.98 0.97 0.98 0.96 0.99 0.98 South Cascade 0.85 0.84 0.89 0.82 0.87 0.81 0.79 0.81 0.85 0.92
indices. The two key climate variables are ablation season temperature and accumulation season precipitation (Fig. 4). We examined ablation season temperature for five regional weather stations and for two different month combinations (May–September and June–September) and found the Dia-blo Dam record for June–September provides the best cor-relation with ba. For accumulation season precipitation, annual balance was correlated with precipitation at Dia-blo Dam and Concrete WA for differing combinations of
months, and with 1 April snow water equivalent (SWE) at five United States Department of Agriculture (USDA) Snow-pack Telemetry stations (SNOTEL) stations; Rainy Pass, Ly-man Lake, Stevens Pass, Miners Ridge and Fish Lake. The best correlation is with 1 April SWE. 1 April is near the snowpack maximum for most of the SNOTEL sites (Mote, 2003).
In Fig. 4, 1 April SWE has declined by 25% at these stations since 1946, while winter season precipitation
Fig. 4. 1 April SWE at five USDA Snotel stations and ablation season temperature (June–September) at Diablo Dam from 1946–2006. This
illustrates the 0.6◦C ablation season (June–September) warming and 25% decline in 1 April SWE.
Fig. 5. Scatter plot and linear regression of ablation season
tempera-ture (June–September) at Diablo Dam and measured annual balance of North Cascade glaciers for the 1984–2004 period.
(November–March) has increased 1–3% at Concrete and at Diablo Dam, the most reliable long term weather stations. Mote (2003) in examining 40 stations in the Washington and British Columbia noted that substantial declines in SWE co-incide with significant increases in winter temperature, and occur in spite of increases in winter precipitation.
In Figs. 5 and 6, bais plotted against ablation season tem-perature at Diablo Dam and 1 April SWE respectively. The resulting linear regression equations were then simply
com-Fig. 6. Scatter plot and linear regression line between mean 1 April
SWE at five USDA SNOTEL stations and measured annual balance of North Cascade glaciers for the 1984–2004 period.
bined to calculate annual balance. The resulting equation requires as input only the mean June–September tempera-ture at Diablo Dam (T) and the mean 1 April SWE (s) at the SNOTEL stations. This calculation was also performed us-ing multiple linear regression. The value of r between the calculated and measured bais 0.91 for multiple regression. Equation (1) is appropriate if the variables are independent. ba=7.03048 − 0.614959T + 2.219146s (1)
18 M. S. Pelto: Glacier annual balance measurement, prediction, forecasting
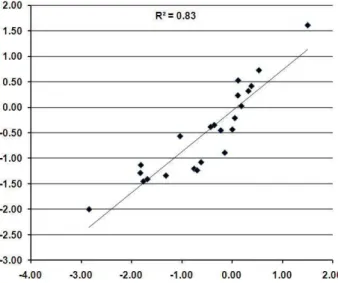
Fig. 7. Scatter plot of calculated versus measured annual balance
on North Cascade glaciers 1984–2006. Annual Balance calculated using multiple regression from Eq. (1) with 1 April SWE and June– September T.
Figure 7 has the calculated versus measured annual balance for the 8 North Cascade glaciers with ongoing records for the entire period. That a simple model such as this provides reasonable results indicates the close connection between the regional climate conditions and the mean annual balance of North Cascade glaciers.
5 Mass balance forecasting from climate indices
A number of papers have examined the relationship of Pacific Northwest glacier mass balance to atmospheric circulation indices (McCabe and Fountain, 1995; Hodge et al., 1998; Bitz and Battisti, 1999; Pelto and Miller, 2003). They have shown that these glaciers correlate with the Pacific Decadal Oscillation (PDO) and Multivariate El Nino Southern Oscil-lation Index (ENSO) particularly over a multi year period (McCabe and Fountain, 1995; Bitz and Batisti 1999; Hodge et al., 1998). Variations in the PDO and ENSO accounted for 42% and 20% of the variance in annual mass balance re-spectively of South Cascade Glacier (Bitz and Batisti, 1999). The variances indicate the importance of each index, yet nei-ther ENSO or PDO are well enough correlated with annual balance to provide any reasonable predictive or forecasting ability (Fig. 8) (Pelto and Miller, 2003). The r2value is 0.16 between PDO and baand 0.52 between ENSO and bafor the 1984–2005 period.
The PDO Index is the leading principal component of North Pacific monthly sea surface temperature variability, poleward of 20 N (Mantua et al., 1997). During the posi-tive PDO phase warm weather is favored in the Pacific along the northwest coast and over the Pacific Northwest. During
Fig. 8. Scatter plot for annual values of PDO (Mantua and others,
1997), ENSO (Wolter and Timlin, 1998) for the 1984–2004 period. The poor fit of each index is evident.
the negative phase cool ocean water is found off the north-west coast and cooler temperatures across the Pacific North-west (Mantua et al., 1997). In the past century: “cool” PDO regimes prevailed from 1890–1924 and again from 1947– 1976, while “warm” PDO regimes dominated from 1925– 1946 and from 1977 through the present (Mantua et al., 1997). It had been postulated in the late 1990’s that a neg-ative PDO phase may have been beginning, however a PDO continues to be dominantly positive through 2006. (data source: http://jisao.washington.edu/pdo/PDO.latest).
The El Ni˜no/Southern Oscillation (ENSO) phenomenon is the most observable of the atmospheric circulation indices that lead to year-to-year climate variability. ENSO positive events (El Nino) herald abnormally warm sea surface temper-atures (SST) over the eastern half of the equatorial Pacific. La Ni˜na, is the opposite phenomenon, indicative of abnor-mally cold SST in the eastern half of the equatorial Pacific. ENSO is an east-west atmospheric pressure see-saw that di-rectly affects tropical weather around the globe and indidi-rectly impacts a much larger area (Wolter and Timlin, 1998). The ENSO multivariate index used here is based on the princi-pal observed climate variables over the tropical Pacific. The index is a weighted average of the main ENSO features con-tained in the following six variables: sea-level pressure, the east-west and north-south components of the surface wind, SST, surface air temperature, and total amount of cloudiness (Wolter and Timlin, 1998)(data sourcehttp://www.cdc.noaa. gov/people/klaus.wolter/MEI/table.html). Sustained positive values of this ENSO index often indicate El Nino episodes. These positive values are usually accompanied by sustained warming of the central and eastern tropical Pacific Ocean. Negative values of this ENSO index are associated with stronger Pacific trade winds and warmer sea temperatures to the north of Australia (Wolter and Timlin, 1998).
The positive phase spatial patterns are very similar for both indices and it is postulated that they reinforce each other substantially when in phase (Gershunov et al., 1999).
Table 4. The columns are respectively: Mean value of winter PDOW (October–April). Winter ENSOW (October–April). Glacier net balance
bn−SC from South Cascade Glacier 1960–2005. Glacier annual balance ba-NC for the 10 NCGCP glaciers (1984–2006). The relative phase:
positive, >0.2 (p), negative, <−0.2 (n) and equilibrium −0.2 to 0.2 for equilibrium (e), for PDOW, ENSOW indices and glacier net balance and annual balance (bn-ba) respectively. The number of the rule utilized from Sect. 5. Lastly if the rule correctly yields the annual balance in terms of negative, equilibrium or positive it is noted by a yes, if not a no for both bn-ba. The rule is correct in 41 of 46 years for the South Cascade Glacier for which the model was designed. The rule is correct in 20 of 23 years for the North Cascade Glacier Climate Project glaciers.
Year PDOW ENSOW bn-SC Ba-NC PDOW ENSOW bn-ba Rule# Result 1960 0.34 −0.17 −0.50 p e n 3 yes 1961 0.30 −0.23 −1.10 p e n 3 yes 1962 −1.64 −0.79 0.20 n n p 2 yes 1963 −0.62 −0.71 −1.30 n n n 2 no 1964 −0.83 0.41 1.20 n p p 4 no 1965 −0.63 −0.64 −0.17 n n e 2 yes 1966 −0.42 1.06 −1.03 n p n 4 yes 1967 −0.73 −0.52 −0.63 n n n 2 no 1968 −0.54 −0.68 0.01 n n e 2 yes 1969 −0.74 0.54 −0.73 n p n 4 yes 1970 0.78 0.34 −1.20 p p n 1 yes 1971 −1.44 −1.38 0.60 n n p 2 yes 1972 −1.56 −0.74 1.43 n n p 2 yes 1973 −0.27 1.41 −1.04 n p n 4 yes 1974 −1.10 −1.70 1.02 n n p 2 yes 1975 −0.45 −0.85 −0.05 n n e 2 yes 1976 −1.40 −1.55 0.95 n n p 2 yes 1977 1.05 0.49 −1.30 p p n 1 yes 1978 0.34 0.81 −0.38 p p n 1 yes 1979 −0.16 0.29 −1.56 e e n 6 yes 1980 0.70 0.75 −1.02 p p n 1 yes 1981 0.87 0.15 −0.84 p e n 3 yes 1982 0.31 −0.07 0.08 p e e 3 yes 1983 0.87 2.68 −0.77 p p n 1 yes 1984 1.38 −0.07 0.12 0.43 p e e-p 3 yes-yes 1985 0.73 −0.45 −1.20 −0.37 p n n-n 5 yes-yes 1986 0.91 −0.15 −0.61 −0.14 p e n-e 3 yes-yes 1987 1.78 1.29 −2.06 −0.63 p p n-n 1 yes-yes 1988 1.23 0.98 −1.34 0.07 p p n-e 1 yes-no 1989 −0.52 −1.16 −0.91 −0.22 n n n-n 2 no-no 1990 −0.30 0.26 −0.11 −0.44 n e e-n 2 yes-no 1991 −1.37 0.33 0.07 0.33 n e e-p 2 yes-yes 1992 0.40 1.61 −2.01 −1.78 p p n-n 1 yes-yes 1993 0.66 0.80 −1.23 −0.82 p p n-n 1 yes-yes 1994 1.05 0.52 −1.60 −0.75 p p n-n 1 yes-yes 1995 −0.50 0.99 −0.69 −0.02 n p n-e 4 yes-yes 1996 0.59 −0.48 0.10 0.17 p n e-e 5 yes-yes 1997 0.28 −0.20 0.63 0.54 p e p-p 3 no-yes 1998 1.30 2.46 −1.86 −1.68 p p n-n 1 yes-yes 1999 −0.58 −0.93 1.02 1.69 n n p-p 2 yes-yes 2000 −1.16 −0.95 0.38 −0.09 n n p-e 2 yes-yes 2001 −0.04 −0.48 −1.57 −1.83 e n n-n 6 yes-yes 2002 −0.67 −0.05 0.55 0.12 n e p-e 2 yes-yes 2003 1.51 0.91 −2.10 −1.22 p p n-n 1 yes-yes 2004 0.54 0.34 −1.65 −1.78 p p n-n 1 yes-yes 2005 0.39 0.65 −2.45 −2.82 p p n-n 1 yes-yes 2006 −0.08 −0.43 −0.98 −0.98 e n n 6 ?-yes 2007 −0.07 0.84 e p ? 6 ?-?
20 M. S. Pelto: Glacier annual balance measurement, prediction, forecasting Both indices favor anomalously warm sea surface
tempera-tures near the equator and along the coast of North America, and anomalously cool sea surface temperatures in the central North Pacific (Mantua et al., 1997; Gershunov et al., 1999).
Correlation of annual balance and PDO and ENSO atmo-spheric circulation indices was used to determine the util-ity for forecasting glacier mass balance from the PDO and ENSO (Pelto and Miller, 2003). Mass balance records from South Cascade Glacier (Krimmel, 2000; Bidlake et., 2007) and NCGCP glaciers were utilized separately. The goal was forecasting mass balance as early as possible during the hy-drologic year. Thus, various combinations of months were used. The best fit was for October-April for both indices. This allows forecasting in May. Table 4 displays the bn balance of South Cascade Glacier, the mean ba of NCGCP monitored glaciers, and the October–April mean index val-ues. Each index is a critical indicator for annual balance that when taken alone does not predict specific annual bal-ance values reliably (Fig. 8), but when considered together do provide an assessment of whether mass balance will be positive or negative. In much the same way that the seasonal forecast for the number of hurricanes is determined from a suite of indicators, this seems to be the most reasonable ap-proach for glacier mass balance forecasting. Six forecasting rules are developed that can be applied to 47 possible years 1960–2006 examined. Rule 3 and Rule 4 differ for NCGCP glaciers and South Cascade Glacier. The forecast rules pro-vide a correct assessment in 41 of the 46 years for South Cascade Glacier and 20 of 23 years for NCGCP glaciers.
Rule 1. If both PDO and ENSO are positive, than glacier mass balance will be negative on South Cascade Glacier. This rule works in all 14 of the 14 years. Same for NCGCP glaciers the rule is correct in 8 of nine years.
Rule 2. If PDO is negative and ENSO is equilibrium or negative, mass balance will be equilibrium or positive on South Cascade Glacier. This rule is successful in 13 of 16 years. Same for NCGCP glaciers, and is successful in 9 of 10 years.
Rule 3. If PDO is positive and ENSO is neutral the glaciers will have an equilibrium or negative balance on South Cas-cade Glacier. The rule is correct in 6 of 7 years. For NCGCP glaciers the result is positive glacier balance, and is success-ful in 4 of 6 years.
Rule 4. If PDO is negative and ENSO is positive the glacier balance will be negative on South Cascade Glacier. This is true in 5 of 6 years. For NCGCP glaciers the result is positive glacier balance, and is successful in 1 of 1 years.
Rule 5. If PDO is positive and ENSO is negative glacier mass balance will be negative on South Cascade Glacier. This rule provides an accurate result in 2 of 2 years. Same for NCGCP glaciers, and is successful in 2 of 2 years.
Rule 6. If PDO is neutral then glacier annual balance will be negative on South Cascade Glacier. This rule is accurate in 3 of 3 years. Same for NCGCP glaciers, and is successful in 2 of 2 years.
The rule is correct in 41 of 46 years for the South Cascade Glacier. The rule is correct in 20 of 23 years for the North Cascade Glacier Climate Project glaciers. These rules pro-vide us with the capability to forecast glacier annual balance given winter PDO and ENSO values. Given the neutral na-ture of the PDO and a positive ENSO value in the winter of 2007, it is forecast as of 1 May that North Cascade glacier annual balance will be negative in 2007.
6 Conclusions
Data from the USGS, and NCGCP glacier monitoring pro-grams both indicate that the long-term trend for North Cas-cade glaciers continues to be strongly negative, despite a slightly positive trend for most glaciers from 1996–2000 (Fig. 3). The consistently high correlation coefficients be-tween glaciers demonstrate the glaciers are responding to a regional climate change. There are no distinct regional vari-ations within the range. The glaciers are in disequilibrium with the present climate as indicated by the mean annual bal-ance loss of −0.54 m/a, a cumulative loss of −12.38 m, 20– 40% of their entire volume and increasing negative balances despite retreat (Pelto, 2006)
The combined mean annual balance of the ten glaciers can be reliably calculated using ablation season temperatures from Diablo Dam and 1 April SWE from SNOTEL stations. If the annual balance is calculated for individual glaciers the error increases appreciably. This indicates the strong connec-tion between regional climate condiconnec-tions and each glaciers annual balance.
Though the statistical and graphical relationship between annual balance and the PDO and ENSO climate indices is not quantitatively strong, both are a key influence of annual bal-ance (Table 4). This is demonstrated being able to correctly forecast the sign of annual balance in 42 of 47 years simply by applying six forecasting rules using October–April PDO and ENSO index values. As predictors of glacier mass bal-ance positive MEI values, El Nino, and warm phase PDO’s favor negative balances, and cool phase PDO’s and negative MEI values, La Nina, favor positive annual balances.
References
Beamish, R. J., Neville, C. E., and Cass, A. J.: Production of Fraser River sockeye salmon (Oncorhynchus nerka) in relation to decadal-scale changes in the climate and the ocean, Can. J. Fish. Aquat. Sci., 54, 543–554, 1997.
Bidlake, W. R., Josberger, E. G., and Savoca, M. E.: Water, Ice, and Meteorological Measurements at South Cascade Glacier, Wash-ington, Balance Years 2004 and 2005: U.S. Geological Survey Scientific Investigations Report 2007, 5055, 2007.
Bitz, C. M. and Battisti, D. S.: Interannual to decadal variability in climate and the glacier mass balance in Washington, Western Canada, and Alaska, J. Climate, 12, 3181–3196, 1999.
Fountain, A., Trabant, D., Brugman, M., Ommaney, C. S., and Monroe, D.: Glacier mass balance standards, EOS, 72(46), 511– 514, 1991.
Gershunov, A., Barnett, T., and Cayan, D.: North Pacific inter-decadal oscillation seen as factor in ENSO-related north Ameri-can climate anomalies, EOS, 80, 25–30, 1999.
IPCC: Climate Change 1995: Contributions of working group I to the second assessment of the Intergovernmental Panel on Climate Change, Cambridge University Press, 241–265, 1996.
Hodge, S. M., Trabant, D. C., Krimmel, R. M., Heinrichs, T. A., March, R. S., and Josberger, E. G.: Climate variations and changes in mass of three glaciers in western North America, J. Climate, 11, 2161–2179, 1998.
Krimmel, R. M.: Water, Ice, Meteorological and Speed Measure-ments at South Cascade Glacier, Washington, 1999 Balance Year, p. 35, USGS WRI-00-4265, 2000.
Mantua, N. J., Hare, S. R., Zhang, Y., Wallace, J. M., and Francis, R. C.: A Pacific interdecadal climate oscillation with impacts on salmon production, B. Am. Meterol. Soc., 78, 1069–1079, 1997. Mayo, L. R., Meier, M. F., and Tangborn, W. V.: A system to com-bine stratigraphic and annual mass balance systems: A contribu-tion to the IHD, J. Glaciol., 11(61), 3–14, 1972.
McCabe, G. J. and Fountain, A. G.: Relations between atmospheric circulation and mass balance of South Cascade Glacier, Wash-ington, USA, Arctic and Alpine Res., 27, 229–233, 1995. Mote, P. W.: Trends in snow water equivalent in the Pacific
North-west and their climatic causes, Geophys. Res. Lett., 30, 1601, doi:10.1029/2003GL017258, 2003.
Pelto, M. S.: The annual balance of North Cascade, Washington Glaciers measured and predicted using an activity index method, J. Glaciol., 34, 194–200, 1988.
Pelto, M. S.: Annual net balance of North Cascade glaciers, 1984– 1994, J. Glaciol., 42(140), 3–9, 1996.
Pelto, M. S.: Reply to comments of Meier et al on Annual net bal-ance of North Cascade glaciers 1984–1994 by M. S. Pelto, J. Glaciol., 43(143), 193–196, 1997.
Pelto, M. S.: The impact of sampling density on glacier mass bal-ance determination, Hydrol. Process., 14, 3215–3225, 2000. Pelto, M. S. and Hedlund, C.: Terminus behavior and response time
of North Cascade glaciers, Washington, USA, J. Glaciol., 47, 497–506, 2001.
Pelto, M. S. and Miller, M. M.: Relationship of Lemon Creek Glacier, Alaska and North Cascade glacier mass balance to climate indices, AMS Seventh Conference on Polar Met. and Oceanography and High-Latitude Climate Variations, 2003. Pelto, M. S. and Riedel, J.: Spatial and temporal variations in
an-nual balance of North Cascade glaciers, Washington 1984–2000, Hydrol. Process., 15, 3461–3472, 2001.
Pelto, M. S.: The current disequilibrium of North Cascade Glaciers, Hydrol. Process., 20, 769–779, 2006.
Post, A., Richardson, D., Tangborn, W. V., and Rosselot, F. L.: In-ventory of glaciers in The North Cascades, Washington, US Ge-ological Survey Prof. Paper, 705-A, 1971.
Walters, R. A. and Meier, M. F.: Variability of glacier mass balances in Western North America, in: Aspects of climate variability in the Pacific and western Americas, edited by: Peterson, D. H., AGU, Geophysical Monograph, 55, 365–374, 1989.
Wolter, K. and Timlin, M. S.: Measuring the strength of ENSO how does 1997/98 rank?, Weather, 53, 315–324, 1998.