HAL Id: hal-00295627
https://hal.archives-ouvertes.fr/hal-00295627
Submitted on 1 Mar 2005
HAL is a multi-disciplinary open access
archive for the deposit and dissemination of
sci-entific research documents, whether they are
pub-lished or not. The documents may come from
teaching and research institutions in France or
abroad, or from public or private research centers.
L’archive ouverte pluridisciplinaire HAL, est
destinée au dépôt et à la diffusion de documents
scientifiques de niveau recherche, publiés ou non,
émanant des établissements d’enseignement et de
recherche français ou étrangers, des laboratoires
publics ou privés.
Evaluation of detailed aromatic mechanisms (MCMv3
and MCMv3.1) against environmental chamber data
C. Bloss, V. Wagner, A. Bonzanini, M. E. Jenkin, K. Wirtz, M.
Martin-Reviejo, M. J. Pilling
To cite this version:
C. Bloss, V. Wagner, A. Bonzanini, M. E. Jenkin, K. Wirtz, et al.. Evaluation of detailed aromatic
mechanisms (MCMv3 and MCMv3.1) against environmental chamber data. Atmospheric Chemistry
and Physics, European Geosciences Union, 2005, 5 (3), pp.623-639. �hal-00295627�
www.atmos-chem-phys.org/acp/5/623/ SRef-ID: 1680-7324/acp/2005-5-623 European Geosciences Union
Chemistry
and Physics
Evaluation of detailed aromatic mechanisms (MCMv3 and
MCMv3.1) against environmental chamber data
C. Bloss1, V. Wagner1, A. Bonzanini1, M. E. Jenkin2, K. Wirtz3, M. Martin-Reviejo3, and M. J. Pilling1
1School of Chemistry, University of Leeds, Leeds LS2 9JT, UK
2Imperial College London, Silwood Park, Ascot, Berkshire SL5 7PY, UK
3Centro de Estudios Ambientales del Mediterraneo, C. Charles R. Darwin 14, 46980 Paterna, Spain
Received: 27 July 2004 – Published in Atmos. Chem. Phys. Discuss.: 24 September 2004 Revised: 20 December 2004 – Accepted: 4 February 2005 – Published: 1 March 2005
Abstract. A high quality dataset on the photo-oxidation of benzene, toluene, p-xylene and 1,3,5-trimethylbenzene has been obtained from experiments in the European Photore-actor (EUPHORE), a large outdoor environmental reaction chamber. The experiments were designed to test sensitive features of detailed aromatic mechanisms, and the dataset has been used to evaluate the performance of the Master Chem-ical Mechanism Version 3 (MCMv3). An updated version (MCMv3.1) was constructed based on recent experimental data, and details of its development are described in a com-panion paper. The MCMv3.1 aromatic mechanisms have also been evaluated using the EUPHORE dataset. Signif-icant deficiencies have been identified in the mechanisms, in particular: 1) an over-estimation of the ozone concentra-tion, 2) an under-estimation of the NO oxidation rate, 3) an under-estimation of OH. The use of MCMv3.1 improves the model-measurement agreement in some areas but significant discrepancies remain.
1 Introduction
Ground-level ozone is produced by the photo-oxidation of volatile organic compounds (VOC) in the presence of
nitro-gen oxides (NOx). Houweling et al. (1998) have estimated
that aromatic species contribute about 10% to the global an-thropogenic non-methane VOC emissions, the major source being car exhaust and with a significant contribution from solvent usage. Because of their high ozone creation poten-tials (Derwent et al., 1998), their contribution to ozone pro-duction on a global scale is likely to be proportionately much greater than that which would be estimated based on mass emissions alone. Trajectory model calculations show that for an air mass typical of northwest Europe about one third of the Correspondence to: M. J. Pilling
ozone production is caused by aromatic hydrocarbons (Der-went et al., 1996). Aromatics are also aerosol precursors and it is believed that they significantly contribute to the gener-ation of secondary organic aerosols (Forstner et al., 1997; Calvert et al., 2002)
Photochemical ozone and particulate matter formation are major priorities of the EU air quality policy in the coming
decade (CAFE, 2001). Elevated concentrations of ozone
have been known for a long time now to have adverse ef-fects on human health and vegetation (PORG, 1997). Recent research activities provide also increasing evidence that fine particulate matter has deleterious effects on human health and is causing premature deaths (Finlayson-Pitts and Pitts, 1997, and references therein). Based on these research
re-sults the EU legislations classify fine aerosols (PM10)now
as one of 12 key air pollutants for which target values are defined to achieve necessary reduction in atmospheric con-centrations and improvements in air quality (AQS, 2000).
Photochemical mechanisms are used in air quality mod-elling to assess the importance of the emission of air pollu-tants on the formation of ozone. They are applied, for exam-ple, for the calculation of photochemical ozone creation po-tentials (POCP) for VOC that assist policy makers in defining realistic and cost-efficient pollution control strategies (Der-went et al., 1996). Thus, a detailed understanding of the oxidation mechanisms of aromatics in the atmosphere is a prerequisite for assessing the impact of aromatic emissions on air quality.
For the aromatics that have the greatest effect on air quality, such as benzene, toluene, trimethylbenzenes, and xylenes, the rate coefficients for the OH-radical reaction are known with an uncertainty of about 20–25% (Calvert et al., 2002). The reaction of an aromatic with OH can either re-sult in ring-retaining products or in an opening of the aro-matic ring. Primary products of the ring-opening routes are carbonyl compounds, many of them highly polar and pho-tolabile, which makes quantitative measurements a major
challenge. Owing to these difficulties the mass balance for carbon from product analysis is in all cases less than 70% and typically less than 50% (Calvert et al., 2002). Even yields of major reaction products, reported by different stud-ies, in many cases cover a range of more than a factor of two, reflecting great experimental uncertainties (Atkinson et al., 1989; Klotz et al., 1998; Volkamer et al., 2001, and refer-ences therein).
Despite our fragmentary understanding of aromatic photo-oxidation, the available kinetic and mechanistic data have been condensed into a Master Chemical Mechanism now including the photo-oxidation of 18 aromatics (http://www.
chem.leeds.ac.uk/Atmospheric/MCM/mcmproj.html). The
protocol for the development of the aromatic mechanisms of MCMv3 is described by Jenkin et al. (2003) and reflects the state of knowledge in early 2001. Although there has been much work carried out to elucidate the details of aromatic oxidation over the past two decades, the mechanisms remain highly speculative, particularly because of the limited knowl-edge of the chemistry in the ring-opening routes.
Therefore it is not surprising that comparisons of the aro-matic mechanisms of MCMv1, MCMv2 and MCMv3 with smog-chamber data reveal large deviations for ozone pro-duction as well as the decay of the parent aromatic (Liang and Jacobson, 2000; Wagner et al., 2003). The observed discrepancies indicate shortcomings in the mechanisms
con-cerning both the production of HOxradicals and the NO to
NO2transformation.
These studies imply that for a reliable assessment of the impact of aromatic emissions on regional ozone formation and on secondary aerosol, further improvement of the MCM is required. Traditionally, complex photo-oxidation mech-anisms of VOC are tested with experiments carried out in large reaction vessels, so called smog-chambers (Carter et al., 1995). Compared to ambient simulations this approach has the advantage that a single component system can be in-vestigated under well-defined conditions that are not com-plicated by meteorological and transport effects. Unfortu-nately the use of smog-chamber data has its own set of dif-ficulties. In particular heterogeneous processes occurring on the walls of the chambers can have a significant impact on the chemical system under observation (Killus and Whitten, 1990; Carter, 1995; Dodge, 2000), and loss of chemicals to the chamber walls may be important. If smog-chamber data are used for the evaluation of chemical mechanisms these chamber-related effects need to be quantified and represented by an auxiliary mechanism.
To evaluate the aromatic mechanisms of MCMv3 a set of smog-chamber experiments was carried out during two campaigns (EXACT-1 and EXACT-2) at EUPHORE as part of the EXACT project (Effects of the oXidation of
Aromatic Compounds in the Troposphere). The
evalua-tion procedure focused on four representatives of the class of aromatic compounds: benzene, toluene, p-xylene and 1,3,5-trimethylbenzene (1,3,5-TMB). The objectives of the
EXACT-1/2 campaigns were to deliver a comprehensive evaluation dataset that enables us to develop a coherent pic-ture of the shortcomings in the aromatic mechanisms and to test specific mechanistic details, such as photolysis rates of ring-opened products, yields of major reaction channels and the carbon balance. We have used models to tailor the exper-imental conditions so that the experiments deliver a maxi-mum of information for the evaluation of the aromatic mech-anism. To take chamber-related effects into account an auxil-iary mechanism was constructed and tested against chamber characterization experiments with ethene.
In this paper we describe the dataset for aromatic model evaluation that was obtained in the two EXACT campaigns and we present results of the evaluation of aromatic mecha-nisms of the MCMv3. Measures of model performance are discussed and trends within the set of aromatics are anal-ysed. Based on results from the evaluation experiments, re-sults from the kinetic workpackages of the EXACT project and newly available literature data the aromatic mechanisms were updated to the version MCMv3.1. The performance of these mechanisms is also compared to the evaluation experi-ments. A detailed discussion of the mechanism development itself is presented in a companion publication (Bloss et al., 2005).
2 Methods
2.1 Selection of aromatics
We have selected four aromatic compounds for the evalua-tion experiments considering two major criteria: 1) the pro-portion of the ring-opening routes in the aromatic-OH adduct channel and 2) the complexity of the mechanism. The yields of ring-opening routes of the reaction of the aromatic-OH
adduct with O2 increase with the number of methyl
sub-stituents (Smith et al., 1998, 1999). A correlation or an-ticorrelation between the number of methyl groups of the aromatic and the model-experiment discrepancy for a certain parameter, e.g. the ozone production, would give an indica-tion whether the model shortcomings are located in the ring-opening or ring-retaining routes of the mechanism. The sym-metry of an aromatic is linked to the number of intermediates formed during the photo-oxidation: the higher the symmetry of the compound, the lower the number of reaction products and the less complex the mechanism. Based on these con-siderations we have chosen benzene, toluene, p-xylene and 1,3,5-TMB as a series of aromatics with increasing number of methyl groups and highest possible symmetry.
2.2 Target species
While EUPHORE is highly instrumented the selection of species for measurement is necessarily limited, and only a se-lection of reactants and intermediates of the aromatic systems could be quantified in the EXACT campaigns. We focused
on key compounds that are classified into three groups ac-cording to their importance for the assessment of the model performance.
The first group contains the parent aromatic, O3, NO and
NO2. The concentration time profiles of these compounds
deliver crucial information on the ozone production and the oxidative capacity in the system. To ensure high data quality the aromatic and ozone were measured with two independent
methods, FTIR/GC and UV/FTIR, respectively. NO2 was
measured with a direct method (DOAS), as catalytic convert-ers linked to chemiluminesence instruments are known to be prone to interferences. The details of all the experimental methods used are discussed in Sect. 3.
The second group contains compounds that deliver
im-portant information on the NOy budget, HOx production
or the branching ratios for major reaction routes: HNO3,
PAN, HCHO, glyoxal, methylglyoxal, cresol isomers and
benzaldehyde. HNO3and PAN are crucial components of the
NOybudget and play an important role for long-range
trans-port of oxidised nitrogen in the atmosphere. HCHO, gly-oxal and methylglygly-oxal have been identified as major radical sources in the aromatic oxidation mechanisms (Wagner et al., 2003). Compounds of the second group occur in concentra-tions during the course of a smog-chamber experiment that are high enough to be quantified. But owing to more demand-ing measurement techniques, uncertainties of these measure-ments are considerably higher than for the compounds of the first class.
The third group of compounds contains reaction products, such as butenedial, 4-oxo-2-pentenal, α-angelica lactone, fu-ranones and epoxide type compounds. These compounds are formed in the ring opening channels and potentially provide key information on those channels, on the carbon budget and on radical production in the aromatic systems. However they are extremely difficult to quantify because of their high reac-tivity and low concentrations.
2.3 Experimental design
Smog-chamber experiments coupled with sensitivity analy-sis, have shown that the sensitivity of the ozone production to model parameters (e.g. rate coefficients, product yields,
pho-tolysis rates) is highest at low VOC/NOxratios, that means in
a chemical domain where the ozone production is limited by the availability of VOC (Dodge, 2000; Wagner et al., 2003).
For that reason, experiments at low VOC/NOxratios are
par-ticularly suited to the identification of shortcomings of the ozone chemistry in models. On the other hand, these con-ditions are not typical of atmospheric concon-ditions that prevail
in Southern Europe where the ozone production can be NOx
limited (Solomon et al., 2000). Therefore we decided to carry
out evaluation experiments at both, low and high VOC/NOx
ratios. Unfortunately the VOC limited region is experimen-tally not accessible for aromatics with very high reactivities: the concentration of the aromatic is either too low for
ac-curate measurements or the NOx concentration is so high
(>500 ppb) that reaction pathways which are inoperative un-der atmospheric conditions become important (Volkamer et al., 2002).
With the aid of models we have carefully chosen the ini-tial conditions for the evaluation experiments considering all technical constraints and trying to come as close as possible to atmospheric conditions (Wagner et al., 2003). These sim-ulations show that it is possible to carry out experiments in
the VOC and NOxlimited regimes for benzene and toluene,
whereas for p-xylene and 1,3,5-TMB only the NOxlimited
regime is experimentally accessible. Ozone isopleth plots showing the modelled maximum ozone concentration as a
function of initial aromatic and NOxconcentrations are
avail-able as supplementary information.
In remote and rural areas of Europe and North
Amer-ica NOx concentrations are usually lower than 10 ppb
(Finlayson-Pitts and Pitts, 1999). To test the model perfor-mance under these conditions a new experimental modus was employed: over the whole course of the experiment a
NO/NO2/HONO mixture was injected into the chamber
con-trolled by a feedback system that kept the NOxconcentration
at about 9 ppb. These NOxreplacement runs were only
car-ried out for toluene and 1,3,5-TMB.
2.4 Model simulations of smog-chamber experiments
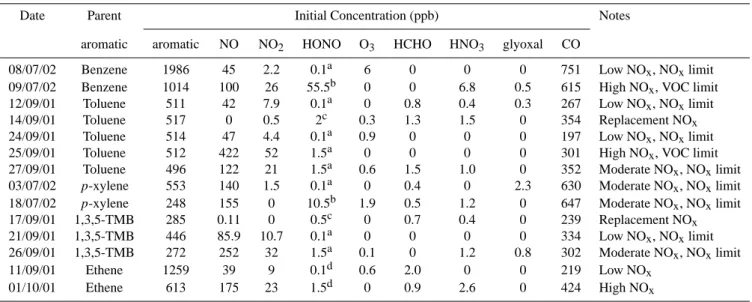
The initial concentrations used in the simulations are those measured immediately before the chamber was exposed to sunlight, and are listed in Table 1. In most cases the initial HONO concentration could not be measured but was esti-mated as discussed below in Sect. 4.1. The temperature and humidity of the chamber were continuously monitored dur-ing the experiments and these values are used in the models. Chamber humidity was low and typical water mixing ratios of 40–70 ppm were observed. The measured photolysis rate
for NO2 is available and for all other photolysis processes
calculated rates were used with scaling factors applied to ac-count for the transmission of the chamber walls, backscat-tering from the chamber floor and cloud cover. The varia-tions from day to day and during the experiments resulting from cloud cover are accounted for by considering the
dif-ference between measured and calculated clear sky J(NO2)
at any given time during the experiments. This variable scal-ing factor, f1, is applied to all photolysis rates in addition to a factor, f2, designed to account for wall and cloud trans-mission effects, which will be different for different species dependent on their absorption spectrum. In a previous
cham-ber dataset (22 Octocham-ber 1997) the photolysis rates for O3,
HCHO, HONO were available in addition to J(NO2), and for
these species the applied scaling factors, f2, are based on the deviation between their measured and calculated photolysis
rates, normalised by the deviation seen for NO2. For all other
Table 1. Initial conditions used in simulations, concentrations measured before opening chamber to sunlight.
Date Parent Initial Concentration (ppb) Notes
aromatic aromatic NO NO2 HONO O3 HCHO HNO3 glyoxal CO
08/07/02 Benzene 1986 45 2.2 0.1a 6 0 0 0 751 Low NOx, NOxlimit
09/07/02 Benzene 1014 100 26 55.5b 0 0 6.8 0.5 615 High NOx, VOC limit
12/09/01 Toluene 511 42 7.9 0.1a 0 0.8 0.4 0.3 267 Low NOx, NOxlimit
14/09/01 Toluene 517 0 0.5 2c 0.3 1.3 1.5 0 354 Replacement NOx
24/09/01 Toluene 514 47 4.4 0.1a 0.9 0 0 0 197 Low NOx, NOxlimit
25/09/01 Toluene 512 422 52 1.5a 0 0 0 0 301 High NOx, VOC limit
27/09/01 Toluene 496 122 21 1.5a 0.6 1.5 1.0 0 352 Moderate NOx, NOxlimit
03/07/02 p-xylene 553 140 1.5 0.1a 0 0.4 0 2.3 630 Moderate NOx, NOxlimit
18/07/02 p-xylene 248 155 0 10.5b 1.9 0.5 1.2 0 647 Moderate NOx, NOxlimit
17/09/01 1,3,5-TMB 285 0.11 0 0.5c 0 0.7 0.4 0 239 Replacement NOx
21/09/01 1,3,5-TMB 446 85.9 10.7 0.1a 0 0 0 0 334 Low NOx, NOxlimit
26/09/01 1,3,5-TMB 272 252 32 1.5a 0.1 0 1.2 0.8 302 Moderate NOx, NOxlimit
11/09/01 Ethene 1259 39 9 0.1d 0.6 2.0 0 0 219 Low NOx
01/10/01 Ethene 613 175 23 1.5d 0 0.9 2.6 0 424 High NOx
aEstimated by consideration of simulations of ethene experiments as described in text. bMeasured concentration.
cCalculated from known addition of HONO, NO, NO
2, gas mixture.
dChosen to best represent early time dependent behaviour of observed concentrations as described in text.
During the experiments a certain amount of air from the chamber is lost through small leaks and withdrawal of air samples for analysis; clean air is added to compensate for this and some dilution of the reactants and products occurs
as a result. To measure the dilution rate SF6 was added to
the reaction mixture as an inert tracer in each experiment and its concentration was monitored by FTIR. The average
calculated loss rate of SF6 over the course of each
experi-ment is used as the dilution rate applied to all stable species
in the simulations. Dilution rates are in the range (1.2–
2)×10−5s−1.
One of the most controversial issues of mechanism eval-uation with smog-chamber data is the influence of chamber-dependent reactions on the reactivity of the chemical system under observation. There are three major groups of processes that contribute to chamber effects: 1) the introduction of free radicals through wall reactions, 2) the adsorption/desorption
of NOyspecies on/from the walls and 3) off-gassing of
or-ganics from the walls that convert OH to HO2 and add to
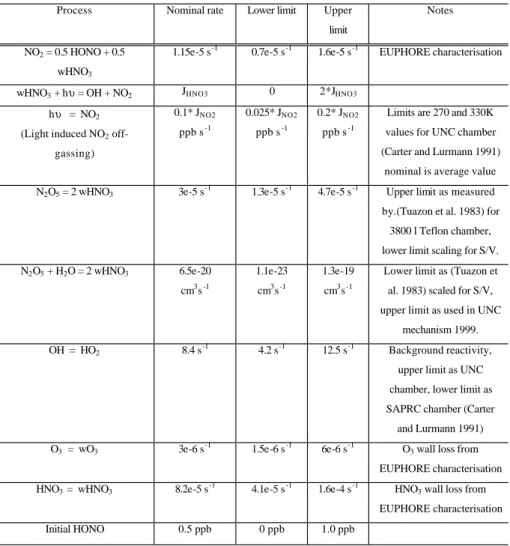
ozone production in the system (Killus and Whitten, 1990). An auxiliary mechanism that considers these chamber re-lated effects has been constructed and the relevant reactions and associated rate coefficients are listed in Table 2. Where data from EUPHORE characterisation experiments are not available, literature data adapted to EUPHORE conditions are taken, and upper and lower limits to these rates have been assigned in order to estimate the maximum impact the auxiliary mechanism may have on the simulations. To test the performance of the auxiliary mechanism two chamber
characterisation experiments with ethene were carried out
to cover both the high VOC/NOx and the low VOC/NOx
regimes. Ethene was chosen as the VOC with a simple, well understood, photo-oxidation mechanism that comes closest to the reactivity of the aromatics. The model-experiment discrepancies for key reactants and reaction products, such
as ethene, O3, NO, and NO2, are taken as a measure for
wall-dependent reactions. The auxiliary mechanism has been tuned to fit the model-experiment discrepancies of the ethene experiments and the resulting auxiliary mechanism was then taken to describe the wall effects in simulations of the aro-matic systems.
2.5 Measures of model performance
For evaluation of the aromatic mechanisms the most impor-tant measures of the model performance are those that relate to the ability of the model to simulate the ozone production and the oxidative capacity in the system.
The production of ozone in the presence of reactive
or-ganic species is a result of the conversion of NO to NO2
by reaction with peroxy radicals. These processes do not consume ozone, and therefore the subsequent photolysis of
NO2 to form O(3P) atoms acts as a net ozone source. The
simplest measure of model performance concerning ozone production is the error in the maximum ozone concentration reached, and this can be evaluated either at the time of the ob-served maximum concentration, or as the difference between the modelled and measured maxima unpaired in time. While
Table 2. Auxiliary mechanism constructed to consider chamber related reactions.
32 Table 2: Auxiliary mechanism constructed to consider chamber related reactions.
Process Nominal rate Lower limit Upper
limit
Notes
NO2 = 0.5 HONO + 0.5 wHNO3
1.15e-5 s-1 0.7e-5 s-1 1.6e-5 s-1 EUPHORE characterisation
wHNO3 + hυ = OH + NO2 JHNO3 0 2*JHNO3
hυ = NO2 (Light induced NO2
off-gassing) 0.1* JNO2 ppb s-1 0.025* JNO2 ppb s-1 0.2* JNO2 ppb s-1
Limits are 270 and 330K values for UNC chamber (Carter and Lurmann 1991)
nominal is average value
N2O5 = 2 wHNO3 3e-5 s-1 1.3e-5 s-1 4.7e-5 s-1 Upper limit as measured
by.(Tuazon et al. 1983) for 3800 l Teflon chamber, lower limit scaling for S/V. N2O5 + H2O = 2 wHNO3 6.5e-20 cm3s-1 1.1e-23 cm3s-1 1.3e-19 cm3s-1
Lower limit as (Tuazon et al. 1983) scaled for S/V, upper limit as used in UNC
mechanism 1999.
OH = HO2 8.4 s-1 4.2 s-1 12.5 s-1 Background reactivity,
upper limit as UNC chamber, lower limit as SAPRC chamber (Carter and Lurmann 1991)
O3 = wO3 3e-6 s-1 1.5e-6 s-1 6e-6 s-1 O3 wall loss from
EUPHORE characterisation
HNO3 = wHNO3 8.2e-5 s-1 4.1e-5 s-1 1.6e-4 s-1 HNO3 wall loss from
EUPHORE characterisation
Initial HONO 0.5 ppb 0 ppb 1.0 ppb
the former approach is the more stringent, the latter can be used to give a good measure of the overall ozone yield of the simulation independent of timing (Carter and Lurmann, 1991).
The rate of change of the difference in ozone and NO
con-centrations (d([O3]-[NO])/dt) can be shown to be equal to
the rate of consumption of NO by reaction with species other
than O3, and the major such process is conversion of NO to
NO2 by reaction with peroxy radicals. Therefore the rate,
d([O3]-[NO])/dt is closely related to the processes
responsi-ble for the production of ozone in photosmog systems and can be used as a definition of reactivity both early in the ex-periment when the NO concentration is high, and later when most of the NO has been consumed and significant amounts
of O3 are being formed. Carter and Lurmann (1991) have
found the average value of d([O3]-[NO])/dt evaluated for the
first half of the time taken to attain maximum experimental ozone concentration to be a good measure for the overall tim-ing of model simulations, and this parameter is referred to as the ‘NO oxidation rate’.
For all the aromatics studied, it was found that the mod-elled OH concentration was insufficient to account for the re-moval of the primary aromatic. The oxidative capacity of the aromatic systems under chamber conditions is determined by the concentration of OH radical, as this is the dominant oxi-dant. Therefore the amount of OH production missing from the mechanism is an important measure of the model perfor-mance, and was calculated using a model where an arbitrary OH source was added to the mechanism. The rate of OH production from this source was constrained to reproduce the observed loss of the primary aromatic. The ‘missing OH’ is then defined as the total amount of OH produced by this ar-bitrary source over the course of the experiment. This value should be compared to the new OH produced by all the other processes included in the mechanism which was calculated by considering the overall radical budget as described in de-tail by Wagner et al. (2003).
The ability of the model to simulate production of other
key product species such as PAN, HNO3, formaldehyde etc.
is evaluated as for ozone, by considering the error in maxi-mum concentration reached, irrespective of timing.
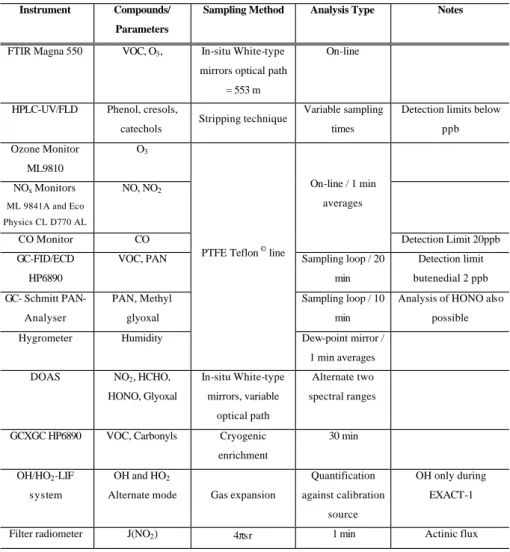
Table 3. Instrumentation used in EUPHORE chambers.
33 Table 3: Instrumentation used in EUPHORE chambers.
Instrument Compounds/
Parameters
Sampling Method Analysis Type Notes
FTIR Magna 550 VOC, O3, In-situ White-type
mirrors optical path = 553 m
On-line
HPLC-UV/FLD Phenol, cresols,
catechols
Stripping technique Variable sampling
times
Detection limits below ppb Ozone Monitor
ML9810
O3
NOx Monitors ML 9841A and Eco Physics CL D770 AL NO, NO2 CO Monitor CO On-line / 1 min averages Detection Limit 20ppb GC-FID/ECD HP6890
VOC, PAN Sampling loop / 20
min Detection limit butenedial 2 ppb GC- Schmitt PAN-Analyser PAN, Methyl glyoxal Sampling loop / 10 min
Analysis of HONO also possible
Hygrometer Humidity
PTFE Teflon © line
Dew-point mirror / 1 min averages
DOAS NO2, HCHO,
HONO, Glyoxal In-situ White-type mirrors, variable optical path Alternate two spectral ranges
GCXGC HP6890 VOC, Carbonyls Cryogenic
enrichment
30 min
OH/HO2-LIF system
OH and HO2
Alternate mode Gas expansion
Quantification against calibration
source
OH only during EXACT-1
Filter radiometer J(NO2) 4πsr 1 min Actinic flux
3 Experimental
The comprehensive dataset for aromatic model evaluation was obtained during two measurement campaigns at the large-volume outdoor smog chamber EUPHORE, located in Valencia, Spain. The full details concerning the operation of the chamber and associated instruments are discussed else-where (Becker, 1996), and a brief description of the fea-tures particularly relevant to obtaining the aromatic dataset is given below.
The EUPHORE facility consists of two FEP foil
hemi-spherical chambers with approximate volume 200 m3, the
transmission of both visible and UV light through the cham-ber walls is high (85–90% for wavelengths 500–320 nm, and around 75% at 290 nm). The aluminium floor panels are covered with FEP foil and are water cooled to reduce solar heating of the chamber and maintain realistic atmospheric temperatures during experimental runs. The chambers are
supplied with hydrocarbon and NOy-free, dry air by use of
an air-drying and purification system that reduces the
back-ground concentration of non-methane hydrocarbons to levels
below 0.3 µg m−3. Homogeneous mixing in the chamber is
achieved with two mixing fans of 67 m3min−1air
through-put running throughout the experiment. Aromatic hydrocar-bons were injected into the chamber from a calibrated sy-ringe and NO was introduced from a gas cylinder through a Teflon transfer line.
The experiments described in this work were carried out in Chamber A, and a summary of the instrumentation used is given in Table 3. Two White-type multi reflection cells are mounted in the chamber; one White system consists of gold-coated mirrors and is coupled to an FTIR interferome-ter (NICOLET Magna 550, MCT-B detector), operated at an absorption path length of 326.8 m. The spectra were derived from the co-addition of 570 interferograms, the spectral
res-olution was 1 cm−1and the time resolution was 10 min. The
FTIR spectra were analysed by subtracting individual refer-ence spectra to obtain the concentration of those compounds. This system was used to obtain the concentration-time pro-files of the parent aromatic and ozone, crucial measurements
for the evaluation of model performance concerning ozone
production and oxidative capacity. Concentrations of HNO3
and HCHO were also available from the FTIR measurements
and these deliver important information on the NOyand HOx
production, respectively.
The other White system is actively laser aligned, equipped with UV-enhanced aluminium coated mirrors coupled to a DOAS spectrometer (f/6.9 Czerny Turner spectrograph; Ac-ton 500; focal length 0.5 m) and operated at an absorption path length of 386 m. DOAS was used to measure
concentra-tions of NO2, HONO and the products HCHO and glyoxal.
The chamber is also equipped with a thermocouple PT-100 to measure air temperature, and two filter radiometers for
measuring J(NO2); one to measure direct sunlight, the other
facing towards the chamber floor and measuring reflected light. Sampling ports in the floor panels connect to various instruments via PTFE Teflon lines: an ozone monitor
(Mon-itor Labs), two NOx monitors (ML9841A and Eco physics
CLD770 AL), a hygrometer, GC-FID/ECD (HP6890) for measuring PAN and VOC concentrations, and GC-Schmitt PAN Analyser for PAN and methylglyoxal. During the EX-ACT campaigns an additional instrument was used for com-prehensive gas chromatography (GCXGC) and measured carbonyl compounds (Hamilton et al., 2003).
The parent aromatic and ozone concentrations were measured with two independent methods, FTIR/GC and UV/FTIR, respectively. For the aromatic, reasonable agree-ment between the two techniques was achieved and the model-measurement comparison was carried out using the FTIR data. In most cases the FTIR and the UV monitor gave consistent measurements for ozone, and the UV measure-ments were used for comparison with the simulations. How-ever, in the two p-xylene experiments the maximum con-centrations observed with the UV monitor were significantly higher than measured by FTIR and it is suggested that the UV data were subject to interference by another absorbing species in these cases. Therefore, for p-xylene the simulated
O3was compared to the FTIR measurements.
Typical uncertainties (2σ ) were ±10% for NO2,
aromat-ics, HCHO and ±5% for O3and NO (Volkamer et al., 2002;
Z´ador et al., 2004).
To measure concentrations of substituted phenol com-pounds samples of chamber air were taken using a stripping
technique with a buffer solution of H2O at pH=7; these
sam-ples were then analysed by HPLC-UV/FLD.
Measurements of HOxradical concentrations can be made
in chamber A; air is sampled by gas expansion and OH
con-centrations are measured by LIF. HO2concentrations can be
measured by using NO to convert HO2to OH before the LIF
measurement. This technique was employed during some of the aromatic hydrocarbon experiments described here, and the measurements are discussed in detail elsewhere (Bloss et al., 2003). These measurements show good agreement between [OH] calculated from the rate of decay of the aro-matic and that measured by LIF, confirming the validity of
the FAGE calibration within the quoted 1σ measurement un-certainty of 26%.
4 Results and discussion
4.1 Chamber dependent reactions
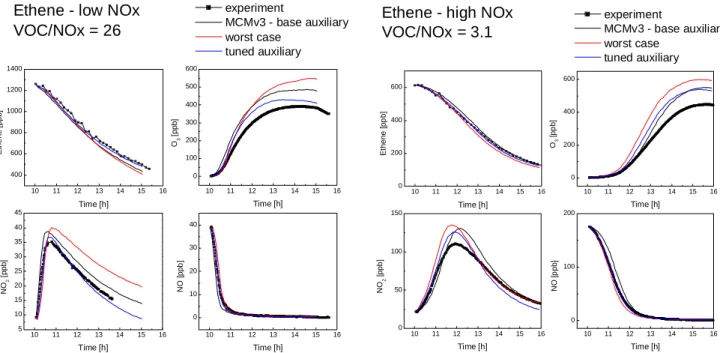
The effects of the chamber dependent reactions listed in Ta-ble 2 were investigated with reference to two ethene photo-smog experiments as discussed in Sect. 2.4 above. Initially each experiment was simulated using the chemical mecha-nism from MCMv3 and a base case auxiliary mechamecha-nism
with all parameters set to nominal values. As shown in
Fig. 1, the observed ethene concentrations were well sim-ulated but the maximum ozone concentration reached was
over-predicted by the models, by 24% for the low NOxcase
and 23% for the high NOxcase. The sensitivity of the O3
production to each parameter in the auxiliary mechanism was assessed by changing each parameter in turn to its upper and lower limit, keeping all other parameters at their nominal
val-ues. The resultant percentage change in maximum O3was
evaluated relative to the base case, and Fig. 2 shows the re-sults for the two sets of experimental conditions, one in the
NOxlimited and one in the VOC limited regime. For the high
NOx, VOC limited experiment the initial HONO
concentra-tion used has largest effect on maximum O3 concentration
reached, decreasing the initial HONO concentration to zero
results in a 4% decrease in maximum O3concentration.
De-creasing the rate of NO2 conversion to HONO and HNO3
also decreases the O3 production. HONO photolysis is an
important radical source and decreasing the radical
produc-tion results in shorter chain lengths and reduced O3
forma-tion. The situation is markedly different in NOxlimited
con-ditions where the light dependent wall source of NO2has the
largest effect on maximum O3concentration; reducing this
rate to its lower limit leads to a 7.4% decrease in O3. In these
conditions increasing the rate of NO2 conversion to HONO
and HNO3decreases the O3production as more NO2is lost
to wall-bound HNO3. As the system is NOxlimited
reduc-ing the amount of NOxavailable decreases the conversion of
peroxy radicals to alkoxy radicals by reaction with NO; chain
length and O3formation are consequently reduced.
To assess the maximum impact of the chamber dependent reactions on the simulations a worst-case scenario was con-structed for each ethene experiment by setting the important
parameters to maximise O3production and increase the
over-prediction observed with the base case mechanism. A single tuned mechanism was also constructed from the information obtained from both experiments to generate the best overall simulation of the datasets. The initial HONO concentration was chosen separately for each experiment to best reproduce
the early time dependence of the observed ethene, O3, NO
and NO2concentrations, with a value of 0.1 ppb being used
10 11 12 13 14 15 16 0 200 400 600 10 11 12 13 14 15 16 0 200 400 600 10 11 12 13 14 15 16 0 50 100 150 10 11 12 13 14 15 16 0 100 200 E thene [p p b ] Time [h] experiment MCMv3 - base auxiliary worst case tuned auxiliary
Ethene - high NOx
VOC/NOx = 3.1
O3 [p p b ] Time [h] NO 2 [ppb ] Time [h] N O [p pb] Time [h] 10 11 12 13 14 15 16 400 600 800 1000 1200 1400 10 11 12 13 14 15 16 0 100 200 300 400 500 600 10 11 12 13 14 15 16 5 10 15 20 25 30 35 40 45 10 11 12 13 14 15 16 0 10 20 30 40 E the ne [ppb] Time [h] experiment MCMv3 - base auxiliary worst case tuned auxiliaryEthene - low NOx
VOC/NOx = 26
O3 [ppb] Time [h] NO 2 [p p b ] Time [h] NO [p p b ] Time [h] 10 11 12 13 14 15 16 0 200 400 600 10 11 12 13 14 15 16 0 200 400 600 10 11 12 13 14 15 16 0 50 100 150 10 11 12 13 14 15 16 0 100 200 E thene [p p b ] Time [h] experiment MCMv3 - base auxiliary worst case tuned auxiliaryEthene - high NOx VOC/NOx = 3.1 O3 [p p b ] Time [h] NO 2 [ppb ] Time [h] N O [p pb] Time [h] 10 11 12 13 14 15 16 400 600 800 1000 1200 1400 10 11 12 13 14 15 16 0 100 200 300 400 500 600 10 11 12 13 14 15 16 5 10 15 20 25 30 35 40 45 10 11 12 13 14 15 16 0 10 20 30 40 E the ne [ppb] Time [h] experiment MCMv3 - base auxiliary worst case tuned auxiliary
Ethene - low NOx VOC/NOx = 26 O3 [ppb] Time [h] NO 2 [p p b ] Time [h] NO [p p b ] Time [h]
Fig. 1. Simulations of the ethene photosmog experiments with base case, worst case and tuned auxilary mechanism.
NO2 = HONO + W HNO3 W H N O 3 = OH + N O2 =N O 2 N2 O5 = W HNO 3 + W HNO3 N2 O5 = W HNO 3 + W HNO3 OH = H O2 O3 = HNO3 = W H NO3 W HNO3 = H N O3 in itia l H O N O -4 -3 -2 -1 0 1 2 3 % c hang e in m a x O3 decreasing rate increasing rate NO 2 = HO NO + W HNO 3 W H N O 3 = OH + N O2 =N O 2 N2 O 5 = W HNO 3 + W HNO 3 N2 O 5 = W HNO 3 + W HNO 3 OH = H O2 O3 = HNO 3 = W HNO 3 W HNO 3 = HNO 3 in it ia l H ONO -8 -6 -4 -2 0 2 4 6 8 10 % c hange in m a x O3 decreasing rate increasing rate
High NO
x
– 01/10/01
Low NO
x
– 11/09/01
NO2 = HONO + W HNO3 W H N O 3 = OH + N O2 =N O 2 N2 O5 = W HNO 3 + W HNO3 N2 O5 = W HNO 3 + W HNO3 OH = H O2 O3 = HNO3 = W H NO3 W HNO3 = H N O3 in itia l H O N O -4 -3 -2 -1 0 1 2 3 % c hang e in m a x O 3 decreasing rate increasing rate NO 2 = HO NO + W HNO 3 W H N O 3 = OH + N O2 =N O 2 N2 O 5 = W HNO 3 + W HNO 3 N2 O 5 = W HNO 3 + W HNO 3 OH = H O2 O3 = HNO 3 = W HNO 3 W HNO 3 = HNO 3 in it ia l H ONO -8 -6 -4 -2 0 2 4 6 8 10 % c hange in m a x O3 decreasing rate increasing rateHigh NO
x
– 01/10/01
Low NO
x
– 11/09/01
Fig. 2. O3sensitivity to auxiliary mechanism for two ethene photosmog experiments.
experiment. The parameters used are summarised in Table 4; all reactions that produced less than 1% change in maximum
O3 concentration in the sensitivity analysis were removed
from the mechanism to minimise unnecessary complexity. The model-measurement comparison for the ethene experi-ments is shown in Fig. 1. The tuned auxiliary mechanism clearly results in better simulation of the experimental data
but it was not possible to eliminate the O3over-prediction.
The contribution of the chamber related processes to the
overall radical and NOxbudgets has been calculated for all
three scenarios for both ethene experiments and the results, integrated over each five hour experiment, are summarised in Table 5. The radical source arising from the auxiliary mech-anism by photolysis of the HONO produced is compared to the total radical production in the mechanisms expressed in terms of new OH equivalents (Wagner et al., 2003). The
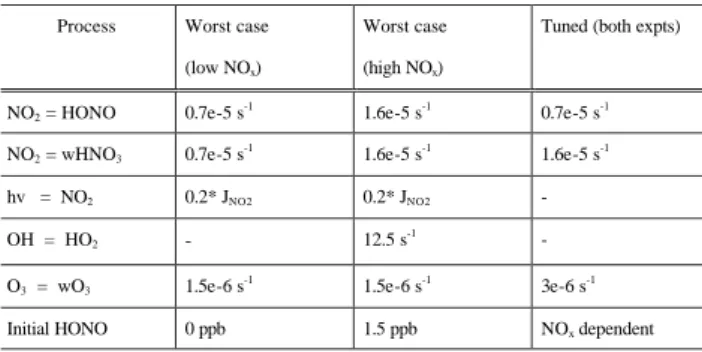
Table 4. Parameters for three auxiliary mechanisms used to assess impact of chamber related processes on ethene experiments.
34 Table 4 : Parameters for three auxiliary mechanisms used to assess impact of chamber related processes on ethene experiments.
Process Worst case
(low NOx)
Worst case
(high NOx)
Tuned (both expts)
NO2 = HONO 0.7e-5 s-1 1.6e-5 s-1 0.7e-5 s-1
NO2 = wHNO3 0.7e-5 s -1 1.6e-5 s-1 1.6e-5 s-1 hv = NO2 0.2* JNO2 0.2* JNO2 - OH = HO2 - 12.5 s -1 - O3 = wO3 1.5e-6 s -1 1.5e-6 s-1 3e-6 s-1
Initial HONO 0 ppb 1.5 ppb NOx dependent
considered and expressed as a net source, a negative value representing a net sink, and this is compared to the initial
NOxconcentration for the experiment or the total NOxsink
in the system. In the low NOxexperiment the auxiliary
rad-ical source is low compared to the total radrad-ical source but the chamber related reactions have a significant effect on the
NOx budget. In the high NOxexperiment the chamber
re-lated NOxsources and sinks are less important than in the
low NOxcase, but the auxiliary radical source makes a larger
contribution to overall radical production.
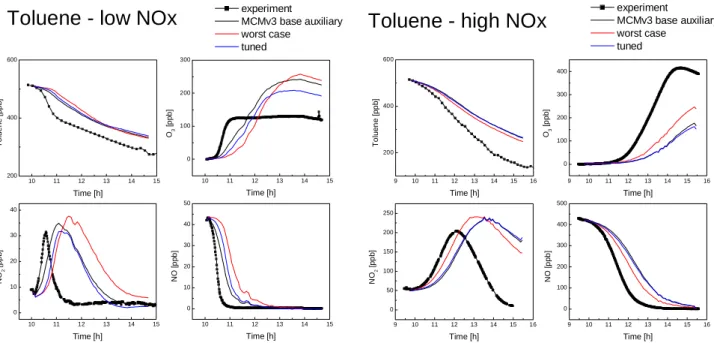
The same base case, worst case and tuned auxiliary mech-anisms applied to the ethene experiments were also used in models with MCMv3 to simulate two toluene experiments,
one low NOx(12 September 2001) and one high NOx (25
September 2001). The model-measurement comparison for the toluene experiments is shown in Fig. 3. It is clearly demonstrated that, although the simulations are sensitive to the parameters used in the auxiliary mechanism, these reac-tions cannot account for the observed model-measurement discrepancies. The radical source arising from the auxiliary mechanism can be compared to the amount of OH produc-tion identified as ‘missing’ from the MCMv3 chemistry (see
below in Sect. 4.2.2 and Table 6). For the high NOxcase the
worst case auxiliary mechanism produces 44.6 ppb OH over the whole course of the simulation, 14% of ‘missing OH’, the tuned auxiliary mechanism gives only 18.4 ppb (6% of
‘missing OH’). In the low NOxexperiment radical
produc-tion is much lower, the OH from the auxiliary mechanism is at most 3.0 ppb, or 2% of the ‘missing OH’ for this experi-ment.
Chamber related processes introduce additional uncertain-ties into model simulation results, but particularly for the aromatic compounds further significant differences exist be-tween modelled and measured concentrations, and the cham-ber datasets can be used to explore shortcomings in the un-derstanding of the gas phase chemical mechanisms.
Similar conclusions were drawn by Z´ador et al. (2004) applying uncertainty analysis to a comparison of MCMv3 simulations with data from the same two ethene experi-ments considered in this work. They included the reaction
Table 5. Ethene photosmog experiments: contribution of cham-ber related reactions to overall radical and NOxbudgets. 6OHnew
refers to the total new OH produced in the photochemical system (Wagner et al., 2003).
35 Table 5: Ethene photosmog experiments: contribution of chamber related reactions to overall radical and NOx budgets. ΣOHnew refers to the total new OH produced in the photochemical system (Wagner et al. 2003).
Low NOx (11/09/01) High NOx (01/10/01) Base case Worst case Tuned Base case Worst case Tuned Auxiliary radical source (ppb) 5.2 3.3 5.6 15.1 22.6 10.1 Radical source (% of ΣOHnew) 2 1 2 11 13 7 Auxiliary net NO2 source (ppb) 8.6 23.8 -6.0 -2.5 4.5 -10.3 % of initial NOx 18 50 2 % of NOx sink 25 2 9
NO2=HONO as a chamber radical source in the models and
found this reaction to have no significant effect on the final
O3 concentration in the low NOx case. For the high NOx
experiment the chamber radical source was seen to have a
non-linear effect on O3concentration, but this effect was
rel-atively minor and the uncertainty arising from this parameter
alone could not account for the O3over-prediction observed.
In all the simulations of the aromatic experiments de-scribed below the tuned auxiliary mechanism obtained by consideration of the two ethene experiments was used. In
order to simulate the concentration-time profile of HNO3,
an important compound for the NOy budget, its wall loss
process was also included, and the nominal rate from EU-PHORE characterisation experiments was assumed. The in-clusion of this process and the value of the rate parameter do not significantly affect the simulated concentrations of any other species.
The initial HONO concentrations used in the models are listed in Table 1. In two experiments HONO was introduced into the chamber in relatively high concentration (9 and 18 July 2002) and the values used are those measured before the
chamber was opened. In the replacement NOx experiments
(14 and 17 September 2001) a mixture of HONO, NO and
NO2was introduced into the chamber at a variable but known
rate throughout the experiment and the values used for initial HONO were calculated from the amount added before cham-ber opening in each experiment. In the other experiments the initial HONO concentration is not known and the concen-trations used in the ethene simulations discussed above were
used as an approximation, i.e. in low NOxconditions 0.1 ppb
was assumed and in high NOx conditions 1.5 ppb was
as-sumed. This is an estimation used in the absence of more re-liable methods and the facility to measure low concentrations
10 11 12 13 14 15 200 400 600 10 11 12 13 14 15 0 100 200 300 10 11 12 13 14 15 0 10 20 30 40 10 11 12 13 14 15 0 10 20 30 40 50 T o lu e n e [pp b] Time [h]
Toluene - low NOx
experimentMCMv3 base auxiliaryworst case tuned O3 [p p b ] Time [h] NO 2 [p p b ] Time [h] NO [p p b ] Time [h] 9 10 11 12 13 14 15 16 200 400 600 9 10 11 12 13 14 15 16 0 100 200 300 400 9 10 11 12 13 14 15 16 0 50 100 150 200 250 9 10 11 12 13 14 15 16 0 100 200 300 400 500 T o luen e [pp b] Time [h] experiment MCMv3 base auxiliary worst case tuned
Toluene - high NOx
O3 [p pb] Time [h] NO 2 [p p b ] Time [h] NO [p p b ] Time [h] 10 11 12 13 14 15 200 400 600 10 11 12 13 14 15 0 100 200 300 10 11 12 13 14 15 0 10 20 30 40 10 11 12 13 14 15 0 10 20 30 40 50 T o lu e n e [pp b] Time [h]
Toluene - low NOx
experimentMCMv3 base auxiliaryworst case tuned O3 [p p b ] Time [h] NO 2 [p p b ] Time [h] NO [p p b ] Time [h] 9 10 11 12 13 14 15 16 200 400 600 9 10 11 12 13 14 15 16 0 100 200 300 400 9 10 11 12 13 14 15 16 0 50 100 150 200 250 9 10 11 12 13 14 15 16 0 100 200 300 400 500 T o luen e [pp b] Time [h] experiment MCMv3 base auxiliary worst case tuned
Toluene - high NOx
O3 [p pb] Time [h] NO 2 [p p b ] Time [h] NO [p p b ] Time [h]
Fig. 3. Simulations of toluene photosmog experiments with base case, worst case and tuned auxiliary mechanism as determined from analysis of the ethene experiments.
of HONO in the chamber would be a valuable addition to the instrumentation available at EUPHORE. However, as dis-cussed above, the contribution of the chamber HONO source to the overall radical production in the aromatic systems is small compared to the gas phase chemical sources and cannot account for the discrepancies observed between the modelled and measured concentrations.
4.2 Evaluation of aromatic mechanisms
4.2.1 Update of MCMv3 to MCMv3.1
The twelve aromatic photosmog experiments carried out during the EXACT campaigns were simulated as described above by models using both MCMv3 and MCMv3.1 mecha-nisms. The updates to MCMv3 resulting in MCMv3.1 have been made on the basis of information from current litera-ture and conference proceedings, and the main updates are as follows:
– Photolysis rates of unsaturated γ -dicarbonyls have been adjusted according to Thuener et al. (2003) for butenedial and 4-oxo-2-pentenal, and Graedler and Barnes (1997) for 3-hexene-2,5-dione. The photolysis rates of the epoxydicarbonylene products have also been increased as they were originally estimated by analogy with the unsaturated γ -dicarbonyls.
– The breakdown of the carbon skeleton for 2(5H)-furanone has been updated and β-angelica lactone has been replaced by α-angelica lactone to reduce the
secondary glyoxal formation. These changes were
prompted by findings of Volkamer et al. (2001) that sec-ondary glyoxal formation in the toluene system is neg-ligible.
– New phenol-type chemistry has been implemented flecting the lower yield for the ring-opening channel re-ported by Olariu et al. (2002), and the need for reduced ozone formation found in a cresol photosmog experi-ment at EUPHORE.
– Branching ratios for the different oxidation routes of aromatics have been adjusted to reflect the reported
yields of glyoxal and of phenol-type compounds at NOx
levels appropriate to the atmosphere (Volkamer et al., 2001, 2002).
The process of mechanism development and further details of the differences between the two mechanism versions are described in detail in a companion paper (Bloss et al., 2005).
4.2.2 First group of key species: parent aromatic, O3, NO2,
NO
The results of the simulations were compared to the mea-sured concentrations of the key species. Figures 4–7 exem-plify model-measurement comparisons for the first group of
target species, the parent aromatic, O3, NO2and NO.
The ability of the models to simulate observed ozone pro-duction and oxidative capacity can be evaluated by consid-eration of the observed and calculated maximum ozone con-centrations and NO oxidation rates, and the amount of OH radical found to be missing from the chemical mechanism as discussed above. These measures of model performance
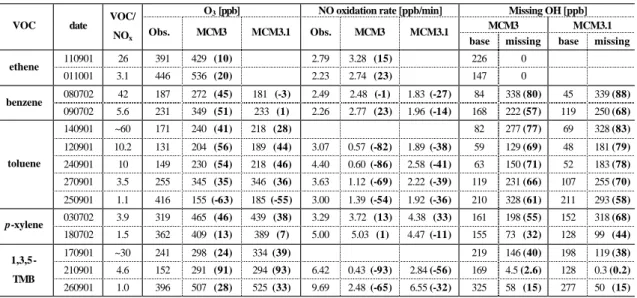
Table 6. Measures of model performance concerning the ozone formation and oxidation capacity for MCMv3 and MCMv3.1. For O3the
peak values are taken irrespective of the time they occur, NO oxidation rate is a measure for the timing of the simulation (see text), and the numbers in bold for these measures are the percentage difference between simulated and observed value, relative to the observed value. For missing OH, base value is the amount of new OH produced by the base mechanism over the course of the experiment, “missing” is the amount of extra OH needed to achieve agreement between modelled and observed aromatic decay, and the number in bold is the missing OH as a percentage of the total OH, (base + missing).
37 Table 6 : Measures of model performance concerning the ozone formation and oxidation capacity for MCMv3 and MCMv3.1. For O3 the peak values are taken irrespective of the time they occur, NO oxidation rate is a measure for the timing of the simulation (see text), and the numbers in bold for these measures are the percentage difference between simulated and observed value, relative to the observed value. For missing OH, base value is the amount of new OH produced by the base mechanism over the course of the experiment, “missing” is the amount of extra OH needed to achieve agreement between modelled and observed aromatic decay, and the number in bold is the missing OH as a percentage of the total OH, (base + missing).
O3 [ppb] NO oxidation rate [ppb/min] Missing OH [ppb]
MCM3 MCM3.1
VOC date VOC/
NOx Obs. MCM3 MCM3.1 Obs. MCM3 MCM3.1 base missing base missing
110901 26 391 429 (10) 2.79 3.28 (15) 226 0 ethene 011001 3.1 446 536 (20) 2.23 2.74 (23) 147 0 080702 42 187 272 (45) 181 (-3) 2.49 2.48 (-1) 1.83 (-27) 84 338 (80) 45 339 (88) benzene 090702 5.6 231 349 (51) 233 (1) 2.26 2.77 (23) 1.96 (-14) 168 222 (57) 119 250 (68) 140901 ~60 171 240 (41) 218 (28) 82 277 (77) 69 328 (83) 120901 10.2 131 204 (56) 189 (44) 3.07 0.57 (-82) 1.89 (-38) 59 129 (69) 48 181 (79) 240901 10 149 230 (54) 218 (46) 4.40 0.60 (-86) 2.58 (-41) 63 150 (71) 52 183 (78) 270901 3.5 255 345 (35) 346 (36) 3.63 1.12 (-69) 2.22 (-39) 119 231 (66) 107 255 (70) toluene 250901 1.1 416 155 (-63) 185 (-55) 3.00 1.39 (-54) 1.92 (-36) 210 328 (61) 211 293 (58) 030702 3.9 319 465 (46) 439 (38) 3.29 3.72 (13) 4.38 (33) 161 198 (55) 152 318 (68) p-xylene 180702 1.5 362 409 (13) 389 (7) 5.00 5.03 (1) 4.47 (-11) 155 73 (32) 128 99 (44) 170901 ~30 241 298 (24) 334 (39) 219 146 (40) 198 119 (38) 210901 4.6 152 291 (91) 294 (93) 6.42 0.43 (-93) 2.84 (-56) 169 4.5 (2.6) 128 0.3 (0.2) 1,3,5-TMB 260901 1.0 396 507 (28) 525 (33) 9.69 2.48 (-65) 6.55 (-32) 325 58 (15) 277 50 (15)
are summarised for each experiment in Table 6 for MCMv3 and MCMv3.1. The investigated aromatics form a series of compounds with increasing methyl substitution, and for
each compound a range of VOC/NOx ratios is covered by
the experiments. The results for the ethene experiments are included to show the level of agreement reached for a sys-tem where the chemistry is well understood, though even in this case the results of the uncertainty analysis performed by Z´ador et al. (2004) suggest some systematic over-prediction
of O3concentration.
In the experiments of 14 and 17 September 2001 the NOx
concentration was kept at a constant low level (∼5–7 ppb) by a feedback mechanism and therefore NO oxidation rate is not a useful measure for these experiments and is not included in the table. It should be noted that in the VOC limited exper-iments (25 September 2001 and 9 July 2002) the simulated ozone concentration does not reach a peak on the timescale of the experiment, therefore the values listed in the table are the ozone concentrations at the end of the experiments and
may under-estimate the O3peak value.
The two low NOxtoluene experiments (12 and 24
Septem-ber 2001) used similar initial conditions and the good agree-ment between measures of model performance for these two days shows that reproducible results are obtained from these chamber studies.
Performance of MCMv3
The simulations over-predict the peak O3concentration, with
the exception of the toluene high NOx(25 September 2001)
experiment where the simulated peak O3is not reached. The
peak O3of the ethene experiments is over-predicted by 10%
and 20% for the low and high NOx cases, respectively; the
chemical mechanism for this simple alkene is well under-stood and this relatively small discrepancy between modelled and observed concentrations may be considered the best we could expect to achieve for the aromatic experiments. In fact only one of the aromatic simulations gives a discrepancy in
this range, which is 13% for the p-xylene higher NOx
ex-periment. Discrepancies as high as 91% are seen
(1,3,5-TMB low NOx)with a more typical value being around 50%.
In general, for the “classical photosmog” experiments, the mechanism seems to perform better when simulating peak
ozone in the higher NOxconditions. The peak O3in the two
experiments where NOxlevels were maintained at a low and
constant level is also simulated better than for the classical
low NOxexperiments. There is no clear trend in the ability
of the model to simulate peak O3with increasing substitution
of the aromatic ring.
The NO oxidation rate is reasonably well simulated by MCMv3 for the two ethene experiments, over-predicting the
observed rate by 15% and 23% for the low and high NOx
cases, respectively, and, as for the peak O3, these values give
some indication of the best level of agreement we may ex-pect for the more complex aromatic systems. As shown in
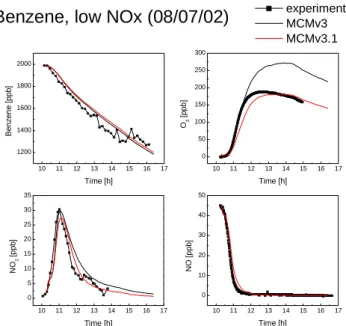
10 11 12 13 14 15 16 17 1200 1400 1600 1800 2000 10 11 12 13 14 15 16 17 0 50 100 150 200 250 300 10 11 12 13 14 15 16 17 0 5 10 15 20 25 30 35 10 11 12 13 14 15 16 17 0 10 20 30 40 50 B e n z en e [ppb] Time [h]
Benzene, low NOx (08/07/02)
experimentMCMv3MCMv3.1 O3 [ppb ] Time [h] NO 2 [p pb] Time [h] N O [p pb] Time [h]
Fig. 4. Model-measurement comparison for benzene, O3, NO2and
NO in benzene photosmog experiment of 8 July 2002.
10 11 12 13 14 15 16 200 400 600 10 12 14 16 0 200 400 10 11 12 13 14 15 16 0 20 40 60 80 100 10 11 12 13 14 15 16 0 50 100 150 T o lu ene [ppb ] Time [h] experiment MCMv3 MCMv3.1 O3 [pp b ] Time [h]
Toluene, moderate NOx (27/09/01)
NO 2 [pp b ] Time [h] NO [p p b ] Time [h]
Fig. 5. Model-measurement comparison for toluene, O3, NO2and NO in toluene photosmog experiment of 27 September 2001.
Table 6, MCMv3 achieves good agreement between mod-elled and measured NO oxidation rate for benzene and p-xylene, while for toluene and 1,3,5-TMB the model signifi-cantly under-predicts the observed value. This is also clear from Figs. 4–7 where the timing of the simulations appears in good agreement with measurements for benzene and p-xylene but simulations of the toluene and 1,3,5-TMB experi-ments show a delay relative to the measureexperi-ments. For a given aromatic the modelled NO oxidation rate increases with
in-10 11 12 13 14 15 16 17 100 200 300 400 500 600 10 11 12 13 14 15 16 17 0 200 400 10 11 12 13 14 15 16 17 0 25 50 75 100 10 11 12 13 14 15 16 17 0 50 100 150 p-X y lene [pp b ] Time [h]
p-Xylene (03/07/02)
experiment MCMv3 MCMv3.1 O3 [ppb] Time [h] NO 2 [p pb] Time [h] N O [p pb] Time [h]Fig. 6. Model-measurement comparison for p-xylene, O3, NO2and
NO in p-xylene photosmog experiment of 3 July 2002.
10 11 12 13 150 200 250 300 350 400 450 10 11 12 13 0 200 400 10 11 12 13 0 20 40 60 10 11 12 13 0 20 40 60 80 100 135-T M B [ppb ] Time [h]
135-TMB, low NOx (21/09/01)
experiment MCMv3 MCMv3.1 O3 [p p b ] Time [h] NO 2 [p p b ] Time [h] NO [ppb ] Time [h]Fig. 7. Model-measurement comparison for 1,3,5-trimethylbenzene, O3, NO2 and NO in 1,3,5-TMB photosmog
experiment of 21 September 2001.
creasing initial NOx, and in most cases this results in
im-proved model-measurement agreement at higher initial NOx
concentrations.
The measure of the OH source missing from the mech-anism is taken to be the amount of OH which needs to be added to the system to achieve agreement between modelled and observed decay of the parent compound over the whole experiment, expressed as a percentage of the total OH source
in that model. In the case of the ethene experiments, the MCMv3 simulation gives a good description of the ethene loss and no OH source is missing. However, for most of the aromatic experiments a significant OH addition is re-quired, with a missing OH of up to 80% for benzene. In general, the models seem to have less missing OH in the
higher initial NOxconditions, in line with the improved
sim-ulation of the timing parameter (NO oxidation rate), which is related to the oxidative capacity of the system. The ex-ception is the 1,3,5-TMB experiments where missing OH is relatively low for all experiments. There is also a trend to lower missing OH with increasing methyl substitution, and hence with increasing reactivity of the aromatic. For ben-zene the model-measurement comparison (Fig. 4) shows the parent compound decay to be reasonably well simulated, but as the rate of reaction of OH with benzene is slow a large additional concentration of OH is needed to correct for the small under-prediction of the loss rate. Much of the benzene decay is accounted for by chamber air dilution, and the ‘miss-ing’ OH measure of model performance is more appropriate for the higher reactivity systems where most of the aromatic decay is a result of OH reaction. It should also be noted that for each experiment there is not a fixed amount of OH pro-duction needed to produce the observed decay in aromatic, the amount depending on the lifetime of OH, and hence on the concentrations of products which depend on the details of the chemical mechanism.
Performance of MCMv3.1 compared to MCMv3
(1) Benzene. The O3peak in the benzene system is greatly
reduced in the MCMv3.1 compared to MCMv3, and is in good agreement with the measurement, as shown in Fig. 4. This substantial improvement is mainly as a result of an increased phenol channel yield implemented in MCMv3.1 and an increased ring-retaining product yield in that channel. Sensitivity studies have shown the ring-opening routes to be generally the most efficient at generating ozone (Jenkin et al., 2000; Wagner et al., 2003). This is partly because the prod-ucts, such as α-dicarbonyls and conjugated γ -dicarbonyls, rapidly photolyse to generate radicals and hence increase re-activity in the system and promote ozone formation from VOC oxidation. Also these routes proceed via the formation
of peroxy radicals and involve two NO-to-NO2conversion
steps in the initial oxidation step. In contrast the initial
ox-idation of benzene to phenol involves only one NO-to-NO2
conversion step, the phenol product is not a radical source, and in MCMv3.1 the subsequent chemistry results mainly in the formation of further substituted aromatics, including
nitro-phenol and nitro-catechol which act as a sink of NO2
and reduce the NOx available for ozone formation.
How-ever, this increase in ring-retaining yield and consequent de-crease in radical production leads to an inde-crease in missing OH, and a decrease in the NO oxidation rate which was well simulated by MCMv3 for the benzene experiments. This is
indicative of a general problem with the mechanisms, over-prediction of the ozone concentration but under-over-prediction of the reactivity of the system. Reducing the ozone production by reducing the peroxy radical concentrations and hence the
amount of NO to NO2conversion also reduces the OH
pro-duction and the oxidative capacity of the system.
(2) 1,3,5-trimethylbenzene. At the other end of the aro-matic series, for 1,3,5-trimethylbenzene simulated ozone and NO oxidation rate both increase in MCMv3.1 relative to MCMv3, i.e. the opposite effects to those seen for benzene. An example is shown in Fig. 7. There is no new information on the substituted phenol yield for this compound so it re-mains unchanged from MCMv3, and as the aromatic ring is already substituted in the ortho and para positions relative to the phenol group the chemistry cannot be updated in an anal-ogous way to the other phenols and also remains unchanged. The increased NO oxidation rate and ozone production is a result of the increased photolysis rates of the unsaturated dicarbonyl compounds producing more radicals in the early stages of the experiment.
(3) Toluene. The bulk of the development work in the project has focused on toluene and the model-measurement agreement in terms of both ozone concentration and NO ox-idation is improved in MCMv3.1. An example is shown in Fig. 5. This mechanism has an increased branching ratio for ring opening in toluene oxidation, and a slightly decreased cresol yield. These changes, along with the increased pho-tolysis rates of the unsaturated dicarbonyl compounds, tend to increase radical production, particularly early in the
ex-periment, and increase O3generation. However, changes to
the substituted phenol (cresol) chemistry, analogous to those
discussed above for the benzene system, decrease O3
for-mation and reduce radical production in the middle of the experiment. The changes balance out in such a way that
some decrease in O3 formation is achieved while
increas-ing the radical production in the early stages of the exper-iment, which are particularly significant in determining the NO oxidation rate. However, the missing OH is calculated over the whole course of the experiment, and in general is higher for the MCMv3.1 simulations indicating an overall re-duction in oxidative capacity for this mechanism consistent with the reduced ozone formation potential. Note that for
the high NOxexperiment (25 September 2001) the simulated
O3value is higher for MCMv3.1 than MCMv3, but as
dis-cussed above, these simulations do not reach an O3peak in
the timeframe of the experiments. The higher radical produc-tion in the early stages of the MCMv3.1 simulaproduc-tion results in
a faster rise in O3and a higher O3concentration at the end
of the experiment in better agreement with the measurement, but still much lower than the observed peak. There is also a slight decrease in missing OH for this experiment as the simulation deals more with the early stages of toluene oxi-dation in which radical production is increased in MCMv3.1 compared to MCMv3.
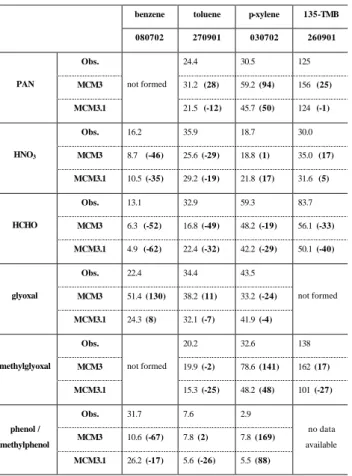
Table 7. Measures of model performance of MCMv3 and MCMv3.1 concerning some key species relating to the NOy
bud-get, radical sources and product branching ratios. For all species the peak values (in ppb) are taken irrespective of the time they oc-cur, and the figures in bold are the percentage difference between simulated and observed peak value, relative to the observed value.
38 Table 7 : Measures of model performance of MCMv3 and MCMv3.1 concerning some key species relating to the NOy budget, radical sources and product branching ratios. For all species the peak values (in ppb) are taken irrespective of the time they occur, and the figures in bold are the percentage difference between simulated and observed peak value, relative to the observed value.
benzene toluene p-xylene 135-TMB
080702 270901 030702 260901 Obs. 24.4 30.5 125 MCM3 31.2 (28) 59.2 (94) 156 (25) PAN MCM3.1 not formed 21.5 (-12) 45.7 (50) 124 (-1) Obs. 16.2 35.9 18.7 30.0 MCM3 8.7 (-46) 25.6 (-29) 18.8 (1) 35.0 (17) HNO3 MCM3.1 10.5 (-35) 29.2 (-19) 21.8 (17) 31.6 (5) Obs. 13.1 32.9 59.3 83.7 MCM3 6.3 (-52) 16.8 (-49) 48.2 (-19) 56.1 (-33) HCHO MCM3.1 4.9 (-62) 22.4 (-32) 42.2 (-29) 50.1 (-40) Obs. 22.4 34.4 43.5 MCM3 51.4 (130) 38.2 (11) 33.2 (-24) glyoxal MCM3.1 24.3 (8) 32.1 (-7) 41.9 (-4) not formed Obs. 20.2 32.6 138 MCM3 19.9 (-2) 78.6 (141) 162 (17) methylglyoxal MCM3.1 not formed 15.3 (-25) 48.2 (48) 101 (-27) Obs. 31.7 7.6 2.9 MCM3 10.6 (-67) 7.8 (2) 7.8 (169) phenol / methylphenol MCM3.1 26.2 (-17) 5.6 (-26) 5.5 (88) no data available
(4) p-xylene. The changes to the p-xylene mechanism are
very similar to those in toluene, and the simulated O3peak is
again lower for both experiments using the MCMv3.1 mech-anism, while the missing OH increases as the overall oxida-tive capacity is decreased. An example is shown in Fig. 6.
For the lower NOxexperiment (3 July 2002) the NO
oxida-tion rate is increased as for toluene, but unlike the toluene experiments where the NO oxidation rate is under-predicted, for this experiment MCMv3 slightly over-predicts the NO oxidation rate and the model-measurement discrepancy is
therefore larger for MCMv3.1. In the higher NOxp-xylene
experiment (18 July 2002) the MCMv3.1 simulated NO oxi-dation rate is lower than MCMv3 and slightly under-predicts the observed value, though it remains in reasonable agree-ment with it.
10 11 12 13 14 15 16 0 5 10 15 20 25 30 35 10 11 12 13 14 15 16 -5 0 5 10 15 20 25 30 35 40 10 11 12 13 14 15 16 0 10 20 30 40 50 10 11 12 13 14 15 16 0 2 4 6 8
Toluene - moderate NOx (27/09/01)
experiment MCMv3 MCMv3.1 HC HO [p p b ] Time [h] G lyo xa l [p p b ] Time [h] H N O 3 [p pb] Time [h] C res ol [p pb] Time [h]Fig. 8. Model-measurement comparison for HNO3, HCHO,
gly-oxal and cresol in toluene photosmog experiment of 27 September 2001.
4.2.3 Second group of key species: glyoxal,
methylgly-oxal, phenol, HCHO, HNO3, PAN
The second group of key species are those that deliver
im-portant information on the NOybudget, the HOxproduction
or the branching ratios for major reaction routes, and exam-ple model-measurement comparisons for some of these in a toluene experiment are shown in Fig. 8. The performance of MCMv3 and MCMv3.1 in simulating the concentrations
of glyoxal, methylglyoxal, phenol, HCHO, HNO3and PAN
in the aromatic experiments is summarised in terms of maxi-mum observed and simulated concentrations in Table 7. Only one experiment for each aromatic is listed to illustrate the general performance of the mechanisms; a full table is avail-able in the supplementary information.
(1) Glyoxal and methylglyoxal. These α-dicarbonyls are primary products of the aromatic ring-opening routes, and have been identified as important radical sources. In the latest version of the mechanism, MCMv3.1, primary gly-oxal yields based on the latest literature data (Volkamer et al., 2001) have been implemented and secondary production from the degradation of furanones, unsaturated γ -dicarbonyls and phenols has been reduced in line with the negligible secondary glyoxal yields observed experimentally. The simulated peak glyoxal concentration is in good agree-ment with the measureagree-ments. Primary methylglyoxal yields in MCMv3.1 have also been adjusted to maintain the ratio of glyoxal to methylglyoxal yield observed by (Smith et al., 1998, 1999), and the secondary yield has been reduced as for glyoxal. Model performance for methylglyoxal is not as good as for glyoxal but the simulated and observed peak con-centrations agree to within 50%.