HAL Id: hal-00301317
https://hal.archives-ouvertes.fr/hal-00301317
Submitted on 23 May 2006HAL is a multi-disciplinary open access
archive for the deposit and dissemination of sci-entific research documents, whether they are pub-lished or not. The documents may come from teaching and research institutions in France or abroad, or from public or private research centers.
L’archive ouverte pluridisciplinaire HAL, est destinée au dépôt et à la diffusion de documents scientifiques de niveau recherche, publiés ou non, émanant des établissements d’enseignement et de recherche français ou étrangers, des laboratoires publics ou privés.
Direct observations of the atmospheric processing of
Asian mineral dust
R. C. Sullivan, S. A. Guazzotti, D. A. Sodeman, K. A. Prather
To cite this version:
R. C. Sullivan, S. A. Guazzotti, D. A. Sodeman, K. A. Prather. Direct observations of the atmo-spheric processing of Asian mineral dust. Atmoatmo-spheric Chemistry and Physics Discussions, European Geosciences Union, 2006, 6 (3), pp.4109-4170. �hal-00301317�
ACPD
6, 4109–4170, 2006 Processing of Asian dust R. C. Sullivan et al. Title Page Abstract Introduction Conclusions References Tables Figures J I J I Back CloseFull Screen / Esc
Printer-friendly Version Interactive Discussion
EGU
Atmos. Chem. Phys. Discuss., 6, 4109–4170, 2006 www.atmos-chem-phys-discuss.net/6/4109/2006/ © Author(s) 2006. This work is licensed
under a Creative Commons License.
Atmospheric Chemistry and Physics Discussions
Direct observations of the atmospheric
processing of Asian mineral dust
R. C. Sullivan1, S. A. Guazzotti1, D. A. Sodeman1,*, and K. A. Prather1,2
1
Department of Chemistry & Biochemistry, University of California, San Diego, La Jolla, CA, 92093-0314, USA
2
Scripps Institution of Oceanography, University of California, San Diego, La Jolla, CA, 92093, USA
*
now at: Desert Research Institute, Reno, NV, USA, 89512
Received: 6 March 2006 – Accepted: 15 March 2006 – Published: 23 May 2006 Correspondence to: K. A. Prather ([email protected])
ACPD
6, 4109–4170, 2006 Processing of Asian dust R. C. Sullivan et al. Title Page Abstract Introduction Conclusions References Tables Figures J I J I Back CloseFull Screen / Esc
Printer-friendly Version Interactive Discussion
EGU
Abstract
The accumulation of secondary acid products and ammonium on individual min-eral dust particles during ACE-Asia has been measured in real-time using ATOFMS. Changes in the amounts of sulphate, nitrate, and chloride mixed with dust particles corresponded to different air mass source regions. During volcanically influenced
peri-5
ods, dust mixed with sulphate dominated. This rapidly switched to dust predominantly mixed with chloride when the first Asian dust front reached the R/V Ronald Brown. We hypothesise that the high degree of mixing of dust with chloride was caused by the prior reaction of NOy(g) and volcanic SO2(g) with sea salt particles, reducing the avail-ability of nitrate and sulphate precursors while releasing HCl(g), which then reacted
10
with the incoming dust front. The segregation of sulphate from nitrate and chloride in individual dust particles is demonstrated for the first time. This is likely caused by the dust plume encountering elevated SO2(g) in the Chinese interior before reaching coastal urban areas polluted by both SO2(g) and NOx(g). This caused the fractions of dust mixed with nitrate and/or chloride to be strongly dependent on the total dust
15
loadings, whereas dust mixed with sulphate did not show this same dust concentration dependence. Ammonium was also significantly mixed with dust and the amount cor-related strongly with the total amount of secondary acid reaction products in the dust. Submicron dust and ammonium sulphate were internally mixed, contrary to frequent statements that they exist as an external mixture. The size distribution of the mixing
20
state of dust with these secondary species validates previous models and mecha-nisms of the atmospheric processing of dust. The uptake of secondary acids was also dependent on the individual dust particle mineralogy; nitrate accumulated on calcium-rich dust while sulphate accumulated on aluminosilicate-calcium-rich dust. Oxidation of S(IV) to S(VI) by iron in the aluminosilicate-rich dust is a probable explanation for this result,
25
with important consequences for dust as a vector for the fertilization of remote oceans by soluble iron. This series of novel results has important implications for improving the treatment of dust in global chemistry models and highlights several key processes
ACPD
6, 4109–4170, 2006 Processing of Asian dust R. C. Sullivan et al. Title Page Abstract Introduction Conclusions References Tables Figures J I J I Back CloseFull Screen / Esc
Printer-friendly Version Interactive Discussion
EGU
requiring further investigation through laboratory and field studies.
1 Introduction
Major dust storm events typically develop in China in the spring, brought about by cold frontal systems and the Mongolian cyclonic depression (Sun et al., 2001). The Gobi Deserts in Mongolia and northern China, and the Taklimakan Desert in western
5
China, are the two dominant source regions of dust in east Asia. Once lofted to high altitudes, dust can then become entrained in the jet stream and may be transported long distances over the Pacific Ocean to North America (Cahill, 2003; Darmenova et al., 2005; Duce et al., 1980; Jaffe et al., 1999; Thulasiraman et al., 2002; VanCuren, 2003). The Asian Pacific Regional Aerosol Characterization Experiment (ACE-Asia) in
10
2001 was designed to study the impact of these spring dust events on the physical, chemical and radiative properties of the Asian aerosol as it was transported over the mainland and the Pacific Ocean (Huebert et al., 2003; Seinfeld et al., 2004).
Mineral dust represents the second largest component of primary particle emissions by mass, with an estimated global source strength of 1000 to 3000 Mt/yr (Ginoux et
15
al., 2001; Houghton et al., 2001). Laboratory studies have demonstrated the uptake of reactive gases including O3 (Chang et al., 2005; Hanisch and Crowley, 2003b; Michel et al., 2002; Sullivan et al., 2004; Usher et al., 2003b), NOx (Grassian, 2002; Hanisch and Crowley, 2003a; Saliba et al., 2001), NOy (e.g. HNO3, NO3, N2O5) (Frinak et al., 2004; Krueger et al., 2004; Seisel et al., 2004, 2005; Underwood et al., 2001), SO2
20
(Al-Hosney and Grassian, 2005; Ullerstam et al., 2003, 2002; Usher et al., 2002), and organics (Al-Hosney et al., 2005; Carlos-Cuellar et al., 2003) on dust particles (Gras-sian, 2001; Usher et al., 2003a). Dust particles present a large surface area for het-erogeneous reactions to occur on, and alter radiative transfer and rates of photolysis. Thus, dust influences the chemical composition of the troposphere, as demonstrated
25
by numerous field and modeling studies (Bauer et al., 2004; Bian and Zender, 2003; de Reus et al., 2000, 2005; Dentener et al., 1996; Seinfeld et al., 2004; Tang et al., 2004a;
ACPD
6, 4109–4170, 2006 Processing of Asian dust R. C. Sullivan et al. Title Page Abstract Introduction Conclusions References Tables Figures J I J I Back CloseFull Screen / Esc
Printer-friendly Version Interactive Discussion
EGU
Zhang and Carmichael, 1999). Mineral dust particles can become internally mixed with secondary species such as ammonium sulphate, ammonium nitrate, hydrochloric acid, sea salt and biomass burning particles through coagulation, cloud processing, and heterogeneous reactions (Andreae et al., 1986; Clarke et al., 2004; Guazzotti et al., 2001a; Korhonen et al., 2003; Mamane and Gottlieb, 1989; Mori et al., 1998; Song and
5
Carmichael, 1999; Wurzler et al., 2000; Yin et al., 2002; Zhang and Iwasaka, 2004; Zhang et al., 2003). These processes modify the chemical composition of the dust-laden aerosol and this can alter the radiative properties of the dust aerosol. The direct climate forcing of dust aerosol has a large reported range of −27.9 to 11.4 W cm−2; differences in dust mineralogy and the atmospheric processing discussed above lead
10
to these large uncertainties of the direct forcing (Houghton et al., 2001; Sokolik and Toon, 1996; Sokolik et al., 2001). The addition of water-soluble secondary species to a dust particle can alter its ability to act as a cloud or ice nucleus and thus influences the indirect climate forcing of dust (Cziczo et al., 2004; DeMott et al., 2003; Fan et al., 2004; Hung et al., 2003; Levin et al., 1996, 2005; Perry et al., 2004; Rudich et al., 2002;
15
Wurzler et al., 2000; Yin et al., 2002). Photochemical processes and the uptake of sec-ondary acids and organics can also increase the solubility and bioavailability of iron in dust particles, which is an important pathway for the fertilization of remote oceans with subsequent climate impacts (Bishop et al., 2002; Hand et al., 2004; Jickells et al., 2005; Meskhidze et al., 2005, 2003; Sarthou et al., 2003; Siefert et al., 1999; Turner
20
and Hunter, 2001; Zhu et al., 1992, 1997). Mineral dust mixed with nitrate is also an important vector for nitrogen fertilization of oceans (Baker et al., 2003; Prospero and Savoie, 1989).
Asian mineral dust particles at their original source location are primarily composed of mixtures of quartz, clays, micas, feldspars, carbonates (primarily calcite, CaCO3),
25
and other minor minerals (Gao and Anderson, 2001; Pye, 1987; Trochkine et al., 2003; Usher et al., 2003a; Yuan et al., 2004). The mineralogy of PM10collected during severe Asian dust events in 2000 and 2002 in Beijing was determined by Shi et al. (2005) to be primarily clay minerals (>40%), followed by noncrystalline materials and quartz
ACPD
6, 4109–4170, 2006 Processing of Asian dust R. C. Sullivan et al. Title Page Abstract Introduction Conclusions References Tables Figures J I J I Back CloseFull Screen / Esc
Printer-friendly Version Interactive Discussion
EGU
(both around 19%), with smaller amounts of calcite, plagioclase, K-feldspar, pyrite and other trace minerals. Surface measurements made in Beijing by Matsuki et al. (2005a) classified 28% of the Asian dust particles as calcite. The high carbonate fraction of Chinese dust is significant and this alkaline mineral has been shown to react readily with acidic species such as HNO3to form Ca(NO3)2and liberate CO2(g) (Hanisch and
5
Crowley, 2001; Johnson et al., 2005; Kelly and Wexler, 2005; Krueger et al., 2004; Laskin et al., 2005; Matsuki et al., 2005b; Song and Carmichael, 2001a).
In April 2001, a major dust storm event transported highly elevated levels of dust aerosol to the various ground, ship, and aircraft sampling platforms during ACE-Asia. The principal source regions of the dust during these events were the Taklimakan
10
desert in Xinjiang Province and the desert regions in Mongolia, including the Gobi desert (Gong et al., 2003). Previous analyses of the dust storm aerosol produced a number of interesting and unique results. As the mineral dust aerosol was transported over China, Korea, and Japan to the ocean, it became mixed with anthropogenic, vol-canic, and natural aerosols and aerosol precursor gases. When sampled onboard
15
the R/V Ronald H. Brown in the Sea of Japan, the resulting aerosol was a complex mixture of mineral dust, organic carbon, elemental carbon, sulphates, nitrates, ammo-nium, and sea salt (Arimoto et al., 2006; Bates et al., 2004; Seinfeld et al., 2004). The high dust loading shifted the partitioning of much of the soluble material (e.g. nitrates, sulphates, organics) to the coarse mode aerosol (Da>1.0 µm) from the
accu-20
mulation mode (Da0.1–1.0 µm), which decreased the soluble-ion content of the accu-mulation aerosol while negligibly changing the hygroscopicity of the coarse-dominated dust aerosol (Arimoto et al., 2006). Results obtained by an aerosol time-of-flight mass spectrometer (ATOFMS) revealed that prior to the dust front, the majority of super-micron particulate-nitrate was internally mixed with aged sea salt particles. After the
25
dust front, the particulate-nitrate was found predominantly internally mixed with mineral dust particles (Bates et al., 2004; Tang et al., 2004b). ATOFMS results further demon-strated the significant uptake of chlorine by mineral dust particles during the dust event
ACPD
6, 4109–4170, 2006 Processing of Asian dust R. C. Sullivan et al. Title Page Abstract Introduction Conclusions References Tables Figures J I J I Back CloseFull Screen / Esc
Printer-friendly Version Interactive Discussion
EGU
(Guazzotti et al., 20061).
The results presented here further investigate the chemical aging of the mineral dust particles as mixing occurs with trace gases, and natural and anthropogenic aerosols. Our analysis provides new insights into the competitive uptake of different secondary acids by mineral dust and the role that the varying mineralogy of dust plays in these
5
processes. These findings present yet another important dimension for models to con-sider when studying the atmospheric aging and radiative properties of mineral dust and further support the need to consider the importance of dust mineralogy (Krueger et al., 2004; Laskin et al., 2005; Matsuki et al., 2005a, b; Tang et al., 2004b).
2 Methods and instrumentation
10
A transportable aerosol time-of-flight mass spectrometer (ATOFMS) located on the R/V Ronald H. Brown (RHB) was used to help characterize the size and chemical compo-sition of individual particles in real-time during the ACE-Asia campaign. The RHB left Hawaii on 16 March 2001 (DOY 75) and spent 10 days in transit to Japan. From DOY 90–99 the RHB circled around the southern end of Japan and into the Sea of
15
Japan. On DOY 99 the RHB turned around and headed south out of the Sea of Japan through the Straits of Korea, finally docking at Yokosuka, Japan on DOY 110. More details on the RHB’s cruise track and the air masses it sampled are available in Bates et al. (2004).
The aerosol sampled by the ATOFMS was drawn through a 6 m sample mast from
20
∼18 m above sea level. The bottom 1.5 m of the mast was heated to maintain the relative humidity (RH) of the aerosol sample at 55±5%. Air was only sampled when the relative wind speed and direction, and concentrations of particles larger than 15 nm,
1
Guazzotti, S. A., Sullivan, R. C., Sodeman, D. A., Tang, Y. H., Carmichael, G. R., and Prather, K. A.: Mineral dust is a sink for chlorine in the marine boundary layer, Proc. Natl. Acad. Sci. USA, to be submitted, 2006.
ACPD
6, 4109–4170, 2006 Processing of Asian dust R. C. Sullivan et al. Title Page Abstract Introduction Conclusions References Tables Figures J I J I Back CloseFull Screen / Esc
Printer-friendly Version Interactive Discussion
EGU
indicated that the sampled air was free of local contamination (Bates et al., 2004). The design and operation of the ATOFMS is described in detail elsewhere (Gard et al., 1997) and only a brief description is given here. The ATOFMS draws the aerosol sample through a converging nozzle into a differentially pumped vacuum chamber, accelerating each particle to its terminal velocity. The velocity of each particle is
de-5
termined by the time-of-flight between two CW lasers. This velocity is converted to an aerodynamic diameter (Da) using a calibration curve generated with polystyrene latex spheres of discrete diameters. The particle’s velocity also triggers the firing of a frequency-quadrupled Nd:YAG laser (266 nm) that desorbs and ionizes chemicals from each sized particle. A dual reflectron TOF-MS records the mass spectra of the resulting
10
positive and negative ions simultaneously. The ATOFMS employed during ACE-Asia was capable of efficiently detecting particles between Da0.2 and 3.0 µm.
Analysis of the single-particle mass spectra was performed using the Matlab®based toolkit YAADA (http://www.yaada.org) to perform searches for particular mass spectral features within the dataset. An adaptive resonance theory-based neural network
al-15
gorithm, ART-2a, was used to group the data into clusters of particles with similar mass spectral features, using a vigilance factor of 0.80 (Song et al., 1999). Measure-ments made by the ATOFMS have previously been used to monitor heterogeneous reactions occurring in sea-salt, mineral dust, and secondary organic aerosols, as well as in cloud droplets, in real-time (Angelino et al., 2001; Bates et al., 2004; Gard et al.,
20
1998; Guazzotti et al., 20061; Sullivan and Prather, 2005; Tang et al., 2004b; Whiteaker and Prather, 2003).
A wide variety of mineral dust samples from Asian desert regions were collected in 2001. Mass spectra from each dust sample were obtained by placing each dust sample into a flask in a sonicator to create a suspension of dust particles under nitrogen gas
25
flow. The aerosol was then directed into the ATOFMS inlet for analysis and at least 2400 single-particle mass spectra were collected per sample.
ACPD
6, 4109–4170, 2006 Processing of Asian dust R. C. Sullivan et al. Title Page Abstract Introduction Conclusions References Tables Figures J I J I Back CloseFull Screen / Esc
Printer-friendly Version Interactive Discussion
EGU
3 Results
3.1 Mineral dust mass spectra
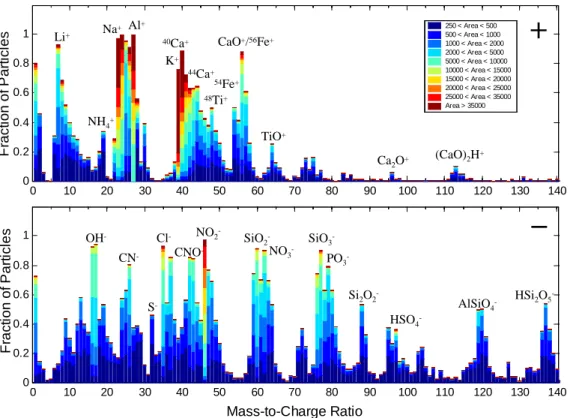
The average mass spectrum for filtered mineral dust particles detected during the dust storm frontal passage (DOY 100.8–101.3) is shown in Fig. 1. The height of each peak indicates the fraction of particles that each that ion was detected in while the colour
5
corresponds to the peak area range measured for that fraction of particles. Metals and metal oxides from minerals typical of dust particles are clearly evident in both the pos-itive and negative ion spectra and their peak assignments are listed in Table 1, based on previous ATOFMS measurements (Guazzotti et al., 2001a, b; Pastor et al., 2003; Silva et al., 2000). Clearly these Asian dust particles are a complex mixture of
numer-10
ous different minerals, as reported by previous studies (Andronova et al., 1993; Clarke et al., 2004; Gao and Anderson, 2001; Krueger et al., 2004; Pye, 1987; Trochkine et al., 2003; Usher et al., 2003a; Yuan et al., 2004).
The large fraction (>80%) of particles containing calcium marker ions (m/z+40, +56, +96) agrees with the high calcium carbonate fraction typical of Asian mineral dust.
15
Krueger et al. (2004) reported the chemical composition of China Loess determined by EDX to be 39% Ca, 31% Si, 13% Mg, 7% Al, 4% Na, 3% Fe, and 1% K (atomic percent). The Ca component was determined to be mostly from carbonate minerals including calcite (CaCO3) and dolomite (CaMg(CO3)2). The fraction of carbonate in Asian dust has been reported to range from 1–12% by mass (Andronova et al., 1993;
20
Derbyshire et al., 1998; Nishikawa et al., 2000; Tang et al., 2004b). Carbonate is an enigmatic anion in mass spectrometry and is difficult to detect directly using a variety of ionization methods, including LAMMA (Bruynseels and Van Grieken, 1983), static SIMS (Shaw et al., 2003), and LDI (Silva et al., 2000). The counter-cation plays an important role in the detection of carbonate cluster ions; cation clusters from Na2CO3
25
are readily created and detected but those from CaCO3are not. The carbonate anion, CO−23 , generally has a low abundance in the mass spectrum and is obscured by the
ACPD
6, 4109–4170, 2006 Processing of Asian dust R. C. Sullivan et al. Title Page Abstract Introduction Conclusions References Tables Figures J I J I Back CloseFull Screen / Esc
Printer-friendly Version Interactive Discussion
EGU
more abundant isobars [Si2O2]− and [AlO2H]− at m/z −60 in mineral particles. Thus, carbonate from calcite and dolomite cannot be directly determined using m/z −60. The presence of CaCO3can be reliably inferred from Ca-containing cations including
40
Ca+,56[CaO]+,96[Ca2O]+, and113[(CaO)2H]+. The56[CaO]+ cation is likely formed via [CaCO3]+→[CaO]++CO2.
5
The intensity of a particular ion measured by ATOFMS is a function of the ability of the chemical matrix to absorb and distribute 266 nm radiation to the chemical constituents of the particle, as well as the ionization energy or electron affinity of the individual species (Gross et al., 2000). Na and K, for example, have very low ionization energies and thus typically produce very intense ion signals relative to other elements. Thus,
10
the relative peak areas of various elements cannot be used to directly determine the relative amounts of different elements or compounds in a single-particle due to these varying sensitivities. If, however, the particle matrix is not changing significantly, as is the case for the Asian mineral dust particles discussed in this paper, then it is valid to compare the intensity of a particular peak from one particle to another and draw
15
conclusions about the relative amounts of that specific species present in each particle. The positive and in particular negative mass spectra also contain ions that corre-spond to ammonium, chloride, nitrate or sulphate. Table 1 lists these ions under “Sec-ondary Species”. The principal ions used throughout this paper to study each of these four secondary species are indicated by an asterisk (*) in Table 1. These peaks are
20
used as evidence of the accumulation of secondary species by mineral dust, discussed below. In the source dust samples, some of these species could be present as min-erals such as halite (NaCl) and gypsum (CaSO4). Asian dust particles collected near their source typically have very low concentrations of sulphate, nitrate and chloride (Andronova et al., 1993; Arimoto et al., 2004; Mori et al., 2003; Nishikawa et al., 1991;
25
Trochkine et al., 2003; Yuan et al., 2004; Zhang and Iwasaka, 1999).
Asian dust samples from various source regions were collected during ACE-Asia and analyzed by ATOFMS to create reference spectra of unprocessed dust. The spectra of source dust particles from regions such as Zhenbettai (Shaanxi Province, China),
Dun-ACPD
6, 4109–4170, 2006 Processing of Asian dust R. C. Sullivan et al. Title Page Abstract Introduction Conclusions References Tables Figures J I J I Back CloseFull Screen / Esc
Printer-friendly Version Interactive Discussion
EGU
huang (Gansu Province, China), and the CJ13 Certified Reference Asian Mineral Dust (Gansu Province, China) (Nishikawa et al., 2000) were collected (not shown) and com-pared to those of ambient mineral dust sampled during ACE-Asia, such as the spectra shown in Fig. 1. These represent likely sources of the mineral dust particles carried aloft from mainland China to the Sea of Japan during ACE-Asia (Gong et al., 2003).
5
Similarities between mineral cations and anions for both source and ambient dust par-ticles are readily evident. However, when compared to the ambient dust spectra, the source dust particles have much lower frequencies and ion intensities from secondary species such as ammonium, chloride, nitrate, and sulphate. Thus, the source dust spectra provide a benchmark for the very low background amounts of these species in
10
Asian dust and allow us to attribute increases in the peak areas and detection frequen-cies from these secondary spefrequen-cies to atmospheric processing during transport. 3.2 Filtering criteria
A total of 731 309 single-particle mass spectra were collected over the course of the campaign. From these 220 806 were classified as mineral dust particles after sorting
15
by the ART-2a clustering algorithm (Song et al., 1999), based on the source dust mass spectra discussed above and those presented in Silva et al. (2000) and Guazzotti et al. (2001a).
Particles produced by biomass burning typically produce intense39K+signals, in ad-dition to organic and elemental carbon fragments. The presence of large metal ion
20
peaks such as 39K+ can cause biomass particles to be incorrectly placed in mineral dust clusters by the ART-2a algorithm. To correct for this, the mineral dust particles sorted by ART-2a were further filtered using a peak area27Al+>5000 criteria to
elimi-nate incorrectly sorted biomass particles. The27Al+ criteria was chosen because Al is generally regarded as the most common single marker for mineral dust particles (Gao
25
and Anderson, 2001; Mori et al., 2003; Nishikawa et al., 1991; Usher et al., 2003a) and is readily detected in mineral dust by ATOFMS (Guazzotti et al., 2001a; Silva et al., 2000). From previous source studies, we have determined that biomass particles do
ACPD
6, 4109–4170, 2006 Processing of Asian dust R. C. Sullivan et al. Title Page Abstract Introduction Conclusions References Tables Figures J I J I Back CloseFull Screen / Esc
Printer-friendly Version Interactive Discussion
EGU
not produce peak areas >5000 at m/z 27 from27[C2H3]+ or other organic fragments. As dust particles are transported through the troposphere they can become internally mixed with other particle types such as sea salt, particularly via cloud processing if the dust aerosol passes through a cloudy region. Direct coagulation is also possible, but less likely, due to the slow diffusion times for these large particles. The fraction of
5
mineral dust particles internally mixed with sea salt has been reported to be as high as 85% after transport through marine regions (Andreae et al., 1986; Fan et al., 1996; Niimura et al., 1998; Zhang and Iwasaka, 2004; Zhang et al., 2003). The mixing of dust and sea salt will alter the chemical composition of the mineral dust by adding significant amounts of sodium, chloride, sulphate and other ions. If the sea salt particle
10
has already undergone heterogeneous aging by acids, then nitrate and non-sea-salt sulphate can also be incorporated into the mixed particle.
To focus only on the mixing of secondary acid products with mineral dust particles, the contributions of chloride, nitrate, and sulphate from internal mixing with sea salt must be excluded. Mineral dust particles that were internally mixed with sea salt were
15
queried using a peak area >100 units for81[Na352 Cl]+ criterion. The [Na2Cl]+ ion is an ideal marker for various particle types internally mixed with sea salt (Guazzotti et al., 2001a) that was not present in the Asian dust source spectra. The final set of properly-calibrated dust particles that satisfied both the27Al+>5000 and81[Na352 Cl]+<100 peak
area criteria will be herein referred to as “filtered dust particles”. Using this criterion,
20
the fraction of mineral dust particles internally mixed with sea salt was determined to be 15±9.5% on average over the course of the entire study. Before the dust front the fraction of dust particles internally mixed with sea salt was as high as 40% (Guazzotti et al., 2006)1. While this degree of mixing is lower than previous single-particle filter-based measurements in this region (Fan et al., 1996; Zhang et al., 2003), a high degree
25
of dust-sea salt mixing is typically caused by cloud processing. If the dust-laden air mass did not pass through a dense convective cloud system before reaching the RHB, this would explain the lower level of internal mixing. This may also be explained by the 0.2–3.0 µm particle size range measured by the ATOFMS. The mixing of a dust particle
ACPD
6, 4109–4170, 2006 Processing of Asian dust R. C. Sullivan et al. Title Page Abstract Introduction Conclusions References Tables Figures J I J I Back CloseFull Screen / Esc
Printer-friendly Version Interactive Discussion
EGU
with sea salt has been shown to increase the dust particle’s diameter by ∼0.4–0.8 µm (Zhang and Iwasaka, 2004) and the peak in the number-weighted size distribution of mixed dust and sea salt particles is typically near or above 3 µm (Zhang et al., 2003). During the ACE-Asia dust event, the coarse-mode volume distribution peaked at ∼4.0 µm (Bates et al., 2004), implying that a large fraction of the internally mixed dust
5
and sea-salt particles, if present, likely had diameters >3.0 µm and were therefore not detected by ATOFMS.
Over the course of the campaign, the RHB sampled air arriving from a wide vari-ety of source regions, as identified by Bates et al. (2004). We use the same source region classifications and time periods here. Mineral dust particles were commonly
10
detected during the pre-frontal Marine and Polluted Korea & Japan time periods in low concentrations. From DOY 99.3–100.5 (UTC) the RHB sampled air that had passed over the Miyakejima volcano and Japan and a distinct dust layer was observed at an altitude of 5 km (Polluted Volcano time period). A major dust storm reached the RHB on DOY 100.8 in the western Sea of Japan (Dust Front time period). Upper level
tra-15
jectories were from the north China/Mongolia desert region, while low-level trajectories extended across Korea and China. The passage of the front brought elevated lev-els of dust to the ship. The sub-10 µm dust concentrations reached 140 µm m−3 on DOY 102. From DOY 100 to 104 mineral dust composed 8–31% of submicron and up to 80% of supermicron mass (Arimoto et al., 2006). Dust continued to dominate the
20
aerosol behind the front and from DOY 101.8–103.4 both upper and lower level tra-jectories crossed Korea and north China/Mongolia (Dust & Korea time period). From DOY 103.4–104.5 the RHB was in the Korean Strait and sampling air that came out of north China/Mongolia and had passed over Shanghai (Dust & Shanghai time period). 3.3 Detection of secondary species in dust particles
25
Nitrate, sulphate, and chloride were the most commonly observed anions in the min-eral dust and correspond to the products expected from minmin-eral dust particles that have mixed with secondary acids, as well as acid anhydrides including N2O5, SO2,
ACPD
6, 4109–4170, 2006 Processing of Asian dust R. C. Sullivan et al. Title Page Abstract Introduction Conclusions References Tables Figures J I J I Back CloseFull Screen / Esc
Printer-friendly Version Interactive Discussion
EGU
NOx, etc. Although the exact mechanism that leads to the accumulation of these sec-ondary species cannot be determined from this data, the presence of chloride, nitrate, and sulphate on dust is most certainly due to the formation of hydrochloric, nitric, and sulphuric acids on the dust. This could be the result of reactive gases (e.g. SO2, NO2) adsorbing on the dust and then being oxidised to their acidic forms, or from the
di-5
rect uptake of acidic gases (e.g. HCl, HNO3, H2SO4) or their ammonium salts (e.g. NH4NO3, (NH4)2SO4). After the acid is formed/adsorbed on the dust, it can be fully or partially neutralised by alkaline species in the dust (e.g. CaCO3) or by alkaline gases (e.g. NH3). The ions formed from these secondary species with ATOFMS cannot di-rectly indicate if the species are acidic (i.e. protonated) or not. Therefore, we will refer
10
to them as “secondary acid products” or simply “secondary acids” throughout our dis-cussion, indicating that the chloride, nitrate, and sulphate found on the dust were most likely initially due to the formation/accumulation of secondary acids on the dust. The products of secondary species that reacted with mineral dust and other particle types are evaluated using the ions listed in Table 1. For this analysis chloride, nitrate, and
15
sulphate were primarily determined using peaks at m/z −35, −62 and −97, respec-tively. The peak at62[NO3]− is used instead of the46[NO2]− nitrate fragment because
m/z −62 is not detected in the Asian dust source spectra. Thus by using m/z −62 to
detect nitrate in dust, we preclude any significant contribution from nitrate (or nitrite) that is already present in the dust before it is injected into the atmosphere. Recall that
20
mixed dust-sea salt particles have also been filtered out.
The average mass spectrum for filtered mineral dust particles detected during the dust storm frontal passage (DOY 100.8–101.3) is shown in Fig. 1. Peaks typical of mineral dust particles discussed above and listed in Table 1 are clearly evident, and a large increase is observed in the fraction of particles producing ions indicative of
25
secondary acid products including m/z +30, −35, −46, −62, −80, and −97. These secondary species peaks were not significantly present in the source dust spectra. Changes in the relative amounts of four secondary species in the mineral dust particles are evaluated by averaging the peak area ratio for each species from all filtered dust
ACPD
6, 4109–4170, 2006 Processing of Asian dust R. C. Sullivan et al. Title Page Abstract Introduction Conclusions References Tables Figures J I J I Back CloseFull Screen / Esc
Printer-friendly Version Interactive Discussion
EGU
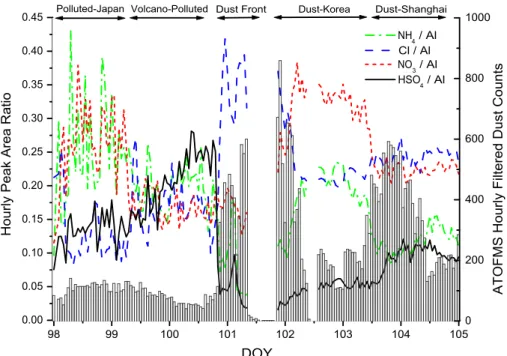
particles detected in one hour, as shown in Fig. 2 for DOY 98–105, encompassing the prefrontal and postfrontal time periods. The peak area for a particular m/z is divided by that particle’s peak area at m/z 27 (Al+) to account for shot-to-shot variations in the LDI laser power and the amount of laser energy absorbed by each particle (Guazzotti et al., 20061). The peak area ratio is evaluated for each individual particle before the
5
hourly average is calculated. Al was chosen as a stable dust marker because it is the most commonly detected species in mineral dust by ATOFMS and has been shown to remain stable as a function of particle size during atmospheric transport (Guazzotti et al., 2001a; Mori et al., 2003; Silva et al., 2000).
3.4 Temporal evolution of secondary species in Asian dust
10
The principal peak area ratios for four major secondary species, ammonium, chloride, nitrate, and sulphate are plotted in Fig. 2. Gaps in the data occurred when aerosol sampling was suspended due to instrument maintenance or when the aerosol inlet was shut off during ship exhaust contamination periods. The total hourly ATOFMS dust particle counts are also displayed and indicate when the first dust front reached the
15
RHB on DOY 100.8. Clear temporal changes in the relative amounts of the secondary species associated with the dust are evident.
To estimate the fraction of mineral dust particles internally mixed with chloride, ni-trate, or sulphate, a peak area criterion >5000 units for either 35Cl−, 62[NO3]− or
97
[HSO4]− was used to define a mineral dust particle as significantly mixed with one
20
of these secondary species. This peak area criterion was chosen because it is much larger than peak areas for these ions in the original Asian source dust and ensures that only mineral dust particles that have become significantly aged during transport will be selected. The mass fraction of each acid corresponding to a peak area of 5000 has not yet been determined and is the subject of ongoing laboratory studies. This peak area
25
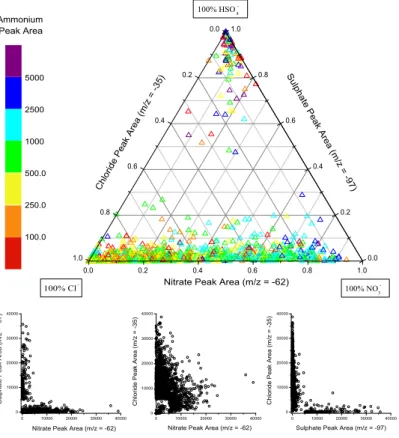
is relatively large and thus these results represent a conservative estimate of the de-gree to which mineral dust particles were internally mixed with nitrate, chloride, and/or sulphate. The results of this classification are shown in Fig. 3a for the prefrontal and
ACPD
6, 4109–4170, 2006 Processing of Asian dust R. C. Sullivan et al. Title Page Abstract Introduction Conclusions References Tables Figures J I J I Back CloseFull Screen / Esc
Printer-friendly Version Interactive Discussion
EGU
postfrontal periods. Large temporal changes in the fraction of reacted mineral dust particles are quite evident, similar to the temporal trends presented in Fig. 2. From DOY 98–105, the average (±1σ) fractions of dust particles mixed with nitrate, sulphate, or chloride were 25.9±9.6%, 17.5±8.5%, and 18.4±10.5, respectively. These results differ from those we presented in Arimoto et al. (2006). In that paper we used the same
5
criteria used here, but we did not exclude dust mixed with sea salt from the analysis so as to present a picture of the fraction of dust mixed with acids regardless of their source. Here we exclude dust internally mixed with sea salt to focus only on the role of secondary species, i.e. those produced in the atmosphere through chemical reactions. The scatter plot shown in Fig. 3b (right) plots the hourly counts of dust mixed with one
10
of the secondary species versus the total hourly dust counts measured by ATOFMS. Sulphate-dust has a very weak dependence on the total dust counts while nitrate-dust and chloride-dust have much stronger correlations over the DOY 98–105 time period. Thus, the mixing of dust with sulphate does not appear to be controlled by the total dust concentrations available, while the number of dust particles mixed with nitrate or
15
chloride increases with increasing total dust concentrations. 3.5 Mixing state of secondary acids
Nitrate-dust and sulphate-dust together accounted for 13 754 particles from DOY 98– 105, yet only 142 (1.03%) of these particles satisfied the peak area >5000 criterion for both62[NO3]− and 97[HSO4]−. Thus, significant amounts of both nitrate and sulphate
20
did not accumulate on the same mineral dust particles. Similarly, only 98 out of 12 272 (0.80%) chloride-dust and sulphate-dust particles satisfied the peak area criteria for both 35Cl− and 97HSO−4, demonstrating that secondary chloride and sulphate were also externally mixed in the mineral dust. Nitrate and chloride, however, were present in the same mineral dust particles to a large extent; 14.8% of chloride-dust and
nitrate-25
dust particles had peak areas >5000 for both35Cl−and62NO−3. Recall that dust mixed with sea salt was excluded from this analysis and thus cannot account for this result.
ACPD
6, 4109–4170, 2006 Processing of Asian dust R. C. Sullivan et al. Title Page Abstract Introduction Conclusions References Tables Figures J I J I Back CloseFull Screen / Esc
Printer-friendly Version Interactive Discussion
EGU
classified as mixed (i.e. having a peak area >5000 for m/z=−35, −62 or −97) during two time periods are shown in Fig. 4. In the ternary plot, a dust particle containing primarily sulphate would appear at the top vertex, primarily nitrate at the right vertex, and primarily chloride at the left vertex. Particles that contain equal mixtures of all three species would be located in the centre while particles containing mixtures of only two
5
of the acids would lie along one of the three axes. For both the Dust Front time period (Fig. 4a) and the pre-frontal Polluted Volcano time period (Fig. 4b), two broad groups of particles are evident in the ternary plots. The majority of particles lie along the bottom nitrate-chloride axis, indicating a wide range of internal mixing between nitrate and chloride in individual dust particles. A smaller but still substantial group of particles is
10
found at the top sulphate vertex, indicating that these dust particles contain primarily sulphate and relatively little nitrate or chloride. The lack of a significant number of particles lying along the sulphate-chloride or sulphate-nitrate vertices, or found in the centre of the ternary plot, further demonstrates that sulphate in aged mineral dust particles is externally mixed from both nitrate and chloride. The colour of each point
15
reflects that dust particle’s absolute peak area for ammonium. Particles with the largest ammonium signals were found in dust particles also associated with nitrate or sulphate while chloride-dust particles had lower but still significant amounts of ammonium. The ternary plots of dust particles detected during the Polluted Volcano and Dust Front time periods share these general features but there are more particles from the
sulphate-20
only group in the Polluted Volcano period and more in the nitrate-chloride group during the Dust Front period. This agrees with the temporal changes displayed in Figs. 2 and 3 that show a larger fraction of sulphate-dust before the dust front and a larger nitrate-dust and chloride-dust fraction during the dust storm.
This segregation of sulphate from nitrate and chloride is further demonstrated by
25
the scatter plots (bottom) in Fig. 4a for the Dust Front time period. The ternary plots show the relative partitioning of the absolute peak area signals for each dust particle between the three major secondary acid peaks. The scatter plots, however, show the absolute areas for a set of two secondary acids for the same set of mixed filtered dust
ACPD
6, 4109–4170, 2006 Processing of Asian dust R. C. Sullivan et al. Title Page Abstract Introduction Conclusions References Tables Figures J I J I Back CloseFull Screen / Esc
Printer-friendly Version Interactive Discussion
EGU
particles used to generate the ternary plot. The large number of particles found along either axis in the sulphate-nitrate and sulphate-chloride scatter plots agrees with the segregation of sulphate from nitrate and chloride shown in the ternary plot. The large number of particles found near the centre of the nitrate-chloride scatter plot, however, further supports the substantial and variable internal mixing of these two secondary
5
acids in the mineral dust. The reduced number of particles around the origin is caused by the peak area >5000 criterion for 35Cl−, 62NO−3, or 97HSO−4. Very similar results were also found for the Polluted Volcano time period (not shown).
3.6 Uptake of ammonia by acidified dust
Mineral dust that has accumulated secondary acids, as shown above, can be a sink for
10
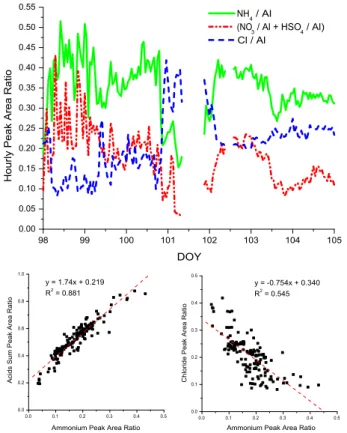
the principal alkaline gas in the atmosphere, ammonia. Figure 2 displays the NH4/Al peak area ratio that represents the presence of ammonium in dust. By visual inspection of Fig. 2, there is already a clear correlation between the ammonium peak area ratio and that of nitrate, and to a lesser extent sulphate, and a strong anti-correlation with chloride. This suggests a strong association of ammonium with nitrate and sulphate in
15
the aged mineral dust particles.
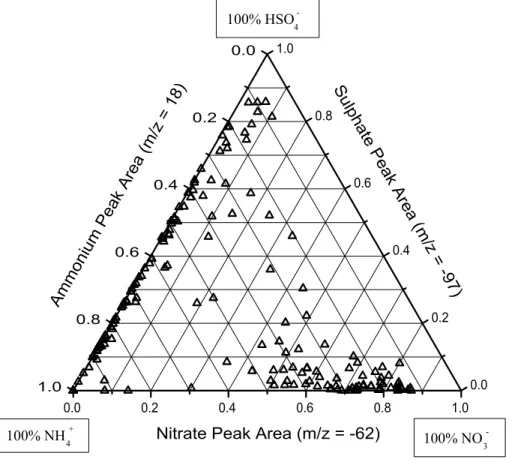
The presence of ammonium nitrate and/or ammonium sulphate in individual mineral dust particles is demonstrated in Fig. 5. The large cluster of particles lying along the ammonium-sulphate axis on the left indicates the presence of ammonium sulphate (AS) in mineral dust particles, while the smaller cluster of particles along the bottom
20
ammonium-nitrate axis represents ammonium nitrate (AN) in dust. The fact that these particles appear primarily along one of these two axes indicates that the AS- or AN-dust particles do not also contain a significant nitrate or sulphate signal, respectively. This is expected based on the external mixing of nitrate and sulphate in dust presented above. The much larger spread in the ammonium sulphate dust particles along the
25
ammonium-sulphate axis compared to the ammonium nitrate cluster may be due to the variable NH4:SO4 molar ratio caused by partitioning between (NH4)2SO4, NH4HSO4, and H2SO4, which is controlled by the thermodynamic chemical equilibrium between
ACPD
6, 4109–4170, 2006 Processing of Asian dust R. C. Sullivan et al. Title Page Abstract Introduction Conclusions References Tables Figures J I J I Back CloseFull Screen / Esc
Printer-friendly Version Interactive Discussion
EGU
the particle-phase and the gas-phase (Stelson et al., 1979; Zhang et al., 2002). Similar patterns were found for the other time periods (not shown) with the relative amounts of ammonium nitrate and ammonium sulphate dust particles changing in response to the abundance of nitrate-dust and sulphate-dust, as presented above (Fig. 3).
To investigate if ammonium was only associated with dust particles which also
con-5
tained nitrate, sulphate, or chloride, all filtered dust particles with a peak area >1000 for
18
[NH4]+ were queried, returning 8870 particles for DOY 98–105. 4208 of these were particles also mixed with nitrate, 1846 were in dust mixed with sulphate, and 1087 in dust mixed with chloride. Together dust mixed with one or more of the three acids accounted for 73% of the ammonium-containing dust. The remaining ammonium-dust
10
particles can be explained by having significant signals for chloride, nitrate, and sul-phate (i.e. peak area >1000) that did not exceed the 5000 peak area threshold. There were no indications in the average mass spectra that the ammonium was present in dust particles that did not also contain secondary acids to some extent. Therefore, ammonium was only found in dust particles that also contained acidic species such as
15
nitric, sulphuric, and, to a lesser extent, hydrochloric acids.
As it is expected that a particle must first contain some acidic species in order for am-monia to partition to it, we would predict that the number of dust particles that contained ammonium would increase when the number of particles containing nitrate or sulphate increased. This would also be true if the mixing of dust with ammonium was caused by
20
coagulation with or heterogeneous nucleation by ammonium nitrate/sulphate particles. This behaviour is shown in Fig. 6 for all filtered dust particles from DOY 98–105. A peak area >1000 for18[NH4]+was used to classify a particle as mixed with ammonium and this search was performed within the subset of filtered dust particles previously classified as mixed with nitrate, sulphate, or chloride (“reacted dust particles”). The
25
fraction of dust particles that contained ammonium tracked the temporal changes in the fractions of dust particles that were classified as mixed with either nitrate or sulphate above. The linear correlations between the hourly counts of dust that contained ammo-nium nitrate/sulphate and those that were mixed with nitrate/sulphate showed excellent
ACPD
6, 4109–4170, 2006 Processing of Asian dust R. C. Sullivan et al. Title Page Abstract Introduction Conclusions References Tables Figures J I J I Back CloseFull Screen / Esc
Printer-friendly Version Interactive Discussion
EGU
agreement with R2=0.808 and 0.814, respectively (Fig. 6 insets). This is an impressive degree of correlation considering that these queries were performed on all reacted dust particles, regardless of mineralogy, for seven days of ambient sampling which included several changes in the air mass source regions. The slopes of these cor-relations indicate the average fraction of nitrate-dust or sulphate-dust particles which
5
also contained ammonium over this time period were 43% and 32%, respectively. Note that the correlation for the AN-dust and nitrate-dust appears to have two slopes for un-known reasons. The temporal correlations of chloride-dust and dust mixed with both ammonium and chloride (not shown), thus containing ammonium chloride (AC), were not as significant as those for AS or AN. There were two time periods when AC-dust
10
was detected and these both occurred when chloride-dust dominated. The largest of these was from DOY 101.88–102.38 at the beginning of the Dust & Korea time period when chloride-dust was also elevated (Fig. 3). During this short 13-h period, 29.8% of the 1087 total AC-dust particles were detected. During the Dust & Shanghai time pe-riod, from DOY 103.0–105.0, 52.4% of the total AC-dust particles were detected during
15
this two day period. This coincided with a time when there were significant counts of chloride-, nitrate-, and sulphate-dust (Fig. 3). There were no significant counts of AC-dust during the first Dust Front time period (DOY 101) when the initial large increase in chloride-dust occurred.
Based on these observations the amount of ammonium in the dust particles would
20
also be expected to track the amount of nitric or sulphuric acid available in the aged dust particles. Taking the sum of the nitrate (m/z=−62/27) and sulphate (m/z=−97/27) hourly peak area ratios as a measure of the available acid in the dust and plotting this versus ammonium (m/z=18/27) in Fig. 7 reveals a strong temporal trend between the amount of acid in the dust and the amount of ammonium, as expected. Note the strong
25
anti-correlation of ammonium and the two other acids with chloride (m/z=−35/27) in the dust, particularly at DOY 101. However, from DOY 104–105 the peak area ratios for chloride, ammonium and the two acids all stabilize. The degree of correlation between the hourly peak area ratios for nitrate+ sulphate, and ammonium has a R2=0.574 (not
ACPD
6, 4109–4170, 2006 Processing of Asian dust R. C. Sullivan et al. Title Page Abstract Introduction Conclusions References Tables Figures J I J I Back CloseFull Screen / Esc
Printer-friendly Version Interactive Discussion
EGU
shown). If the sum of the peak area ratios for all three acids is plotted versus that for ammonium as in Fig. 7 (bottom left), then the R2is improved to 0.881. Considering that this correlation was evaluated for all the ambient filtered dust particles detected over seven days and a wide variety of air mass sources and that the different relative sensi-tivity factors for the various species have not yet been determined, this is an impressive
5
degree of correlation. There is also a strong anti-correlation between the peak area ra-tio of chloride and ammonium (bottom right) with R2=0.545. While including chloride in the sum of acid peak area ratios improved the overall correlation compared to just us-ing the sum of nitrate+ sulphate, chloride on its own is anti-correlated with ammonium in dust.
10
3.7 Effect of dust mineralogy on accumulation of secondary species
The role that dust particle mineralogy plays in its interactions with secondary acids and their precursors was investigated by comparing dust particles with significant Ca compared to dust with high amounts of Al. These types broadly represent dust particles rich in calcite or aluminosilicates, respectively. This was achieved by searching within
15
the filtered dust for particles with a relative peak area >10% for either27Al+ or40Ca+. Together these two types of dust accounted for 55.2±5.7% of the total filtered dust counts. Particles that were classified as both high in Ca and Al made up 9.4% of the total 19 400 high-Ca+ high-Al filtered dust particles. Clear differences between these two types of dust can be seen in the temporal changes of the hourly peak area ratios
20
for the three major secondary acid reaction products in Fig. 8. Most notable is a large spike in the sulphate area ratio at DOY 100.5 in the high-Al dust that does not occur in the high-Ca dust. The sulphate peak area ratio also increases from DOY 103.5–105 in the high-Al dust but remains mostly unchanged in the high-Ca dust. There are also noticeable differences in the increases in the chloride area ratio from DOY 101–102
25
for the two types of dust. The majority of chloride uptake during the Dust Front time period, beginning on DOY 100.8, took place on the high-Ca dust particles.
aluminosilicate-ACPD
6, 4109–4170, 2006 Processing of Asian dust R. C. Sullivan et al. Title Page Abstract Introduction Conclusions References Tables Figures J I J I Back CloseFull Screen / Esc
Printer-friendly Version Interactive Discussion
EGU
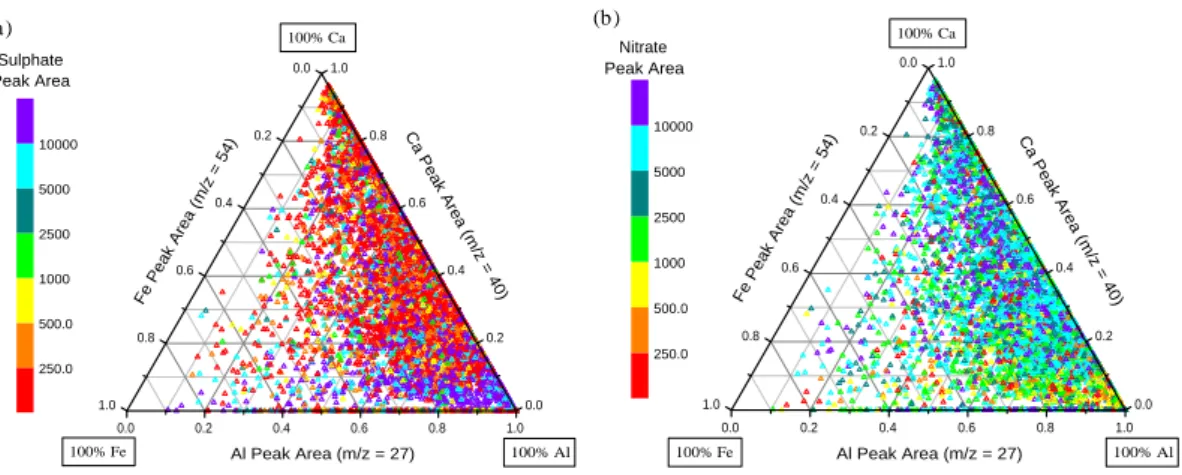
rich dust particles while nitrate and chloride are more associated with calcite-rich dust. Further evidence for this mineralogy dependence is given in Fig. 9. The ternary plot displays the relative distribution of three major dust mineral components: aluminium, calcium, and iron. The 54Fe isotope was selected for iron to avoid interference from
56
[CaO]+. Filtered dust particles that were significantly mixed with at least one of the
5
three secondary acids (i.e. peak area >5000) detected during the Dust & Shanghai time period are displayed in both Figs. 9a and b. In 9a, the symbol colour corresponds to the sulphate absolute peak area while in 9b, the colour corresponds to the nitrate absolute peak area. These two figures show dramatically different mixing behaviour for nitrate versus sulphate and are virtually complete opposites of each other, reflecting
10
the segregation of nitrate from sulphate in dust particles, as discussed above. The sulphate-rich dust particles predominantly lie near the aluminium vertex and extend to-wards the iron vertex, indicating an association with aluminosilicate-dust particles. The nitrate-dust particles are mostly located towards the calcium vertex, being associated with calcite-rich dust. The processes that cause this behaviour are discussed below.
15
4 Discussion of results
4.1 Accumulation of secondary species in mineral dust during transport
From DOY 98 to 105, a substantial, though highly variable fraction of mineral dust was mixed with the secondary species chloride, nitrate, or sulphate. Previous analyses of Asian mineral dust particles near their source show they typically have low
concentra-20
tions of nitrate, sulphate and chloride (Andronova et al., 1993; Arimoto et al., 2004; Matsuki et al., 2005a; Mori et al., 2003; Nishikawa et al., 1991; Trochkine et al., 2003; Yuan et al., 2004; Zhang and Iwasaka, 1999). Thus, we conclude that these mineral dust particles accumulated secondary acids as they were transported from the desert regions over the polluted mainland and marine regions to the RHB, by either direct
het-25
ACPD
6, 4109–4170, 2006 Processing of Asian dust R. C. Sullivan et al. Title Page Abstract Introduction Conclusions References Tables Figures J I J I Back CloseFull Screen / Esc
Printer-friendly Version Interactive Discussion
EGU
aerosols such as ammonium nitrate/sulphate particles. This is further confirmed by the temporal evolution of the relative amounts of the three acids in the dust, shown in Fig. 2. Just before the dust front, from DOY 100–100.8, there were elevated levels of both sulphate and ammonium corresponding to the Polluted Volcano air mass. From approximately DOY 100.8–102, the relative amount of chloride in the mineral dust
in-5
creased dramatically, coinciding with the arrival of the dust front, while the amount of ammonium simultaneously decreased. The amount of nitrate and ammonium both in-creased noticeably from DOY 102–103.5. Dividing the peak areas of these species by a stable dust component, aluminium, provides further evidence of a secondary source for these four species. If these compounds were present in the dust particles at the
10
source, we would expect their peak area ratios to remain constant as long as the dust source regions were not changing over short time periods. The fractions of dust mixed with secondary species (Fig. 3) show very similar temporal behaviour. There was a large increase in the fraction of dust mixed with sulphate on DOY 100.4 (Polluted Vol-cano time period), followed by a large increase in chloride-dust from DOY 100.8–101.3
15
(Dust Front time period). From DOY 102–103.5 (Dust & Korea time period), the fraction of nitrate-dust increased as chloride-dust decreased.
For some periods the changes in the fractions of dust mixed with one of the three secondary acids were reasonably well-correlated with another acid while at other times they were strongly anti-correlated. The degree to which the mineral dust became
in-20
ternally mixed with a particular acid is likely predominantly controlled by the air mass’s history, and the availability of acidic vapours and their precursors in these air masses that then became associated with the mineral dust.
4.2 Segregation of sulphate from nitrate and chloride
To the best of our knowledge, this is the first report of the segregation of sulphate
25
from nitrate and chloride in individual mineral dust particles that have experienced ex-tensive atmospheric aging and transport (Fig. 4). These results were presented in a truncated form in Arimoto et al. (2006). Murphy and Thomson (1997) reported the
ACPD
6, 4109–4170, 2006 Processing of Asian dust R. C. Sullivan et al. Title Page Abstract Introduction Conclusions References Tables Figures J I J I Back CloseFull Screen / Esc
Printer-friendly Version Interactive Discussion
EGU
external mixture of chloride and sulphate in individual ambient particles (not limited to dust) detected at Idaho Hill and also found that sulphate and nitrate were usually, but not always, found in separate particles. Zhang et al. (2000) detected coarse and fine mode single particles collected on filters in coastal China that were internally mixed with sulphate and nitrate. These particles also typically contained mineral elements
5
indicative of dust. Using similar methods, significant fractions of Asian dust particles collected in Japan were also found to contain both nitrate and sulphate (Zhang et al., 2003). In both these reports, the detection of nitrate and sulphate in each particle was purely qualitative and the detection limits for nitrate and sulphate on the coated collection substrates were 10−14 and 10−17g, respectively. Thus, a mineral dust
par-10
ticle containing a very small amount of nitrate and/or sulphate would be reported as internally mixed with nitrate and sulphate.
Figure 3b shows that the degree of mixing of sulphate with dust is not strongly depen-dent on the total dust concentrations. The degree of mixing of nitrate and chloride with dust, however, does depend on the dust concentrations. This suggests that sulphate
15
becomes preferentially mixed with dust, either because dust reacts with SO2/H2SO4 more efficiently, and/or because the dust plume encounters elevated sulphate precur-sors before encountering nitrate and chloride precurprecur-sors. If dust mixes with sulphate first and becomes acidified then, in general, nitrate and chloride will only be able to be-come significantly mixed with dust if there are elevated dust concentrations such that
20
there is an abundance of additional, mostly unreacted dust surface area available for reaction with nitrate and chloride precursors. There would therefore be a dependence on total dust loadings for nitrate- and chloride-dust, as shown in Fig. 3b.
Competition for the uptake of nitrate and sulphate by diesel exhaust particles was re-ported by Duran et al. (2003). They found that nitrate and sulphate were both present
25
in the bulk diesel aerosol when the aerosol surface area was high. When the available surface area was reduced during high load engine modes, sulphates were selectively adsorbed by the soot. This indicates that sulphate (from SO2oxidation) out-competes nitrate for adsorption onto soot particles. A similar competition may be occurring on
ACPD
6, 4109–4170, 2006 Processing of Asian dust R. C. Sullivan et al. Title Page Abstract Introduction Conclusions References Tables Figures J I J I Back CloseFull Screen / Esc
Printer-friendly Version Interactive Discussion
EGU
mineral dust particles. Clearly, the very different physical and chemical nature of min-eral dust and soot particles, in particular the alkalinity of Asian dust, must be consid-ered here. Ooki and Uematsu (2005) reacted dust particles collected in Japan with SO2, NO2, HNO3 and HCl vapours. They found that HNO3 reacted more efficiently than SO2, the opposite of what is shown herein and observed before, as discussed
5
above. The important role of oxidants such as O3for the oxidation of SO2to sulphate in their experiments was not discussed, however. Zhang et al. (2003) concluded that the formation of sulphate on Asian dust is more efficient than for nitrate based on a much greater abundance of dust particles that contained sulphate than nitrate. They attributed this to the greater concentrations of SO2 than NOx in East Asia and to the
10
non-volatile nature of sulphuric acid compared to the more volatile nitric acid; we dis-cuss both of these factors further below.
In addition to direct competition of SO2, NO2, HNO3, NOy, HCl, etc. for reaction with fresh dust surfaces, the differing availability (i.e. vapour concentrations) of these aerosol precursors must be considered. As previously discussed, Asian dust is
typ-15
ically generated in the interior and then transported to the east towards the Pacific Ocean. In general, the emissions of SO2 are greater than of NOx in east Asia. This difference is most pronounced in non-coastal areas due to SO2emissions from indus-trial activity and coal power plants (Akimoto and Narita, 1994; Song and Carmichael, 2001b; Streets et al., 2003; Tang et al., 2004b). The emissions of NOx are greatest
20
in the large urban areas near the coast, but still do not exceed those of SO2. Finally, the mixing ratios of HCl will be greatest in the polluted marine boundary layer primarily due to the release of HCl from acidified sea salt particles (Tang et al., 2004b). Thus it is reasonable to assume that mineral dust particles being transported eastward by a cold front first encounter elevated SO2, followed by coastal regions polluted with both
25
SO2and NOx, and finally elevated HCl once over marine areas. This causes sulphate to mix with dust first, before nitrate or chloride, and explains the weak dependence of sulphate-dust concentrations on the total dust loadings (Fig. 3b). This also explains why the formation of sulphate on dust had a higher affinity than for nitrate formation,
ACPD
6, 4109–4170, 2006 Processing of Asian dust R. C. Sullivan et al. Title Page Abstract Introduction Conclusions References Tables Figures J I J I Back CloseFull Screen / Esc
Printer-friendly Version Interactive Discussion
EGU
despite the report by Ooki and Uematsu (2005) that HNO3 reacts with dust more ef-ficiently than SO2 does. Changes in the emission inventories of Asia caused by the growing Chinese economy, as well as changes in technology and pollution controls, will likely alter this pattern of reactivity in the future.
4.3 Mechanism of secondary acid uptake: size dependence
5
In general, the accumulation of sulphate by particles through reaction with SO2/H2SO4 is diffusion limited. Thus, it occurs preferentially in the particle size mode with the great-est surface area, which is typically the accumulation mode (Da=0.1–1.0 µm) (Bassett and Seinfeld, 1984; Song and Carmichael, 1999). As sulphuric acid is essentially non-volatile and a stronger acid than both nitric or hydrochloric acid, the accumulation
10
of sulphuric acid in a particle will displace these two more-volatile acids back to the gas-phase. Nitric acid and hydrochloric acid in the gas-phase can then re-partition to supermicron dust particles that have not already been acidified by sulphuric acid and which represent a larger alkaline sink by mass for the uptake of these acids (Bassett and Seinfeld, 1984; Song and Carmichael, 1999, 2001a). Thus, the irreversible uptake
15
of SO2 and H2SO4is kinetically limited while the uptake of the more-volatile HCl and HNO3is thermodynamically controlled. The uptake of ammonia is typically determined by the preceding SO2/H2SO4uptake.
Evidence for this uptake mechanism occurring in the aged mineral dust detected during ACE-Asia is presented in the distribution of the peak areas for these secondary
20
species as a function of particle size in Fig. 10a. The average peak areas for sul-phate and ammonium clearly peak in the submicron filtered dust particles. Nitrate and chloride both peak in the supermicron dust particle mode. Despite the high loading of supermicron dust during the dust front, the largest aerosol surface area mode was still in the accumulation mode (Bates et al., 2004; Quinn et al., 2004). Similar results
25
are shown in Fig. 10b, this time plotting the fraction of filtered dust particles previously classified as mixed with chloride, nitrate, sulphate (peak area >5000), or ammonium (peak area >1000) as a function of size. Again, sulphate-dust peaks in the submicron
ACPD
6, 4109–4170, 2006 Processing of Asian dust R. C. Sullivan et al. Title Page Abstract Introduction Conclusions References Tables Figures J I J I Back CloseFull Screen / Esc
Printer-friendly Version Interactive Discussion
EGU
mode while nitrate- and chloride-dust peak in the supermicron. Ammonium-dust has two modes, the largest in the submicron mode along with sulphate-dust and a smaller one in the supermicron mode along with nitrate and chloride-dust. Taken together, these size plots indicate that ammonium accumulates in both the submicron sulphate-dust and the supermicron nitrate/chloride-sulphate-dust, but the relative amount of ammonium
5
per dust particle is greater in the submicron sulphate-dust mode.
Similar size-distributions of secondary species in Asian mineral dust have been re-ported previously from the analysis of collected filter samples and in modeling studies (Bates et al., 2004; Mori et al., 2003; Nishikawa et al., 1991; Ooki and Uematsu, 2005; Tang et al., 2004b; Wu and Okada, 1994; Zhang et al., 2000; Zhuang et al., 1999).
10
However, our results are the first to show the size distribution of secondary species exclusively for individual aged mineral dust particles. We also have the ability to ex-clude the influence of internally mixed dust and sea salt particles. The 0.10 µm size resolution provided by the ATOFMS measurements is another significant advantage over filter-based methods. Together these factors result in a unique and important set
15
of results that directly confirm aerosol model predictions of mineral dust aging mecha-nisms.
The displacement of nitrate and chloride caused by the uptake of SO2/H2SO4is one explanation for the segregation of sulphate in mineral dust from nitrate and chloride in dust presented earlier in Fig. 4. Mineral dust that has accumulated enough SO2/H2SO4
20
to neutralize any alkaline components of the dust (likely CaCO3) and acidify the particle will also prevent any further uptake of nitric or hydrochloric acids by that dust particle. If uptake of sulphate versus nitrate and chloride were a displacement process, numer-ous dust particles should appear between the 100% HSO−4 vertex and the 100% NO−3 or 100% Cl− vertex. Figure 4 clearly shows a lack of significant numbers of particles
25
in these areas, indicating that competitive uptake of sulphate and the earlier mixing of dust with sulphate precursors were the likely causes of this segregation, not displace-ment. The chemical mineralogy of dust also plays an important role in determining which acids will preferentially react with dust. Together these processes explain the
ACPD
6, 4109–4170, 2006 Processing of Asian dust R. C. Sullivan et al. Title Page Abstract Introduction Conclusions References Tables Figures J I J I Back CloseFull Screen / Esc
Printer-friendly Version Interactive Discussion
EGU
segregation of sulphate from nitrate and chloride in dust particles. The results sug-gest that the submicron dust particles were very acidic due to mixing with sulphuric acid. This prevented the substantial mixing of nitrate and chloride in the submicron dust particles. The internal mixing of nitrate and chloride is a result of the greater al-kaline mass in the supermicron dust that can neutralize both acids and allow them to
5
exist internally mixed to some degree in the same dust particle. The volatile nature of these two inorganic species allows them both to be displaced to the gas-phase, if this is occurring, and then re-partition back to the supermicron dust particles where they are less volatile. It is also possible that HNO3could displace the more volatile chloride from mineral dust as HCl(g), analogous to its displacement from sea salt particles. As
10
the uptake of HCl by mineral dust was only relatively recently reported (Guazzotti et al., 20061; Ooki and Uematsu, 2005; Zhang and Iwasaka, 2001), this chemistry has only recently been incorporated into some thermodynamic models of mineral dust aging. 4.4 Processes leading to the significant uptake of chloride by dust
As discussed by Guazzotti et al. (2006)1, the availability of HCl(g) for reaction with the
15
mineral dust was likely strongly influenced by the release of SO2(g) from the nearby Miyakejima volcano. Air masses sampled by the RHB showed a strong influence from the volcano from DOY 99–100.5 which corresponded to elevated [SO2(g)], just before the dust front arrived at DOY 100.8 (Bates et al., 2004). Coinciding with this, the ratio of SO−24 to NH+4 from filter measurements aboard the RHB showed elevated levels
20
of particulate sulphate before the dust front, during the Polluted Volcano time period. In addition, previously reported ATOFMS results demonstrated that prior to the dust front the majority of nitrate- and sulphate-containing particles were acidified sea salt (Bates et al., 2004; Tang et al., 2004b). All of these results indicate that the sea salt particles in the prefrontal air mass were highly aged and resulted in a depletion
25
of 77±12% of the total chloride available in the sea salt (Bates et al., 2004). Kajino et al. (2005) recently reported elevated concentrations of HCl(g) and HNO3(g) in east Asia caused by the emission of SO2(g) from the Miyakejima volcano and the displacement
![Fig. 3. Percentage of dust particles mixed with secondary acids. (a) Average hourly fraction (lines) of filtered dust particles defined as mixed with the indicated secondary acid product using the peak area>5000 criteria for 35 Cl − , 62 [NO 3 ] − or 97](https://thumb-eu.123doks.com/thumbv2/123doknet/14774213.592839/55.918.100.610.166.355/percentage-particles-secondary-average-fraction-particles-indicated-secondary.webp)