HAL Id: hal-00328076
https://hal.archives-ouvertes.fr/hal-00328076
Submitted on 8 May 2007HAL is a multi-disciplinary open access
archive for the deposit and dissemination of sci-entific research documents, whether they are pub-lished or not. The documents may come from teaching and research institutions in France or abroad, or from public or private research centers.
L’archive ouverte pluridisciplinaire HAL, est destinée au dépôt et à la diffusion de documents scientifiques de niveau recherche, publiés ou non, émanant des établissements d’enseignement et de recherche français ou étrangers, des laboratoires publics ou privés.
Climate impact of supersonic air traffic: an approach to
optimize a potential future supersonic fleet – results
from the EU-project SCENIC
V. Grewe, A. Stenke, M. Ponater, R. Sausen, G. Pitari, D. Iachetti, H.
Rogers, O. Dessens, J. Pyle, I.S.A. Isaksen, et al.
To cite this version:
V. Grewe, A. Stenke, M. Ponater, R. Sausen, G. Pitari, et al.. Climate impact of supersonic air traffic: an approach to optimize a potential future supersonic fleet – results from the EU-project SCENIC. Atmospheric Chemistry and Physics Discussions, European Geosciences Union, 2007, 7 (3), pp.6143-6187. �hal-00328076�
ACPD
7, 6143–6187, 2007Climate impact of supersonic air traffic
Grewe et al. Title Page Abstract Introduction Conclusions References Tables Figures ◭ ◮ ◭ ◮ Back Close
Full Screen / Esc
Printer-friendly Version
Interactive Discussion
EGU Atmos. Chem. Phys. Discuss., 7, 6143–6187, 2007
www.atmos-chem-phys-discuss.net/7/6143/2007/ © Author(s) 2007. This work is licensed
under a Creative Commons License.
Atmospheric Chemistry and Physics Discussions
Climate impact of supersonic air traffic:
an approach to optimize a potential future
supersonic fleet – results from the
EU-project SCENIC
V. Grewe1, A. Stenke1, M. Ponater1, R. Sausen1, G. Pitari2, D. Iachetti2,
H. Rogers3, O. Dessens3, J. Pyle3, I. S. A. Isaksen4, L. Gulstad4, O. A. Søvde4, C. Marizy5, and E. Pascuillo6
1
Institut f ¨ur Physik der Atmosph ¨are, DLR-Oberpfaffenhofen, Germany 2
Dipartimento di Fisica, Universita’ L’Aquila, Italy 3
Center of Atmospheric Science, Department of Chemistry, University of Cambridge, Cambridge, UK
4
Department of Geoscience, University of Oslo, Norway 5
AIRBUS, Toulouse, France 6
AIRBUS, Hamburg, Germany
Received: 5 April 2007 – Accepted: 11 April 2007 – Published: 8 May 2007 Correspondence to: V. Grewe ([email protected])
ACPD
7, 6143–6187, 2007Climate impact of supersonic air traffic
Grewe et al. Title Page Abstract Introduction Conclusions References Tables Figures ◭ ◮ ◭ ◮ Back Close
Full Screen / Esc
Printer-friendly Version
Interactive Discussion
EGU
Abstract
The demand for intercontinental transportation is increasing and people are requesting short travel times, which supersonic air transportation would enable. However, be-sides noise and sonic boom issues, which we are not referring to in this investigation, emissions from supersonic aircraft are known to alter the atmospheric composition, in 5
particular the ozone layer, and hence affect climate significantly more than subsonic aircraft. Here, we suggest a metric to quantitatively assess different options for super-sonic transport with regard to the potential destruction of the ozone layer and climate impacts. Options for fleet size, engine technology (nitrogen oxide emission level), cruis-ing speed, range, and cruiscruis-ing altitude, are analyzed, based on SCENIC emissions 10
scenarios for 2050, which underlay the requirements to be as realistic as possible in terms of e.g. economic markets and profitable market penetration. This methodology is based on a number of atmosphere-chemistry and climate models to reduce model dependencies. The model results differ significantly in terms of the response to a re-placement of subsonic aircraft by supersonic aircraft. However, model differences are 15
smaller when comparing the different options for a supersonic fleet. The base scenario, where supersonic aircraft get in service in 2015, a first fleet fully operational in 2025 and a second in 2050, lead in our simulations to a near surface temperature increase in 2050 of around 7 mK and with constant emissions afterwards to around 21 mK in 2100. The related total radiative forcing amounts to 22mWm2 in 2050, with an uncertainty 20
between 9 and 29mWm2. A reduced supersonic cruise altitude or speed (from March
2 to Mach 1.6) reduces both, climate impact and ozone destruction, by around 40%. An increase in the range of the supersonic aircraft leads to more emissions at lower latitudes since more routes to SE Asia are taken into account, which increases ozone depletion, but reduces climate impact compared to the base case.
ACPD
7, 6143–6187, 2007Climate impact of supersonic air traffic
Grewe et al. Title Page Abstract Introduction Conclusions References Tables Figures ◭ ◮ ◭ ◮ Back Close
Full Screen / Esc
Printer-friendly Version
Interactive Discussion
EGU
1 Introduction
The reduction of cruising time on inter-continental flights has a potential for a profitable economic market, if the gain in time is large enough to compensate for additional costs. This can only be achieved by increasing the speed significantly compared to present day subsonic aircraft, which usually fly at Mach 0.78 to 0.85 (830–900 km/h). Super-5
sonic cruising speed in the range of Mach 1.6 to Mach 2.0 (1700 km/h–2100 km/h) has the potential to pass this break-even-point. This implies cruising altitudes in the range of ≈14 km (45 000 ft) to ≈17 km (55 000 ft), so that those aircraft would fly deeply in the stratosphere, at least at mid and high latitudes.
Subsonic and supersonic aircraft emit a range of gases and particulate matter, 10
like carbon dioxide (CO2), water vapour (H2O), nitrogen oxides (NOx), and sulphate aerosols. Some of those, like NOx, significantly change the chemical composition of the atmosphere, producing or destroying ozone depending on the region of emis-sion, while water vapour and aerosols trigger contrails. (IPCC, 1999) estimated the climate impact contributions of those agents. They found that the partial replacement 15
of subsonic aircraft may lead to a climate impact in 2050 (in terms of radiative forcing), which is by about 50% higher than for the subsonic fleet. Recently, (Sausen et al., 2005) presented an updated version for the subsonic case, based on the results of the EU funded project TRADEOFF. They summarized that the total radiative forcing (RF) is smaller than previously estimated, because of a strongly reduced radiative forc-20
ing from line-shaped contrails compared to (IPCC, 1999). This is a consequence of crude assumptions on optical thickness, height, and background conditions (e.g. other clouds) in earlier estimates, which were refined recently. However, both (IPCC,1999) and (Sausen et al.,2005) pointed out that the radiative forcing of contrail-cirrus, which has not yet been included in the total RF because of a missing best estimate, may 25
potentially be very large and may increase the total RF by up to a factor of two. For supersonic aircraft most RF contributions are different from those of subsonic aircraft (IPCC,1999), since emitted species have longer residence times in the stratosphere
ACPD
7, 6143–6187, 2007Climate impact of supersonic air traffic
Grewe et al. Title Page Abstract Introduction Conclusions References Tables Figures ◭ ◮ ◭ ◮ Back Close
Full Screen / Esc
Printer-friendly Version
Interactive Discussion
EGU and play therefore a different role in the climate response to the aircraft emissions.
(IPCC,1999) identified water vapour emissions as the major contributor to a change in the RF from supersonic transport. Ozone changes, unlike to the subsonic case, lead to a negative RF, since emissions of nitrogen oxides in the stratosphere are leading to an enhanced ozone destruction via the catalytic NOx-ozone destruction cycle (Johnston, 5
1971;Crutzen,1971), and the ozone production via NO2photolysis is less important at higher altitudes.
The EU-project SCENIC (“Scenario of aircraft emissions and impact studies on at-mosphere and climate”) focused on the atmospheric impact of possible future fleets of supersonic aircraft. In this paper, we examine options for a future High Speed (super-10
sonic) Commercial Transport (HSCT) fleet and compare those mixed (sub- and super-sonic) scenarios with a subsonic only scenario by the means of a combination of two metrics: a climate change metric and an ozone destruction metric. The first HSCTs are assumed to be in service in 2015, reaching the whole fleet size of approximately 500 aircraft in 2025 and a second generation comes into service in 2050. The transport 15
demand, in terms of revenue passenger kilometres (RPK), is increasing. All scenarios include the assumption of a constant total number of transported passengers (RPKs) at a given time. The analysed options and uncertainties are: the emission index of NOx, fleet size, cruising speed, range, and cruising altitude.
The SCENIC emission database C. Marizy (personal communication, 2007), pro-20
duced by AIRBUS, differs significantly from previous emission datasets because of the applied methodology.
C. Marizy (personal communication, 2007) followed an approach, which is based on a detailed analysis of the potential market, including an analysis of the time savings, and a number of technical realizations. This implies that the options in reducing speed 25
and reducing height are not identical, though similar. And it also implies that all scenar-ios are optimized in terms of economical viability, which means that they are as realistic as possible.
ACPD
7, 6143–6187, 2007Climate impact of supersonic air traffic
Grewe et al. Title Page Abstract Introduction Conclusions References Tables Figures ◭ ◮ ◭ ◮ Back Close
Full Screen / Esc
Printer-friendly Version
Interactive Discussion
EGU describes the overall approach, including a description of the used model systems.
In Sect. 4 we present the impact of the potential HSCT fleet on the different climate agents, which is a summary of a number of companion papers (C. Marizy, personal communication, 2007; Søvde et al., 2007; Stenke et al., 20071, Pitari et al., 20072) and is thought to serve as an input and basis for the climate change calculation (Sect. 5c) 5
via an estimate of radiative forcing (Sect. 5a) and climate sensitivity (Sect. 5b). This also implies that a detailed discussion of the individual effects, e.g. on water vapour, ozone, contrails, etc. is given elsewhere. In order to reduce model dependencies, 4 chemistry-atmosphere models were applied, which give a range of uncertainty. Among those, only the ULAQ-CCM is capable to simulate the effect of black carbon and sul-10
phate aerosols, while only the ECHAM model is applied for estimates of contrail im-pacts. In Section 6 an optimization of a potential future supersonic fleet with respect to atmospheric perturbations is discussed, which is followed by a summary (Sect. 7).
2 Emissions
A detailed discussion of the SCENIC emission database is given in C. Marizy (personal 15
communication, 2007) here we focus on the main characteristics. Market forecasts for the 2050 world air traffic demand give the total number of passengers and the mass of freight that will be transported on each commercial route. The transportation is made either by a subsonic fleet composed of “representative” subsonic aircraft (scenario S4) or by a mixed fleet in which part of subsonic aircraft is replaced by one of five super-20
sonic configurations designed by European aircraft industry (base-case scenario S5 and perturbation scenarios P2 to P6). Each HSCT aircraft is designed to transport 250
1
Stenke, A., Fichter, C., Grewe, V., Pechtl, S., and Ponater, M.: Do supersonics avoid con-trails?, 2007.
2
Pitari, G., Iachetti, D., Mancini, E., Montanaro, V., Marizi, C., Dessens, O., Rogers, H., Pyle, J., Grewe, V., Stenke, A., and Søvde, A.: Radiative forcing from particle emissions by future supersonic aircraft, 2007.
ACPD
7, 6143–6187, 2007Climate impact of supersonic air traffic
Grewe et al. Title Page Abstract Introduction Conclusions References Tables Figures ◭ ◮ ◭ ◮ Back Close
Full Screen / Esc
Printer-friendly Version
Interactive Discussion
EGU passengers.
Main characteristics of these scenarios are given in Table 1. A supersonic route network is defined for each scenario from characteristics of the selected aircraft (speed, cruise, range, mass, engine combustor technology-level) and its flight performances. Economic criteria are also considered like flight frequency, time saved or distance flown 5
on these routes (cruise flights in supersonic mode being prohibited over land to avoid the sonic boom, modified trajectories are used to optimise the flight, which increases the distance flown on specific routes). For each route, a mean-level market penetration is defined to quantify the percentage of supersonic passengers and the number of supersonic aircraft needed to satisfy the demand. A higher-level market penetration 10
has also been used in scenario P3 (double fleet size) to evaluate the environmental impact of a more important demand for high-speed mean of transport. Optimised flight profiles integrating foreseen air traffic management improvements are used to calculate emissions produced by each aircraft on each route. The main results, which are given in Table1, underline the emission variations when varying supersonic parameters like 15
engine technology (P2), cruise speed (P4), maximal range (P5) and flight altitude (P6). The scenario P3 is included to test the sensitivity to the fleet size.
3 Methodology
In order to assess the environmental impact of a mixed subsonic/supersonic fleet and to compare different options for such a fleet, a metric is needed, which enables the 20
straightforward quantitative inter-comparison. Various approaches have been used and discussed with respect to perturbations, relevant for the total aircraft effect. The most prominent are the concepts of radiative forcing (e.g. IPCC, 1999, Sausen et al., 2005), global warming potential (GWP) (Johnson and Derwent,1996;IPCC,2001;Svensson et al., 2004) and near surface temperature change (Sausen and Schumann, 2000). 25
The merits and drawbacks of the RF concept have been widely analysed (e.g. IPCC, 1995, 1999; Fuglestvedt et al., 2003; Stuber et al., 2005; Hansen et al., 2005).
ACPD
7, 6143–6187, 2007Climate impact of supersonic air traffic
Grewe et al. Title Page Abstract Introduction Conclusions References Tables Figures ◭ ◮ ◭ ◮ Back Close
Full Screen / Esc
Printer-friendly Version
Interactive Discussion
EGU Although the forcing components can be calculated and compared in terms of RF
units, the corresponding impact on climate, i.e. temperature, may compare to a signif-icantly different result, depending on the specific nature of individual agents. Carbon dioxide has a long atmospheric lifetime in the order of decades, implying that an emis-sion taking place at a certain time affects climate for a long period and may give a 5
larger impact on temperature than agents with a short duration, but larger radiative forcing, e.g. contrails. The concept of the GWP tries to take this effect into account. However, it may largely depend on the chosen time horizon, and is therefore an am-biguous metric. We add that some of the RF caveats transfer to the GWP, for which RF is a key input parameter. Finally, it is extremely problematic to define a GWP for “air-10
craft NOx”, because it would depend on the chemical background, emission height and season (IPCC, 1999). For those reasons, in the present paper we concentrate on the potential near surface temperature change related to a scenario. This has the advan-tage that the specific nature of individual climate agents are taken into account via their efficacy. The calculation of the temperature change is based on a linearized climate 15
model (Sausen and Schumann,2000), which hereafter will be called linear response model (LR) AirClim.
Figure1gives an overview on the applied multi-step procedure. It first needs a time dependent (transient) emission scenario from which changes in the concentrations of various species are calculated, leading to an estimate of the adjusted radiative forcing 20
of each individual specie, or climate agents, and together with the innate climate sen-sitivity of that agent this directly relates to a time dependent temperature change by applying the LR AirClim.
3.1 Transient emission and concentration scenarios
To derive a temporal evolution of the subsonic aircraft CO2 emission, we start with a 25
reference scenario of 0.15 GtC in 1990 (taken from TRADEOFF, e.g. Sausen et al., 2005) and exponentially interpolate to 0.33 GtC in 2025 and 0.58 GtC in 2050 (S4; see also C. Marizy, personal communication, 2007). From that the perturbation scenarios
ACPD
7, 6143–6187, 2007Climate impact of supersonic air traffic
Grewe et al. Title Page Abstract Introduction Conclusions References Tables Figures ◭ ◮ ◭ ◮ Back Close
Full Screen / Esc
Printer-friendly Version
Interactive Discussion
EGU are introduced in 2015 (first in service of HSCT) interpolated to 2025 and 2050 in a
similar manner (Fig. 2a, d). Taking into account a turn around time of 50 years, the aircraft induced CO2concentration for each scenario can be derived (Fig.2b, e). Note, that this turn around time applies only for a perturbation of the background. The general lifetime of CO2is significantly larger. In general, a simple linearized approach, applying 5
a constant atmospheric decay time is insufficient to describe the CO2 concentrations. However, in this case, we only look at small changes between two scenarios, which do not change the background concentration significantly and which therefore allow a linearized approach. Emissions remain constant after 2050 for all scenarios.
3.2 Calculation of changes in concentration and contrail occurrence 10
Emissions of supersonic aircraft mainly perturb the radiative active gases water vapour, ozone, CO2, methane, and lead to changes in cloudiness (contrails). The concentration changes of water vapour and ozone are calculated using a set of three-dimensional global chemistry atmosphere models (2 chemical transport models, CTMs and 2 chemistry-climate models, CCMs). A brief description of the models is given in Ta-15
ble2. The two models SLIMCAT and Oslo-CTM2 use the same meteorological data and the same advection scheme (Prather, 1986) and E39/C a Lagrangian advection scheme (Stenke et al., 20073).
Multi-annual steady state simulations are performed for the time-slice 2050 (CTMs apply meteorological input fields for 1990 to 1999), excluding a spin-up time to take into 20
account accumulation effects. Since the simulations are quite resource demanding, only the scenarios S4, S5, and P4 were simulated by all models (see also Fig.8).
From these simulations the tropospheric OH change is derived to calculate changes in the tropospheric methane lifetime with an additionally off-set factor of 1.4 to take into account the underestimation of the near surface OH concentration due to fixed 25
3
Stenke, A., Grewe, V., and Ponater, M.: Lagrangian transport of water vapor and cloud water in the ECHAM4 GCM and its impact on the cold bias, J. Climate, under review, 2007.
ACPD
7, 6143–6187, 2007Climate impact of supersonic air traffic
Grewe et al. Title Page Abstract Introduction Conclusions References Tables Figures ◭ ◮ ◭ ◮ Back Close
Full Screen / Esc
Printer-friendly Version
Interactive Discussion
EGU methane boundary conditions (IPCC, 1999). The lifetime changes then directly
corre-spond to a change in the concentration.
These steady-state simulations result in the calculation of a concentration change of speciei for the time around 2050, from which a temporal development of the mean
stratospheric concentration change can be calculated, using a linearized approach: 5
d ∆Ci(t)
d t = ∆Ei(t) − τ
−1
i × ∆Ci(t), (1)
where ∆Ci(t) is the perturbation of a concentration and ∆Ei(t) the perturbation of
emissions of speciei with respect to the base case scenario (subsonic case) at time t0=1990. The stratospheric turn around-time for water vapour (τH2O) and NOy (τNOy) perturbations are by nature very close, since for both the main loss is the stratosphere-10
to-troposphere exchange. They can be determined from the steady state simulations:
τH2O= τNOy = τ =
∆Ci(t = 2050)
∆Ei(t = 2050)
(2)
For line-shaped contrails the coverage is estimated using the CCM E39/C, which in-cludes a parameterization of contrails (Ponater et al., 2002), based on the Schmidt-Appleman theory (Schmidt,1941;Appleman,1953). Contrails are handled as an indi-15
vidual cloud type and can occur simultaneously with natural cirrus. Optical properties (effective radii, emissivity and optical depth) are calculated using the equivalent rela-tions as for natural cirrus. The lifetime is assumed to be 30 min, i.e. one model time step. It has been shown that this methodology is able to realistically reproduce global patterns of contrail coverage and also seasonal and diurnal cycles (Marquart et al., 20
2003; Meyer et al.,2007). This scheme has also been used to estimate the impact of flight altitude changes of a conventional subsonic fleet on contrail coverage and RF (Fichter et al.,2005).
ACPD
7, 6143–6187, 2007Climate impact of supersonic air traffic
Grewe et al. Title Page Abstract Introduction Conclusions References Tables Figures ◭ ◮ ◭ ◮ Back Close
Full Screen / Esc
Printer-friendly Version
Interactive Discussion
EGU 3.3 Radiative forcing
Based on the simulated changes in the concentration of the various species the change of radiative forcing is calculated. For water vapour and ozone, multi-annual monthly mean three-dimensional change patterns are derived from CTM and CCM output. These changes are then introduced into the climate model E39 (Land et al., 1999) 5
for a dedicated calculation of the stratosphere adjusted radiative forcing (for techni-cal details see Stuber et al., 2001). A three months spin-up is taken into account for adjustment of the stratosphere and a one year simulation is evaluated.
For CO2, a more simple methodology is applicable, because the changes of the concentration are small compared to the background and, more important, CO2 is a 10
well-mixed greenhouse gas and the radiative forcing is independent from the place of emission. The differential radiative forcing is estimated to decrease from 1990 to 2050 from 18m2mWppmv to 12m2mWppmv (IPCC, 1999). For methane, the calculated change in its tropospheric life-time directly relates to the change in the concentration and in the radiative forcing. As a reference 470mWm2 are taken into account for 1990.
15
The radiative forcing of contrails, for which the co-occurrence with natural clouds is essential, is calculated on-line during CCM simulation according to the method of ( Stu-ber et al.,2001). Following the outcome of the validation study by (Marquart and Mayer, 2002), the global longwave RF is posteriori enhanced by an offset of 25% to reach best estimates of the net RF that account for the neglection of longwave scattering in the 20
CCM’s radiation scheme.
3.4 Climate change and climate sensitivity
From the radiative forcing the change in the global mean near surface temperature can be approximated based on the relationship:
∆Teq= λ × RF , (3)
25
where ∆Teqdenotes the equilibrium change in near surface temperature,λ the climate
ACPD
7, 6143–6187, 2007Climate impact of supersonic air traffic
Grewe et al. Title Page Abstract Introduction Conclusions References Tables Figures ◭ ◮ ◭ ◮ Back Close
Full Screen / Esc
Printer-friendly Version
Interactive Discussion
EGU greenhouse gas concentration or contrails. It has been common to assume (e.g. IPCC,
1995) that this relationship is valid with constantλ for all forcing agents from experience
gained with model experiments using changes of well-mixed greenhouse gases or so-lar constant changes (Manabe and Wetherald, 1975;Wetherald and Manabe,1975). However, aircraft related climate perturbations are basically non-homogeneous. Here 5
we take into account more recent results which indicate that the differential efficacy of such perturbations requires the use of individual climate sensitivity parameters λi
(Hansen et al.,1997,2005;Joshi et al.,2003;Ponater et al.,2005).
The values ofλi have to be determined by applying the atmosphere-ocean model E39/MLO in multi-decadal simulations (Ponater et al., 2005, 2006), generally using 10
stronger perturbations than those produced by aircraft. For our study we refer to sim-ulations with either idealized perturbations, e.g. in the upper troposphere, or northern hemisphere only, or to more realistic simulations, i.e. for ozone changes from subsonic aircraft. We also recall that beyond its dependency on the nature of the forcing agent,
λi also displays a distinct model dependency (Cess et al., 1989; IPCC,2001), while 15
the efficacy λi/λCO2 is much less variable among different models (Joshi et al.,2003). As mentioned above we will use ∆T as a metric of climate change in this paper and apply the methodology described in (Sausen and Schumann,2000), extended by the introduction of individual efficacy values into their Eq. (8). The basic relations are thus:
∆T (t) = t Z t0 GT(t − t′) × RF∗(t′)d t′, with (4) 20 GT(t − t′) = α T× e −t−t′τT , (5) with αT = 2.246/36.8 K yr and τT = 36.8 yr,
ACPD
7, 6143–6187, 2007Climate impact of supersonic air traffic
Grewe et al. Title Page Abstract Introduction Conclusions References Tables Figures ◭ ◮ ◭ ◮ Back Close
Full Screen / Esc
Printer-friendly Version Interactive Discussion EGU RF∗(t) = X all speciesi RFi2050 RFCO2050 2 × λi λCO2 × ∆Ci(t) ∆Ci(2050) . (6)
∆T describes the perturbation temperature with respect to the base case, GT the
Green’s function for the near surface temperature response and RF∗ the normalized radiative forcing. Because of the small changes in the concentration, especially for CO2, saturation effects are omitted, different to the approach by (Sausen and Schu-5
mann,2000). RFCO2050
2 andλCO2 are specific values for CO2, whereasRF
2050
i andλi are
different for the respective climate agents (water vapour, ozone, methane, contrails). Except for the contrail case ∆Ci(t) represents the concentration perturbation of agent
i, while for contrails the fuel consumption perturbation is used to describe the temporal
change. 10
4 Impact of HSCT emissions on atmospheric composition
For the estimate of the radiative forcing resulting from various emissions, the concen-tration change of the climate agents is calculated based on the methodology described above (see also Fig.1).
4.1 Carbon dioxide 15
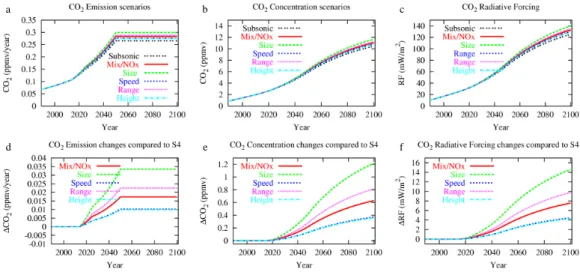
Figure2shows the development of the global emissions (a, d) and resulting concentra-tion (b, e) of CO2for the individual scenarios and the change due to the replacement by supersonic aircraft, respectively. Clearly, the long atmospheric lifetime of CO2prevents a convergence of the CO2 concentration towards equilibrium even 50 years after the emissions are kept constant. In the year 2100, the concentration of HSCT emitted CO2 20
is doubled for a doubled fleet (P3), and about 45% reduced in the cases of a lower speed (P4) and lower flight altitude (P6). An increase in the CO2concentration of 30%
ACPD
7, 6143–6187, 2007Climate impact of supersonic air traffic
Grewe et al. Title Page Abstract Introduction Conclusions References Tables Figures ◭ ◮ ◭ ◮ Back Close
Full Screen / Esc
Printer-friendly Version
Interactive Discussion
EGU to 35% is found for the long range flights (P5) compared to the standard mixed fleet
(S5).
4.2 Water vapour
Figure 3 shows the simulated equilibrium perturbations (i.e. mixed fleet ’S5’ minus subsonic only “S4”) for water vapour. Maximum perturbations occur at similar regions 5
in all models, with different absolute values, though. Table3gives a characterization of the perturbation pattern in the various models. The total stratospheric mass of water vapour, which results from HSCT emissions ranges between 45 and 98 Tg, which is a factor of two. The lifetime of the water vapour perturbation (Eq. 2) ranges from 13 to 29 months. Those numbers must not be mixed up with the stratospheric age of air 10
(Hall and Plumb, 1994) which reflects the mean lifetime of an air parcel entering the stratosphere in the tropics. The HSCT emissions are located much closer to regions of strong exchange into the troposphere (e.g. Holton et al., 1995) so that the lifetime has to be smaller than the stratospheric age of air.
The inter-hemispheric ratio of the water vapour perturbation, i.e. the ratio of the 15
northern hemisphere to southern hemisphere water vapour increase, is most pro-nounced in the OsloCTM2 model and the less in the SLIMCAT model. That implies that the tropics are a stronger barrier to transport in the OsloCTM2 model than in the SLIMCAT model. This may partly arise from the lower upper boundary condition in the OsloCTM2 model, which may inhibit long-range transport in the middle-world.
20
The pattern of the perturbation is very similar in all other scenarios (not shown), ex-cept for a shift in altitude of the maximum water vapour perturbation P4 (lower speed) and P6 (lower flight altitude). This implies a reduction of the total water vapour pertur-bation ranging between 19% (SLIMCAT) and 57% (ULAQ), with a mean value of about –40% (Table 3). This reduction is a consequence of two factors: A reduced HSCT 25
fuel consumption (33%, Table 1) and a reduced lifetime of the perturbation (–10%, Table3), caused by the lower emission height. The water vapour perturbation has a smaller chance to be transported into the Southern Hemisphere, because the emission
ACPD
7, 6143–6187, 2007Climate impact of supersonic air traffic
Grewe et al. Title Page Abstract Introduction Conclusions References Tables Figures ◭ ◮ ◭ ◮ Back Close
Full Screen / Esc
Printer-friendly Version
Interactive Discussion
EGU height is reduced, which increases the inter-hemispheric contrast by 7%, with a model
range of 0.5% (SLIMCAT) to 11% (E39/C, ULAQ). 4.3 Ozone
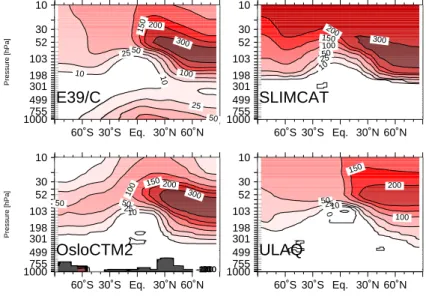
The equilibrium response of ozone caused by NOxand H2O HSCT emissions is shown in Fig.4. All models indicate an ozone decrease which is found at higher altitudes in 5
lower than in higher latitudes, reflecting the Brewer-Dobson circulation with its rising branch in the tropics. The absolute ozone losses differ remarkably (Table 4) ranging from 1 to 16 Tg. Some models also show an ozone increase below the domain of ozone depletion.
The patterns also differ in terms of inter-hemispheric differences. All models show 10
larger ozone losses on the northern hemisphere than southern hemisphere (mean NH to SH perturbation ratio: 1.7). The OsloCTM2 model shows ozone changes, which are more confined to the northern hemisphere than in the other models (ratio: 2.5, Table4), which is in agreement with results for water vapour.
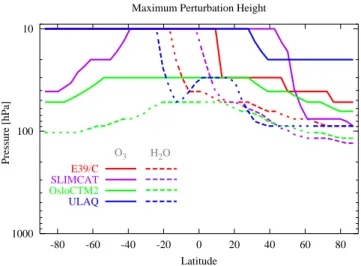
Figure5compares the altitude of the maximum perturbation in water vapour (dashed 15
line) and the maximum ozone loss (solid line) for the four models. Clearly, the North-ern Hemisphere maximum water vapour perturbation is located at similar heights in all models, indicating a maximum perturbation near the HSCT emisison region. How-ever, the transport to the Southern Hemisphere is very differently simulated, leading to maximum changes between 10 and 50 hPa.
20
Nitrogen oxides emitted by HSCTs experience the same transport characteristics as water vapour, which leads to differenty simulated impacts in ozone perturbations among the models. To some extend, the maximum ozone perturbation line is parallel to the maximum water vapour perturbation, but shifted to higher altitudes. This is a consequence of the interaction of chemistry and transport. The NOx-destruction cycle 25
of ozone has an increasing efficiency with height (chemistry) and the NOy changes are comparable to the H2O changes, i.e. varying among the models (transport). Fur-thermore, the ozone concentration is more dynamically controlled at lower altitudes
ACPD
7, 6143–6187, 2007Climate impact of supersonic air traffic
Grewe et al. Title Page Abstract Introduction Conclusions References Tables Figures ◭ ◮ ◭ ◮ Back Close
Full Screen / Esc
Printer-friendly Version
Interactive Discussion
EGU and changes to a more chemically controlled regime at higher altitudes. Differences
between the models occur at the Southern Hemisphere, where ozone changes from higher altitudes are effectively transported downwards. Since the OsloCTM2 model shows the maximum water vapour perturbation at the lowest altitude, the ozone im-pact on the Southern Hemisphere is the less among all models, leading to a larger 5
inter-hemispheric contrast (Table 4). The SLIMCAT, E39/C and ULAQ models show larger tropical water vapour perturbations at 10 hPa with around 250 ppbv, 100 ppbv, and 100 ppbv, respectively (Fig.3) than the OsloCTM2 model. Consequently also the NOy and NOx perturbations are larger in those models leading to a maximum in the ozone perturbation in the tropical region, which show in all 3 models a ratio of the H2O 10
to ozone perturbation of 5:1. Hence absolute changes differ but not the ratio of the NOy to ozone perturbation. This indicates that chemistry shows a comparable response but transport differs significantly among the models.
The decrease of speed of the HSCT fleet (P4) reduces the loss of ozone by ap-proximately 35%, ranging between 5 and 60% (Table4). The mean ozone mass is 15
increasing considerably. 4.4 Methane
The change of ozone and water vapour in the stratosphere and troposphere leads also to a change of the tropospheric ozone and OH concentration. This reduces the methane lifetime between 0.01% (ULAQ) and 0.44% (E39/C). Most likely two effects 20
are leading to the simulated decrease in methane lifetime. The models E39/C and ULAQ simulate an increase in ozone in the troposphere, which directly leads to an increase in OH. Further, a decrease in total ozone column increases the UV-flux into the tropsophere where it increases the chemical activity (Taalas et al.,1997;Isaksen et al., 2005; Grewe, 2007). The models E39/C and OsloCTM2 simulate a stronger 25
decrease in total ozone column than the ULAQ model, which most likely also leads to stronger OH increases, which is consistent with the calculated methane lifetime changes.
ACPD
7, 6143–6187, 2007Climate impact of supersonic air traffic
Grewe et al. Title Page Abstract Introduction Conclusions References Tables Figures ◭ ◮ ◭ ◮ Back Close
Full Screen / Esc
Printer-friendly Version
Interactive Discussion
EGU 4.5 Contrails
The change in contrail coverage of a mixed fleet (S5) compared to the subsonic fleet (S4) is presented in Fig. 6 as simulated by E39. In the Northern Hemisphere upper troposphere lower stratosphere region, contrail coverage is reduced, because of the substituted subsonic aircraft. Small increases are simulated at around 150 hPa and 5
250 hPa, which are related to supersonic aircraft flying over land at subsonic speed, e.g. between 9 km and 13 km, but at different altitudes than the replaced subsonic aircraft. In the tropics, the tropopause is located at a much higher altitude, implying that the air is humid enough at supersonic cruise altitude to allow contrail formation. The global contrail coverage is reduced by only 1.6%, i.e. from 0.3752% to 0.3692%, 10
because the tropical increase almost compensates the contrail reduction at higher lati-tudes.
Flying at lower speed (P4) also induces compensating effects. Especially in the trop-ics, the contrail coverage is basically shifted in altitude. The global contrail coverage is reduced by 1.8%, i.e. from 0.3752% to 0.3686%, compared to the subsonic fleet (S4). 15
Although the vertical and horizontal pattern of the contrail coverage changes signifi-cantly in the scenarios S4, S5 and P4, the global contrail coverage is only little affected (Stenke et al., 20071).
4.6 Particles
The ULAQ model, which includes an aerosol module, has been used to calculate the 20
differences in aerosol particle size and mass (black carbon and sulphate aerosols) pro-duced by future supersonic aircraft. The effect of supersonic aircraft sulphur emission is to greatly increase the number of ultrafine particles; in addition, an enhanced ac-cumulation mode is produced by the additional sulphur dioxide released on the large atmospheric scales, becoming available for sulphuric acid production after oxidation. 25
The large increase in the ultrafine particle mode is expected to have a significant im-pact in the total particle surface area density available for heterogeneous chemical
ACPD
7, 6143–6187, 2007Climate impact of supersonic air traffic
Grewe et al. Title Page Abstract Introduction Conclusions References Tables Figures ◭ ◮ ◭ ◮ Back Close
Full Screen / Esc
Printer-friendly Version
Interactive Discussion
EGU reactions, while the perturbation in the accumulation mode is important for the solar
radiation scattering and climate forcing. It is important to note that aviation aerosols may also affect climate indirectly, via ozone changes produced by the enhanced het-erogeneous chemistry (see Pitari et al., 2002b), which is not taken into account in this study.
5
The total atmospheric mass of black carbon and sulphate aerosols are increased by almost 8×10⁵kg and 27×106kg (Table 5). The perturbation scenarios are in line with the results for water vapour perturbations. The perturbation of the global mean stratospheric water vapour by a mixed fleet (S5–S4) is reduced by 57% when lowering the supersonic cruising speed (P4) in the ULAQ model. This value is close to respective 10
changes in BC and SO4perturbations of –60% and –52%, respectively.
5 Climate change
5.1 Radiative forcing
Based on the CCM and CTM calculations for water vapour and ozone, the stratospheric adjusted radiative forcing has been calculated for the various cases. Table6 summa-15
rizes all RF results for the base case, i.e. the replacement of the subsonic aircraft by supersonic (S5–S4). They are derived with a set of models for some species (water vapour, ozone, methane), for others (contrails, aerosols: black carbon and sulphate aerosols) with one model only. Since the supersonic aircraft consume more fuel per passenger kilometer, the RF increase associated with CO2amounts to around 3mWm2 in 20
2050.
Clearly, water vapour is the most important climate agent with respect to supersonic transport with values between 15 and 35mWm2 in 2050 and a mean value of 23mWm2 . The variability can partly be explained by the variability in the differently simulated total water vapour increase: The OsloCTM2, ULAQ and SLIMCAT model show a similar re-25
ACPD
7, 6143–6187, 2007Climate impact of supersonic air traffic
Grewe et al. Title Page Abstract Introduction Conclusions References Tables Figures ◭ ◮ ◭ ◮ Back Close
Full Screen / Esc
Printer-friendly Version
Interactive Discussion
EGU This lower value very likely results from the higher water vapour background in the
E39/C model, leading to saturation effects (Forster et al.,2001).
For ozone the values range between –8.6 and 4.7mWm2. The differences are due to
dif-ferences in the background ozone concentrations, perturbation pattern, and strength. E.g. for the E39/C model the ozone change is mainly confined to higher altitudes 5
(Fig.4), i.e. to a region where the ozone net RF changes its sign (Hansen et al.,1997), whereas the other models show also changes at lower stratospheric altitudes, where ozone changes are positively correlated with net RF.
The changes in the lifetime of tropospheric methane results in a mean change of the RF of –1.59mWm2 (0.11mWm2–3.33mWm2) and is therefore on a global scale for one model of 10
the same order of magnitude like the RF perturbation caused by CO2.
The change in contrails occurrence tends to reduce the climate impact, since more supersonic air traffic is replacing subsonic air traffic at higher latitudes (leading to con-trail avoidance) than at lower latitudes (leading to additional concon-trails).
The total RF ranges between 9 and 29mWm2 with a mean value of 22
mW
m2 . The large
15
range of uncertainty of a factor of three reflects the uncertainties in a number of pro-cesses included: stratospheric transport, chemistry and radiation.
Previous studies showed that the uncertainty in the calculation of the radiative forc-ing is less than 10% except for water vapour (Forster et al.,2001) and therefore smaller than differences between the transport and chemical calculations. For water vapour, 20
the ULAQ radiation scheme shows a factor of 2 higher values than the E39 model, em-ploying the same water vapour perturbation and background field (Table6). The results are consistent with previous findings (IPCC, 1999), which showed an uncertainty of a factor of two in the calculation of the water vapour related RF, with lower values derived with E39 model, compared to a narrow band model (Forster and Shine,1997).
25
Supersonic aircraft will lead to enhanced particle mass concentration (black car-bons and sulphate aerosols) and number concentration, especially in the ultra-fine and accumulation mode (see Sect. 4.6). Since only one model (ULAQ) simulated those changes, we consider the calculated impact as a sensitivity study, to prevent a too
ACPD
7, 6143–6187, 2007Climate impact of supersonic air traffic
Grewe et al. Title Page Abstract Introduction Conclusions References Tables Figures ◭ ◮ ◭ ◮ Back Close
Full Screen / Esc
Printer-friendly Version
Interactive Discussion
EGU large dependency on model uncertainties. The calculation of the associated RF is
per-formed with the ULAQ model. Table6and Fig.7summarize the results. The net direct aerosol effect on radiative forcing is negative and may be in the same order as the ozone related radiative forcing.
Figure 8 shows the changes in RF of the perturbation scenarios for constant total 5
RPK (a) and constant supersonic RPK (b). The almost doubling of the fleet size ap-proximately doubles the total RF caused by the replacement of sub- by supersonic aircraft (P3). The total RF is mainly dominated by the water vapour effect, which scales linearly, since transport of water vapour is nearly a linear process in the stratosphere, except for sedimentation of ice particles. An increased emission index of nitrogen 10
oxides (P2) increases the ozone destruction, which reduces the RF between approx-imately 15% (SLIMCAT) and 40% (ULAQ). Other agents are mainly unaffected. The ozone induced RF is increased by a factor of 2.7 in the ULAQ model and by 1.8 in the two other models. Since the water vapour induced RF in the ULAQ model is smallest among the models (Table 6) and the ozone induced RF changes in the P2 scenario is 15
largest, the P2 effect is maximized in the ULAQ model and on the other hand minimized in the SLIMCAT model.
Reducing the speed (P4) reduces the total RF by approximately 45%, ranging from 30% (SLIMCAT) to 55% (ULAQ). The reduction is mainly caused by the reduction in fuel use of the supersonic fleet (33%, Table3) and the reduction of the lifetime of the 20
water vapour perturbation (10%, Table3). The simulations with an enhanced range and reduced height were performed with the SLIMCAT model, only. The RF is reduced in the scenario P5 (increased range) by 17%, resulting from water vapour effects (10%) and ozone effects (7%). In the scenario P6 (reduced height) the total RF is reduced by 40%, which mainly results from water vapour. However, the difference between the 25
SLIMCAT model and the others in the scenario P4 is quite large. Moreover, the mean value (of all models) of the reduction factor of 0.55 for P4 (Fig. 8) is smaller than for P6 (0.61), but looking at the model, which was used for all simulations (i.e. SLIMCAT) the impact is reversed (P4: 0.71; P6: 0.61). Therefore, it cannot clearly be decided
ACPD
7, 6143–6187, 2007Climate impact of supersonic air traffic
Grewe et al. Title Page Abstract Introduction Conclusions References Tables Figures ◭ ◮ ◭ ◮ Back Close
Full Screen / Esc
Printer-friendly Version
Interactive Discussion
EGU whether P4 or P6 has the higher reduction factor.
5.2 Climate sensitivity
In order to derive the global mean near surface temperature change associated with the supersonic HSCT, the RF has to be combined with the climate sensitivity of each individual climate agent (Eq. 3). As explained in Sect. 3, the model dependency of 5
the efficacy is relatively small and it is sufficient to rely on one model. We applied the E39 model coupled to a mixed layer ocean, which has been used previously to identify climate sensitivity parameters relevant for aircraft perturbations (e.g. Ponater et al., 2006). (Ponater et al., 2005), e.g. found a climate sensitivity of 0.73 K/(W/m2) for CO2 and 0.43 K/(W/m
2
) for line-shaped contrails, i.e. a contrail efficacy of 0.59. 10
Further climate sensitivity parameters are given in Table7for methane, ozone in the lower stratosphere (O3-ls) and upper troposphere (O3-ut) and for a set of subsonic aircraft perturbations. The idealized scenarios O3-ls and O3-ut follow the experimental design of Stuber et al. (2001, 2005). Their efficacy factors derived with the 19 layer version of ECHAM4 of 1.82 and 0.72 are almost identical to our values of 1.80 and 15
0.75 (E39; 39 layer version of ECHAM4) for O3-ls and O3-ut, respectively. The subsonic aircraft perturbations are taken from previous simulations (Grewe et al.,2002). Clearly the ozone impact is more dominated by the contributions from the lower stratosphere. For the near temperature change calculations we adopt the O3-ls climate sensitivity parameter for stratospheric perturbations and additionally take a 20% uncertainty into 20
account. For water vapour changes in the stratosphere, we assume an efficacy factor of 1 and take also into account a 20% uncertainty (see section below), since there are no sufficient indications that stratospheric water vapour has a climate sensitivity parameter significantly different from CO2.
5.3 Climate impact 25
In the previous sections we prepared all necessary input to estimate the climate impact of HSCT Clearly, the water vapour impact dominates and leads to an increase of 21 mK
ACPD
7, 6143–6187, 2007Climate impact of supersonic air traffic
Grewe et al. Title Page Abstract Introduction Conclusions References Tables Figures ◭ ◮ ◭ ◮ Back Close
Full Screen / Esc
Printer-friendly Version
Interactive Discussion
EGU by the year 2100. Note that although emissions are kept constant during the years 2050
to 2100, the temperature is still increasing due to the atmospheric response times. Ozone is the second-strongest contributor to climate change, with a reduction in the temperature increase of 3.0 mK. The uncertainty with respect to atmospheric life time of the water vapour and ozone perturbations is negligable (not shown).
5
However, other parameters do also introduce non-negligible uncertainties. Taking into account the minimum and maximum values of the calculated RF (Table6) and a 20% uncertainty for the climate sensitivity introduces a much larger uncertainty. The water vapour impact on temperature changes ranges between 13 and 45mWm2 and for
ozone between –13 and 4.5mWm2 . This implies that the order of the temperature change
10
in the extremest case may be in the same range for water vapour and ozone (Fig.9b). Comparing all scenarios (Fig.9c) with a scaling by the HSCT traffic demand (RPK), it is clear that the climate impact can be reduced by ≈40% using the options P4 (speed), P5 (range), and P6 (height).
So far, our discussion has concentrated on the climate change aspect, only. Other 15
aspects like the change in ultra-violet radiation caused by a reduction of the ozone layer are discussed in the following section.
6 Synthesis and optimization
In Sects. 4 and 5 we have discussed how, according to the various model results, the emissions from the SCENIC HSCT scenarios affect climate and the ozone layer. 20
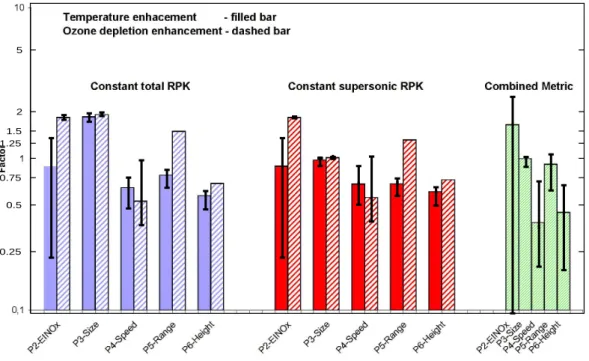
Figure 10 shows a combined metric: the 2100 changes of near surface temperature with respect to a base case HSCT fleet (filled bars) and the changes in the ozone layer (dashed bars) for constant RPK (blue) and normalized to a constant HSCT RPK (red). The best option would clearly be achieved, when both bars are minimal. Looking at constant RPK the P4 (reduced speed) and the P6 (reduced cruise altitude) option show 25
a minimum impact. P5 (range increase) also has a smaller impact for the combined effect (temperature and ozone layer) than the base case. However, the increase in
ACPD
7, 6143–6187, 2007Climate impact of supersonic air traffic
Grewe et al. Title Page Abstract Introduction Conclusions References Tables Figures ◭ ◮ ◭ ◮ Back Close
Full Screen / Esc
Printer-friendly Version
Interactive Discussion
EGU range leads to more flights being routed to South East Asia, which in turn leads to
more emissions in the tropical tropopause layer and therefore a more intense transport of emitted NOx into the stratosphere, so that ozone destruction is enhanced in the scenario P5 compared to the base case. The error bars indicate the minimum and maximum values, which can be obtained including all uncertainties discussed in the 5
previous sections, like model dependent chemical perturbation, RF calculations, and climate sensitivity. Taking this uncertainty into account the scenarios P4 and P6 both minimize the environmental impact. Both metrics can be combined by calculating their product (green bars), which better visualizes the results.
The uncertainty regarding the scenario P2 is largest because the increase in the 10
EI(NOx) leads to ozone destruction and near surface temperature decrease. This may compensate the water vapour induced temperature changes, when assuming the low-est simulated water vapour RF and climate sensitivity, which is an extreme case.
The lower the supersonic cruise altitude or the lower the cruising speed, the less the gain in time compared to subsonic flights. Therefore such a scenario is less economical 15
viable. However, increasing range may increase the viability with less environmental impacts compared to an increase in speed.
Aerosol effects were not included for this optimization considerations, since we ex-pect a model dependency according to different simulated transport characteristics (cf. Table3) and aerosol physics. In general, we tried to account for uncertainties by 20
applying a set of models, which was not possible for aerosols. However, since the total aerosol RF changes for the scenarios P2 to P6 (Fig.7) are similar to the RF changes due to water vapour, though smaller, it can be expected that the uncertainty related to the aerosol effects are of minor importance and do not significantly alter our findings.
7 Conclusions
25
In this study we have suggested a way how to evaluate options for aircraft in terms of global environmental impact (chemical composition and climate). The methodology
ACPD
7, 6143–6187, 2007Climate impact of supersonic air traffic
Grewe et al. Title Page Abstract Introduction Conclusions References Tables Figures ◭ ◮ ◭ ◮ Back Close
Full Screen / Esc
Printer-friendly Version
Interactive Discussion
EGU results in a combination of the near surface temperature change and a change of the
stratospheric ozone depletion relative to a base case. The base case has been a mixed fleet of subsonic aircraft and 501 supersonic aircraft with a cruise speed of Mach 2 and a capacity of 250 passengers. For the perturbation scenarios aircraft fleets are taken into account with an increased emission index for NO2 during supersonic cruise (P2), 5
a doubled fleet size (P3), or which are optimized with respect to a lower cruising speed (P4), an extended range (P5), and a reduced cruise altitude (P6).
The applied assessment approach utilizes a number of component models which are stepwise linked (Fig.1). In a first step, a transient emission scenario for total fuel use is developed based on the SCENIC emission data bases for 2025 and 2050 and 10
on the TRADEOFF database for the present. In a second step, concentration changes are calculated for ozone, water vapour and methane employing 4 global atmosphere-chemistry models for the time slice 2050. Contrail coverage changes are calculated based on the E39/C model. The stratospheric adjusted radiative forcing is then calcu-lated by applying a general circulation model employing the output of the atmosphere-15
chemistry model simulations. Various climate sensitivity parameters are calculated based on a general circulation model coupled to a mixed layer ocean. Utilizing a linear response model (AirClim), the radiative forcings and the climate sensitivity parameters are converted into an estimate of the near surface temperature change, allowing for different response time-scales of the chemistry-atmosphere-ocean system. All steps 20
include some uncertainties, which are either determined through the spread of model results, or taken from the literature. These uncertainties are determined for each indi-vidual component and then combined to give an overall uncertainty for the combined optimization metric.
In principle this approach has already been used in IPCC (1999). However, they con-25
centrated on RF and ozone column changes and did not try to optimize the combined effect.
The results clearly confirm previous findings (IPCC, 1999): stratospheric water vapour emissions are by far the most important contributor to climate change with
ACPD
7, 6143–6187, 2007Climate impact of supersonic air traffic
Grewe et al. Title Page Abstract Introduction Conclusions References Tables Figures ◭ ◮ ◭ ◮ Back Close
Full Screen / Esc
Printer-friendly Version
Interactive Discussion
EGU respect to a supersonic fleet. Only considering the extremes in the uncertainty range,
stratospheric ozone changes may become as important as stratospheric water vapour changes. The total radiative forcing by supersonic aircraft amounts to 22mWm2 in 2050,
with a rather large range of uncertainty of 9 to 29mWm2, depending on the modelled chemical perturbations. Previous estimates, e.g. IPCC (1999), are in general difficult 5
to compare, because the assumptions for the supersonic part of the mixed fleet, in terms of cruise altitude, routing and traffic demand differ significantly. IPCC (1999) gives an estimate of 82mWm2 induced by a replacement of 1000 aircraft by 2050 with a fuel consumption of 140 Tg and a cruise speed of Mach 2.0 to 2.4, i.e. cruise alti-tude 18–20 km. They estimated a range of uncertainty of –25mWm2 to 300mWm2. In order 10
to compare these values with our findings the different fuel usage and flight level has to be taken into account. By normalizing this value to the same fuel usage (60 Tg; Table3) and allowing a reduction of 40% caused by the differences in flight altitude (1.5 km difference between S5 and HSCT1000 from IPCC (1999), as well as between S5 and P4) this can be scaled to a value of 21mWm2 and a range of –6
mW
m20 to 77
mW m2 ,
15
leading to comparable results in this respect.
Based on the results of EU-project TRADEOFF, (Sausen et al.,2005) gave an up-dated version of the IPCC (1999) values for RF of subsonic air traffic of 48mWm2 for the
year 2000. Since the traffic demand is different in both transport modes the values are not directly comparable. However, the specific radiative forcing, i.e. the forcing per 20
passenger km, amounts to 16 mW/m2/Tpaxkm for the subsonic transport in 2000 and about double this value (30 mW/m2/Tpaxkm) for the supersonic case in 2050 (Tpaxkm = Tera passenger-km). Cleary, supersonic transport has a larger climate impact than subsonic transport. The investigation of the various options shows that the largest re-duction of an environmental impact of around 60% can be achieved by reducing the 25
speed or height to Mach 1.6 or by 1.5 km, respectively. These scenarios are charac-terized by a lower fuel consumption of the HSCT fleet, leading to a lower water vapour perturbation. Additionally, the lower flight altitude leads to a reduced residence time of the water vapour perturbation by 10%. Both factors reduce the radiative forcing and
ACPD
7, 6143–6187, 2007Climate impact of supersonic air traffic
Grewe et al. Title Page Abstract Introduction Conclusions References Tables Figures ◭ ◮ ◭ ◮ Back Close
Full Screen / Esc
Printer-friendly Version
Interactive Discussion
EGU the climate change and also lead to reduced ozone depletion.
Acknowledgements. This study has been supported by the European Commission through the SCENIC project and the EU-Integrated Project HISAC under the 6th Framework Programme.
References
Appleman, H.: The formation of exhaust contrails by jet aircraft, Bull. Am. Meteorol. Soc., 43,
5
14–20, 1953. 6151
Cess, R., Potter, G., Blanchet, J., Boer, G., Ghan, S., Kiehl, J., LeTreut, H., Li, Z.-X., Liang, X.-Z., Mitchell, J., Morcrette, J.-J., Randall, D., Riches, M., Roeckner, E., Schlese, U., Slingo, A., Taylor, K., Washington, W., Wetherald, R., and Yaga, I.: Interpretation of cloud-climate feedback as produced by 14 atmospheric general circulation models, Science, 245, 513–
10
516, 1989.6153
Chipperfield, M.: Multiannual simulations with a three-dimensional chemical transport model,
J. Geophys. Res., 104, 1781–1806, doi:10.1029/98JD02597, 1999. 6172
Chipperfield, M., Santee, M., Froidevaux, L., Manney, G., Read, W., Waters, J., Roche, A., and Russell, J.: Analysis of UARS data in the southern polar vortex in September 1992 using a
15
chemical transport model, J. Geophys. Res., 101, 18 861–18 882, doi:10.1029/96JD00936,
1996. 6172
Crutzen, P.: Ozone production rates in an oxygen-hydrogen-nitrogen oxide atmosphere, J.
Geo-phys. Res., 76, 7311–7327, 1971. 6146
Fichter, C., Marquart, S., Sausen, R., and Lee, D. S.: The impact of cruise altitude on
con-20
trails and related radiative forcing, Meteorologische Zeitschrift, 14, 563–572, doi:10.1127/
0941-2948/2005/0048, 2005. 6151
Forster, P. and Shine, K.: Radiative forcing and temperature trends from stratospheric ozone
changes, J. Geophys. Res., 106, 10 841–10 855, 1997. 6160
Forster, P., Ponater, M., and Zhong, W.-Y.: Testing Broadband Radiation Schemes for their
25
Ability to Calculate the Radiative Forcing and Temperature Response to Stratospheric Water
Vapour and Ozone Changes, Meteorol. Z., 10, 387–393, 2001. 6160
Fuglestvedt, J., Berntsen, T., Godal, O., Sausen, R., Shine, K., and Skodvin, T.: Metrics of climate change: Assessing radiative forcing and emission indices, Clim. Change, 58, 267– 331, 2003.
ACPD
7, 6143–6187, 2007Climate impact of supersonic air traffic
Grewe et al. Title Page Abstract Introduction Conclusions References Tables Figures ◭ ◮ ◭ ◮ Back Close
Full Screen / Esc
Printer-friendly Version
Interactive Discussion
EGU
Grewe, V.: Impact of climate variability on tropospheric ozone, Sci. Tot. Environ., 374, 167–181, doi:10.1016/j.scitotenv.2007.01.032, 2007. 6157
Grewe, V., Dameris, M., Fichter, C., and Sausen, R.: Impact of aircraft NOx emissions. Part 1: Interactively coupled climate-chemistry simulations and sensitivities to climate-chemistry feedback, lightning and model resolution, Meteorol. Z., 3, 177–186, 2002.6162
5
Hall, T. and Plumb, R.: Age as a diagnostic for stratospheric transport, J. Geophys. Res., 99,
1059–1070, 1994. 6155
Hansen, J., Sato, M., and Ruedy, R.: Radiative forcing and climate response, J. Geophys. Res.,
102, 6831–6864, 1997.6153,6160
Hansen, J., Satoand, M., Ruedy, R., Nazarenko, L., Lacis, A., Schmidt, G., Russell, G., Aleinov,
10
I., Bauer, M., Bauer, S., Bell, N., Cairns, B., Canuto, V., Chandler, M., Cheng, Y., DelGenio, A., Faluvegi, G., Fleming, E., Friend, A., Hall, T., Jackman, C., Kelley, M., Kiang, N., Koch, D., Lean, J., Lerner, J., Lo, K., Menon, S., Miller, R., Minnis, O., Novakov, T., Oinas, V., Perlwitz, J., Perlwitz, J., Rind, D., Romanou, A., Shindell, D., Stone, P., Sun, S., Tausnev, N., Tresher, D., Wielicki, B., Wong, T., and Zhang, S.: Efficacy of climate forcings, J. Geophys. Res., 110,
15
D18104, doi:10.1029/2005JD005776, 2005. 6153
Hein, R., Dameris, M., Schnadt, C., Land, C., Grewe, V., K ¨ohler, I., Ponater, M., Sausen, R., Steil, B., Landgraf, J., and Br ¨uhl, C.: Results of an interactively coupled atmospheric chemistry-general circulation model: Comparison with observations, Ann. Geophys., 19,
435–457, 2001. 6172
20
Holton, J., Haynes, P., McIntyre, M., Douglass, A., Rood, R., and Pfister, L.: Stratosphere-troposphere exchange, Rev. Geophys., 33, 403–439, 1995.
IPCC: Climate Change 1994. The radiative forcing of climate change and an evaluation of the IPCC IS92 emission scenarios., Intergovernmental Panel on Climate Change, Cambridge University Press, New York, NY, USA, 1995.
25
IPCC: Special report on aviation and the global atmosphere, edited by: Penner, J. E., Lister, D. H., Griggs, D. J., Dokken, D. J., and McFarland, M., Intergovernmental Panel on Climate
Change, Cambridge University Press, New York, NY, USA, 1999. 6145,6146
IPCC: Climate Change 2001 - The scientific basis. Contributions of working group I to the Third Assessment Report of the Intergovernmental Panel of Climate Change (IPCC),
Intergovern-30
mental Panel on Climate Change, Cambridge University Press, New York, NY, USA, 2001.
6148,6153
ACPD
7, 6143–6187, 2007Climate impact of supersonic air traffic
Grewe et al. Title Page Abstract Introduction Conclusions References Tables Figures ◭ ◮ ◭ ◮ Back Close
Full Screen / Esc
Printer-friendly Version
Interactive Discussion
EGU
A., Zanis, P., and Balis, D.: Tropospheric ozone changes at unpolluted and semipol-luted regions induced by stratospheric ozone changes, J. Geophys. Res., 110, D02302,
doi:10.1029/2004JD004618, 2005. 6157
Johnson, C. and Derwent, R.: Relative radiative forcing consequences of global emissions of
hydrocarbons, carbon monoxide and NOx from human activities estimated with a
zonally-5
averaged two dimensional model, Clim. Change, 34, 439–462, 1996. 6148
Johnston, H.: Reduction of stratospheric ozone by nitrogen oxide catalysts from supersonic
transport exhaust, Science, 173, 517–522, 1971. 6146
Joshi, M., Shine, K., Ponater, M., Stuber, N., Sausen, R., and Li, L.: A comparison of cli-mate response to different radiative forcings in three general circulation models: towards an
10
improved metric of climate change, Clim. Dyn., 20, 843–854, 2003. 6153
Land, C., Ponater, M., Sausen, R., and Roeckner, E.: The ECHAM4.L39(DLR) atmosphere GCM, Technical description and climatology, DLR-Forschungsbericht, 1991-31, 45 pp., ISSN
1434-8454, Deutsches Zentrum f ¨ur Luft- und Raumfahrt, K ¨oln, Germany, 1999. 6152
Manabe, S. and Wetherald, R.: The effects of doubling the CO2concentration on the climate of
15
a general circulation model, J. Atmos. Sci., 32, 3–15, 1975.6153
Marquart, S. and Mayer, B.: Towards a reliable GCM estimation of contrail radiative forcing,
Geophys. Res. Lett., 29, 1179, doi:10.1029/2001GL014 075, 2002. 6152
Marquart, S., Ponater, M., Mager, F., and Sausen, R.: Future development of contrail cover, optical depth and radiative forcing: Impacts of increasing air traffic and climate change, J.
20
Climate, 16, 2890–2904, 2003. 6151
Meyer, R., B ¨ull, R., Leiter, C., Mannstein, H., Marquart, S., Oki, T., and Wendling, P.: Contrail observations over southern and eastern Asia in NOAA/AVHRR data and intercomparison to contrail simulations in a GCM, Int. J. Remote Sens, in press, 2007. 6151
Pitari, G., Mancini, E., Rizi, V., and Shindell, D.: Impact of future climate and emission changes
25
on stratospheric aerosols and ozone, J. Atmos. Sci., 59, 414–440, 2002b. 6172
Pitari, G., Mancini, E., and Bregman, A.: Climate forcing of subsonic aviation: Impact of sulfate particles via heterogeneous chemistry, Geophys. Res. Lett., 29, 14-1–14-4, 2002.
Ponater, M., Marquart, S., and Sausen, R.: Contrails in a comprehensive global climate
model: Parameterisation and radiative forcing results, J. Geophys. Res., 107, 4164,
30
doi:10.1029/2001JD000429, 2002. 6151
Ponater, M., Marquart, S., Sausen, R., and Schumann, U.: On contrail climate sensitivity,
ACPD
7, 6143–6187, 2007Climate impact of supersonic air traffic
Grewe et al. Title Page Abstract Introduction Conclusions References Tables Figures ◭ ◮ ◭ ◮ Back Close
Full Screen / Esc
Printer-friendly Version
Interactive Discussion
EGU
Ponater, M., Pechtl, S., Sausen, R., Schumann, U., and H ¨uttig, G.: Potential of the cryoplane technology to reduce aircraft climate impact: A state-of-the-art assessment, Atmos.
Envi-ronm., 40, 6928–6944, doi:10.1016/j.atmosenv.2006.06.036, 2006. 6153
Prather, M.: Numerical advection by conservation of second-order moments, J. Geophys. Res.,
91, 6671–6681, 1986. 6150
5
Sausen, R. and Schumann, U.: Estimates of the climate response to aircraft CO2 and NOx
emissions scenarios, Clim. Change, 44, 25–58, 2000.6149,6153,6154
Sausen, R., Isaksen, I., Grewe, V., Hauglustaine, D., Lee, D. S., Myhre, G., K ¨ohler, M. O., Pitari, G., Schumann, U., Stordal, F., and Zerefos, C.: Aviation Radiative Forcing in 2000: An
Update on IPCC (1999), Meteorol. Z., 14, 555–561, 2005. 6145,6166
10
Schmidt, E.: Die Entstehung von Eisnebel aus den Auspuffgasen von Flugmotoren, Schriften
der deutschen Akademie der Luftfahrtforschung, 44, 1–15, 1941.6151
Søvde, O. A., Gauss, M., Isaksen, I. S. A., Pitari, G., and Marizy, C.: Aircraft pollution: a futuristic view, Atmos. Chem. Phys. Discuss., 7, 2531–2560, 2007,
http://www.atmos-chem-phys-discuss.net/7/2531/2007/.
15
Stuber, N., Sausen, R., and Ponater, M.: Stratosphere adjusted radiative forcing calculations in
a comprehensive climate model, Theor. Appl. Climatol., 68, 125–135, 2001. 6152
Stuber, N., Ponater, M., and Sausen, R.: Why radiative forcing might fail as a predictor of climate change, Clim. Dyn., 24, 497–510, doi:10.1007/s00382–004–0497–7, 2005.
Sundet, J. K.: Model Studies with a 3-D Global CTM using ECMWF data, Ph.D. thesis, Dept.
20
of Geophysics, University of Oslo, Norway, 1997. 6172
Svensson, F., Hasselrot, A., and Moldanova, J.: Reduced environmental impact by lowered cruise altitude for liquid hydrogen-fuelled aircraft, Aerosp. Sci. Technol., 8, 307–320, 2004.
6148
Taalas, P., Damski, J., Kyr ¨o, E., Ginzburg, M., and Talamoni, G.: Effect of stratospheric ozone
25
variations on UV radiation and on tropospheric ozone at high latitudes, J. Geophys. Res.,
102, 1533–1540, 1997.6157
Wetherald, R. and Manabe, S.: The effects of changing the solar constant on the climate of a general circulation model, J. Atmos. Sci., 32, 2044–2059, 1975.6153
ACPD
7, 6143–6187, 2007Climate impact of supersonic air traffic
Grewe et al. Title Page Abstract Introduction Conclusions References Tables Figures ◭ ◮ ◭ ◮ Back Close
Full Screen / Esc
Printer-friendly Version
Interactive Discussion
EGU
Table 1. Characterization of the SCENIC aircraft emission database. S4 denotes the subsonic
fleet for 2050, S5 the base case mixed fleet for 2050, and P various perturbation scenarios. Abbreviations: nm = nautical miles = 1852 km; Pax = passenger; Tot. = Total fleet; Sup. = Supersonic fleet; Comm. = commercial fleet).
Scenario Number Speed Max. Cruise Revenue Fuel NOx EI(NOx) Distance of Air- range altitude pass. km consumption
craft Mach nm kfts 1011pax km Tg/year Tg(NO2)/year g(NO2)/kg(fuel) 1010km
Supersonic characteristics Tot. Sup. Tot. Sup. Tot. Sup. Tot. Sup. Comm. S4-Sub 0 – – – 178.2 0 677 0 7.35 0 10.85 – 11.67 S5-Mixed 501 2.0 5400 54–64 178.4 7.3 721 60 7.45 0.27 10.33 4.60 11.84 P2-EINOx 501 2.0 5400 54–64 178.4 7.3 721 60 7.75 0.57 10.74 9.63 11.84 P3-Size 972 2.0 5400 54–64 178.7 14.1 762 115 7.54 0.53 9.90 4.62 12.01 P4-Speed 544 1.6 6000 47–59 178.4 6.9 703 41 7.40 0.22 10.53 5.42 11.76 P5-Range 558 2.0 5900 53–65 178.5 8.3 733 74 7.64 0.49 10.41 6.61 11.88 P6-Height 561 1.6 5900 43–55 178.4 6.9 702 40 7.40 0.22 10.55 5.62 11.76


![Fig. 9. Temporal development of the near surface temperature change [mK] induced by a partial replacement of the subsonic aircraft (S5 minus S4)](https://thumb-eu.123doks.com/thumbv2/123doknet/14774122.592787/45.918.166.535.38.506/temporal-development-surface-temperature-induced-replacement-subsonic-aircraft.webp)