HAL Id: hal-00296551
https://hal.archives-ouvertes.fr/hal-00296551
Submitted on 20 May 2008
HAL is a multi-disciplinary open access
archive for the deposit and dissemination of
sci-entific research documents, whether they are
pub-lished or not. The documents may come from
teaching and research institutions in France or
abroad, or from public or private research centers.
L’archive ouverte pluridisciplinaire HAL, est
destinée au dépôt et à la diffusion de documents
scientifiques de niveau recherche, publiés ou non,
émanant des établissements d’enseignement et de
recherche français ou étrangers, des laboratoires
publics ou privés.
The role of VOC oxidation products in continental new
particle formation
A. Laaksonen, M. Kulmala, C. D. O’Dowd, J. Joutsensaari, P. Vaattovaara, S.
Mikkonen, K. E. J. Lehtinen, L. Sogacheva, M. Dal Maso, P. Aalto, et al.
To cite this version:
A. Laaksonen, M. Kulmala, C. D. O’Dowd, J. Joutsensaari, P. Vaattovaara, et al.. The role of
VOC oxidation products in continental new particle formation. Atmospheric Chemistry and Physics,
European Geosciences Union, 2008, 8 (10), pp.2657-2665. �hal-00296551�
www.atmos-chem-phys.net/8/2657/2008/ © Author(s) 2008. This work is distributed under the Creative Commons Attribution 3.0 License.
Chemistry
and Physics
The role of VOC oxidation products in continental new particle
formation
A. Laaksonen1,4, M. Kulmala2, C. D. O’Dowd3, J. Joutsensaari1,*, P. Vaattovaara1, S. Mikkonen1, K. E. J. Lehtinen1,4, L. Sogacheva2, M. Dal Maso2, P. Aalto2, T. Pet¨aj¨a2, A. Sogachev2, Y. J. Yoon3,**, H. Lihavainen4, D. Nilsson5,
M. C. Facchini6, F. Cavalli6,***, S. Fuzzi6, T. Hoffmann7, F. Arnold8, M. Hanke8, K. Sellegri8,****, B. Umann8,
W. Junkermann9, H. Coe10, J. D. Allan10, M. R. Alfarra10,*****, D. R. Worsnop11, M. -L. Riekkola12, T. Hy¨otyl¨ainen12, and Y. Viisanen4
1University of Kuopio, Department of Physics, POB 1627, 70211 Kuopio, Finland 2University of Helsinki, Department of Physical Sciences, Helsinki, Finland 3National University of Ireland, Galway, Department of Physics, Ireland 4Finnish Meteorological Institute, POB 503, 00101 Helsinki, Finland
5Stockholm Univ., Dept. of Applied Environmental Science (ITM), Atmospheric Science Unit, 10691, Stockholm, Sweden 6Istituto di Scienze dell’Atmosfera e del Clima – CNR, Italy Via Gobetti 101, 40 129 Bologna ,Italy
7Johannes Gutenberg-University of Mainz, 55128, Mainz, Germany 8Max-Planck-Institute for Nuclear Physics, Heidelberg, Germany
9Forschungszentrum Karlsruhe, Ins. for Meteorology and Climate Research, IMK-IFU, Garmisch-Partenkirchen, Germany 10School of Atmospheric and Environmental Science, University of Manchester, PO Box 88, Manchester, M60 1QD, UK 11Aerodyne Research Inc., 45 Manning Road, Billerica, Ma 01821-3976, USA
12University of Helsinki, Department of Chemistry, Helsinki, Finland
*now at: University of Kuopio, Department of Environmental Sciences, POB 1627, 70211 Kuopio, Finland
**now at: Korea Polar Res. Inst., SongDo Techno Park, 7-50, Songdo-dong, Yeonsu-Gu, Incheon City, 406-840, Korea ***now at: Joint Research Centre, Via E. Fermi, 1, 21020 Ispra, Italy
****now at: Laboratoire de M´et´eorologie Physique (LaMP), Observatoire de Physique du Globe de Clermont-Ferrand (OPGC), UMR 6016 CNRS, France
*****now at: Paul Scherrer Institut, 5232 Villigen, Switzerland
Received: 2 May 2007 – Published in Atmos. Chem. Phys. Discuss.: 4 June 2007 Revised: 7 May 2008 – Accepted: 8 May 2008 – Published: 20 May 2008
Abstract. Aerosol physical and chemical properties and trace gas concentrations were measured during the QUEST field campaign in March–April 2003, in Hyyti¨al¨a, Finland. Our aim was to understand the role of oxidation products of VOC’s such as mono- and sesquiterpenes in atmospheric nu-cleation events. Particle chemical compositions were mea-sured using the Aerodyne Aerosol Mass Spectrometer, and chemical compositions of aerosol samples collected with low-pressure impactors and a high volume sampler were analysed using a number of techniques. The results indi-cate that during and after new particle formation, all
parti-Correspondence to: A. Laaksonen
(ari.laaksonen@uku.fi)
cles larger than 50 nm in diameter contained similar organic substances that are likely to be mono- and sesquiterpene ox-idation products. The oxox-idation products identified in the high volume samples were shown to be mostly aldehydes. In order to study the composition of particles in the 10–50 nm range, we made use of Tandem Differential Mobility Ana-lyzer results. We found that during nucleation events, both 10 and 50 nm particle growth factors due to uptake of ethanol vapour correlate strongly with gas-phase monoterpene oxi-dation product (MTOP) concentrations, indicating that the organic constituents of particles smaller than 50 nm in di-ameter are at least partly similar to those of larger particles. We furthermore showed that particle growth rates during the nucleation events are correlated with the gas-phase MTOP
2658 A. Laaksonen et al.: VOC oxidation products and new particle formation
concentrations. This indicates that VOC oxidation products may have a key role in determining the spatial and temporal features of the nucleation events. This conclusion was sup-ported by our aircraft measurements of new 3–10 nm particle concentrations, which showed that the nucleation event on 28 March 2003, started at the ground layer, i.e. near the VOC source, and evolved together with the mixed layer. Further-more, no new particle formation was detected upwind away from the forest, above the frozen Gulf of Bothnia.
1 Introduction
Atmospheric nucleation of new aerosol particles has in the recent years received considerable attention (Kulmala, 2003) as it has become evident that, given favourable circum-stances, nucleation takes place almost everywhere in the at-mosphere (Kulmala et al., 2004), and is potentially an im-portant source of cloud condensation nuclei (Laaksonen et al., 2005, Komppula et al., 2005). Despite extensive research efforts, both experimental and theoretical, many aspects of atmospheric new particle formation remain elusive. Perhaps the most widely accepted theory (Kulmala et al., 2000) pos-tulates that ternary nucleation of sulfuric acid, ammonia and water explains the appearance of thermodynamically stable clusters (TSC) in the 1–2 nm size range. However, the con-centrations of sulfuric acid are generally too low to allow the clusters to grow beyond the 3 nm detection limit of modern aerosol instruments before they are scavenged during colli-sions with large aerosol particles.
It is suspected that in the Boreal forest environment, where sulphuric acid concentrations are too low to explain parti-cle growth (e.g. Boy et al., 2005), the vapors causing the condensational growth of the clusters to observable sizes are low vapor pressure organic species whose exact chemical na-tures are unknown. So far, the experimental evidence of this is scarce: O’Dowd et al. (2002) showed, based on particle growth inside a pulse-height analyzing condensation parti-cle counter, that fresh 3–4 nm partiparti-cles are likely to contain organics, and recently the particle growth rates were shown to correlate with the product of monoterpene concentration and global radiation (Kulmala et al., 2004), a quantity that is expected to be proportional to the concentration of the con-densable organics.
Notwithstanding the challenging questions to resolve in terms of micro-scale or nano-scale processes, there also exist many questions regarding the role of macro-scale features of the events. Some key questions arise: what are the spatial scales and degree of homogeneity of continental nucleation events? Does nucleation and growth occur in the free tro-posphere or in the boundary layer? Is nucleation primarily driven by the mixing of different air parcels? These ques-tions need to be answered before the relevance of homoge-neous nucleation as a source of climatically active aerosol
particles and cloud condensation nuclei can be assessed and quantified.
Here, we report results from an intensive field measure-ment campaign that took place in March–April 2003 in Hyyti¨al¨a, Finland. Our results shed light on many of the open questions associated with continental boundary layer nucle-ation. The campaign, featuring two aircraft and an array of state-of-the-art instrumentation, was a part of the EU-funded project QUEST (Quantification of Aerosol Nucleation in the European Boundary Layer), in which experimental and com-putational tools were used in a comprehensive and focused manner to elucidate key processes and scales associated with atmospheric nucleation events and to better quantify their contribution to the European aerosol population. The mea-surement site is situated inside a Scots Pine canopy in a rural area in Southern Finland. More than eleven years of continuous aerosol particle size distribution data in the 3– 500 nm size range is available from the site, where on aver-age 50–100 nucleation events takes place annually with the frequency of the events peaking in springtime. Below, we present new findings on the nature of the chemical species participating in growth of new particles, and link these find-ings to the spatial and temporal variability of the nucleation events observed during aircraft measurements.
2 Experimental
2.1 Meteorological and gas phase measurements
Several meteorological and gas phase parameters are be-ing measured continuously at the Hyyti¨al¨a station, includbe-ing temperature, pressure, relative humidity, wind speed and di-rection, and SO2, NO, NOx, CO, CO2, H2S and O3 concen-trations. Several radiation parameters (UVA, UVB, global radiation, PAR) are also being measured continuously. Wind and radiation parameters are also being measured at different heights from a 75 m high mast. Detailed information of these measurements is provided in Kulmala et al. (2001).
During the 2003 QUEST campaign, a Chemical Ionization Mass Spectrometer (Sellegri et al., 2005a) was operated be-tween 17–29 March to measure volatile organic compounds. As described by Sellegri et al. (2005b), these compounds in-cluded acetone, di- and trimethylamine, monoterpenes, iso-prene, methyl vinyl ketone and methacrolein, and monoter-pene oxidation products (MTOP).
2.2 Aerosol measurements
Aerosol size distributions between 3–500 nm have been recorded at the Hyyti¨al¨a station continuously from the be-ginning of 1996 (e.g. Kulmala et al., 2001). These measure-ments are taken from 2 meters’ height inside the canopy us-ing a twin Differential Mobility Particle Sizer (DMPS) sys-tem. The size distribution is recorded in 10 min intervals.
The size distribution of particles larger than 500 nm is cur-rently measured using an aerodynamic particle sizer (APS).
In order to understand the chemical composition of aerosol particles during events of new particle nucleation and growth, we employed during the 2003 QUEST campaign an array of different techniques capable of resolving different chem-ical features of particles in varying size ranges. Size re-solved impactor samples of particles with sizes between 50 nm and 10 µm were collected during nucleation event days (see Cavalli et al., 2006 for details), and these sam-ples were subsequently analysed for inorganic ions concen-trations by ion chromatography and for water-soluble organic carbon (WSOC) content by TOC liquid analyser. Further-more a functional group analysis of the water-soluble organic compounds was performed by Proton Nuclear Magnetic Res-onance, HNMR (Cavalli et al., 2006).
To keep the sampling time short, high volume sampler was employed for the collection of aerosol samples for the sub-sequent analysis of organic compounds, including MTOP. Sampling conditions and analytical procedures for the deter-mination of organics by LC-MS, GC-MS and GC*GC-FID are described elsewhere (Rissanen et al., 2006; Anttila et al., 2005; Kallio et al., 2006)
A quadrupole type Aerodyne Aerosol Mass Spectrometer (AMS) (Jayne et al., 2000; Jimenez et al., 2003) was used to measure the size and composition of particles between 50 and 700 nm. This instrument used fast thermal desorption (600◦C oven temperature) and 70 eV electron ionisation and the data analysis techniques described by Allan et al. (2003) and Allan et al. (2004) were employed. Using this configura-tion, it was possible to quantify the nonrefractory component of the particles, which in practice meant the mass concentra-tions of organics, sulphate, nitrate and ammonium. The in-strument was also able to derive composite mass spectra for the organic fraction. More information on this deployment and the results gained can be found in Allan et al. (2006).
In order to obtain chemical information about smaller particles, we used an Ultrafine Organic Tandem Differen-tial Mobility Analyzer (UFO-TDMA) (Joutsensaari et al., 2001; Vaattovaara et al., 2005) to measure ethanol uptake efficiencies of 10 and 50 nm sized particles. In this instru-ment, nearly monodisperse particles of desired size are se-lected from a dried (at RH of about 3%) polydisperse ambient aerosol using the first DMA of the TDMA system. These par-ticles are then introduced into air mixed with ethanol vapor (saturation ratio 83%), and their size change is measured us-ing the second DMA. The growth factor (GF, ratio of wet and dry sizes) depends on the solubility of the particle material in ethanol and on the molecular size of the aerosol material (provided that all other molecular properties are the same, particles consisting of smaller molecules will show a larger
GF at a given saturation ratio).
Earlier, it has been shown that particles consisting of in-organic salts such as ammonium sulfate and sodium chloride do not grow in ethanol vapour (GF=1) whereas many organic
substances show GF’s up to 1.4–1.5 at 50–100 nm dry sizes (Joutsensaari et al., 2001; Vaattovaara et al., 2005) and up to 1.2 at 10 nm dry sizes (Vaattovaara et al., 2005). Ammonium bisulfate shows modest growth at 50–100 nm (Vaattovaara et al., 2005; Joutsensaari et al., 2004) but does not grow at 10 nm (Vaattovaara et al., 2005). Similarly, mixed particles of ammonium bisulfate and sulfuric acid (sulfuric acid mass fractions up to 0.50) have GF’s of unity at 10 nm dry size (Vaattovaara et al., 2005). The decrease of the GF as a func-tion of particle dry size for a given substance is mainly due to the Kelvin effect, increasing the vapor pressure of ethanol in the solution droplets as droplet curvature increases. Informa-tion concerning the UFO-TDMA measurements during the 2003 QUEST campaign is available in Pet¨aj¨a et al. (2005).
2.3 Aircraft measurements
A Twin Otter (DHC-6/300 operated by the Geological Sur-vey of Finland) aircraft (C. O’Dowd et al., 2008) and the IMK-IFU microlight, a motorized hangglider (Junkermann, 2001, 2005), were deployed during this campaign in order to obtain information about the regional-scale spatial and tem-poral features of nucleation events. Both of these carried aerosol, gas and meteorological instrumentation to elucidate the spatial extent of these nucleation events and to try to lo-cate the region of the atmosphere where nucleation first oc-curred.
One of the strongest nucleation events during the cam-paign occurred on the 28 March 2003. This coincided with the most extensive aircraft missions, with two Twin Otter flights and a microlight flight in between. The flights were designed to capture boundary layer meteorological structure and existing aerosol concentrations prior to the onset of nu-cleation and to try to locate the region where nunu-cleation oc-curred first, and then to follow the evolution of boundary layer and aerosol properties throughout the event.
3 Results and discussion
3.1 Overall aerosol chemistry during the campaign
When the air originated from continental European direc-tions (southeast to southwest), the composition tended to contain organics, ammonium, nitrate, elemental carbon and anthropogenic tracers such as PAHs. The particles were often pH neutral (based on the measured ions), and sub-micron aerosol mass concentrations typically reached sev-eral µg m−3. Additionally, the mass spectra of the or-ganic fraction measured by the AMS during continental out-breaks exhibited a signature typical of heavily oxidised or-ganic material, previously measured in other background sites subjected to regional pollution (Topping et al., 2004). The sources of these particulate materials are likely to be processed emissions from within continental Europe. The presence of monoterpene oxidation products such pinic and
2660 A. Laaksonen et al.: VOC oxidation products and new particle formation
Table 1. Concentrations of oxidation products of α-pinene in aerosol samples (ng/m3).
Sample pinon-aldehyde pinic acid pinonic acid 22.3.2003, 10:00–12:00 73.58 0.48 1.16 22.3.2003, 12:00–14:00 61.39 1.38 1.15 24.3.2003, 08:00–12:00 130.17 0.32 1.69 24.3.2003, 12:00–16:00 139.71 1.26 1.87 10.4.2003, 09:00–13:00 41.22 0.20 3.69 10.4.2003, 13:00–17:00 90.07 0.71 3.03
cis-norpinonic acids (at around 10 ng m−3)in these samples indicates that there are biogenic sources in addition to those of anthropogenic origin.
During the arctic air outbreaks (air masses mostly from northwest-northeast directions), the pre-existing aerosol were often acidic, mainly composed of sulfate with lit-tle ammonium. While being the dominant species, the mass concentrations of sulfate were low, typically less than 0.5 µg m−3. Organic matter was always present, but this was not accompanied with elemental carbon, indicating that it was probably not of anthropogenic origin.
3.2 Aerosol chemistry following nucleation events
By the late evening of most nucleation days the particles were large enough (>30 nm) to be analyzed by an AMS and possessed enough mass to be distinguishable in the size-resolved data produced by the AMS (Allan et al., 2006). On each nucleation event recorded, the majority of the mass of growing particles was organic in nature. The growing parti-cles only gave a response in AMS m/z (mass number/electric charge) channels associated with organic species (e.g. m equal to 43, 55, 57), confirming that the majority of the mass of the growing particles is organic in nature. The base mass peak was invariably m/z=43, which can be produced by both aliphatic chains or oxidized functional groups (Allan et al., 2006). Several mass peaks were present at a relative inten-sity that had not previously been observed with an AMS (Al-lan et al., 2006), demonstrating that the nature of the organic matter was significantly different from that observed in either anthropogenic emission dominated or remote environments, and consistent with terpene oxidation products. The over-all mass spectral fingerprint was identical in each case for small (<200 nm in diameter) and large (300–700 nm) parti-cles, implying that similar secondary organic species were condensing onto all particles. Further to this, it supports the assumption that the analyses of impactor and filter samples should be generally representative of the condensing organic species, regardless of the sizes of the particles sampled.
A comparison between the H-NMR spectra of the impactor-collected nucleation event aerosols and those of secondary organic aerosol (SOA) generated from α-pinene
in smog chamber experiments, indicates that, in samples collected during nucleation days when anthropogenic pol-lution levels were low, the oxidation products of α-pinene accounted for 72% of the total H-NMR signal (Cavalli et al., 2006), corresponding to 51% of water-soluble organic compounds, on average. This finding allows us to postulate that, α-pinene oxidation products (and probably also oxida-tion products from other monoterpenes) are the most likely species to contribute to the growth of nanometer-sized parti-cles. The AMS mass spectra (Allan et al., 2006) are consis-tent with the identification of these oxidation products.
Previously it has been shown that interaction of or-ganic acids, for example, pinonic acid, produced by photo-oxidation of terpenes with other organic or inorganic species present in the atmosphere most probably causes observed growth of new particles over forest (Kavouras et al., 1998). However, results of our investigation indicate that aldehydes are responsible for the aerosol growth at least as much as acids. Previously, Boy et al. (2004) found pinonaldehyde in Hyyti¨al¨a aerosol samples. Concentrations of α-pinene oxi-dation products obtained from our samples are presented in Table 1. As can be seen, the concentration of pinonaldehyde is considerably higher than the concentrations of correspond-ing acids. If the emissions of different terpene compounds is taken in account, the significance of sesquiterpene oxida-tion products for aerosol growth can be expected to be high. The relative contribution of α-pinene oxidation products to SOA formation has been predicted to be on the order of 20% (Andersson-Sk¨old et al., 2001). The significance of aldehy-des in oxidation of sesquiterpenes, and especially their sta-bility and presence in aerosol samples are confirmed by our most recent results (Parshintsev et al., 2008)
It should be noted, however, that pinonaldehyde has a rel-atively high vapor pressure, and its presence in high concen-trations in the aerosol is difficult to explain without invoking some degree of chemical bonding. It is possible that gas-phase pinonaldehyde can adsorp onto quartz filters or absorb in the aerosol collected on the filters during the sampling. However, in our recent experiments the gas-phase compo-nents were removed before aerosol collection, but we still found high levels of pinonaldehyde in the aerosol. We there-fore do not believe sampling artifact to be the (main) rea-son for the high levels of pinonaldehyde found in the particle phase. Another possibility is that pinonaldehyde is a degra-dation product of the extraction/analysis procedure. How-ever, we have used a rather “gentle” extraction method, with no heating of the sample, and cool on-column injection is used in our GC method. Thus, alteration of sample dur-ing sample introduction is very unlikely. Taken together, the definitive reason for the appearance of pinonaldehyde in the aerosol sample analysis remains unclear. However, the pinonaldehyde functionality is real – whether as molecular pinonaldehyde in the gas phase, or as a degradation product of the aerosol analysis – showing that efficient terpene oxi-dation is taking place during nucleation events.
MTOP 0 100 200 300 400 500 600 700 800 G F a t 5 0 n m 1.04 1.06 1.08 1.10 1.12 1.14 1.16 1.18 1.20 1.22
Fig. 1. MTOP concentration (ppt) vs. particle growth factor (wet diameter/dry diameter) of 50 nm dry particles due to uptake of ethanol. The linear fit is given by GF=1.07+1.63e-4*MTOP,
R2=0.44.
Evidence that freshly nucleated 10 nm particles contain similar organic substances as the larger particles comes from an examination of the ethanol vapor uptake efficiencies of 10 nm and 50 nm particles. Figures 1 and 2 show how the 50 and 10 nm GF’s measured during nucleation events (i.e. dur-ing times when there clearly are freshly formed particles of these sizes present) correlate with gas-phase MTOP whose concentration can be used as a marker for the simultaneous formation of less volatile monoterpene oxidation products. The datapoints represent hourly values where the GF’s are mostly single measurements (i.e. measurements were carried out once per hour) and the MTOP’s are means of six ten-minute measurements. The measurement error of the GF is ±0.01, and the average standard deviation of the MTOP values is 13 ppt. The correlations are very clear, but impor-tantly they vanish when data measured during non-event pe-riods are included. Note that with the linear fits in Figs. 1 and 2 we do not intend to indicate that high GF’s cannot be found at low MTOP concentrations. Indeed, it is evident from Fig. 2 that such circumstances also occur. Assuming that the 10 nm particles mostly consist of sulphate and organ-ics, and accounting for the fact that sulphate does not take up ethanol in 10 nm particles (Vaattovaara et al., 2005), then it could be possible to have high GF’s at low MTOP concentra-tions provided that the sulphuric acid concentration is low as well. Indeed, examination of our data showed that the high
GF datapoints at low MTOP concentrations seen in Fig. 2
are from 19 March, when particle growth was slow (growth rate 1 nm/h; see Fig. 3 below), implying that the levels of all condensing species were rather low.
Summarizing the above findings, we have 1) inferred de-tailed information of the chemical nature of condensed or-ganics from the various large particle analyses, 2) shown that
MTOP 0 100 200 300 400 500 G F a t 1 0 n m 1.02 1.04 1.06 1.08 1.10 1.12 1.14 1.16 1.18
Fig. 2. MTOP concentration (ppt) vs. particle growth factor (wet diameter/dry diameter) of 10 nm dry particles due to uptake of ethanol. The linear fit is given by GF=1.05+1.99e−4*MTOP,
R2=0.64.
Fig. 3. Particle diameter growth rates (GR, nm h−1)during ten different nucleation events vs. gas-phase MTOP concentration (ppt). MTOP values have been averaged over the time interval from which the growth rate was determined. The linear fit is given by
GR=0.97+0.0043*MTOP, R2=0.965.
the AMS mass spectra are consistent with the large particle results and that the mass spectra in the largest (below one micron) and in the smallest (below 100 nm) size ranges de-tected by the instrument are similar, and 3) used the OTDMA to show that the ethanol growth factors of 50 nm and 10 nm particles are both correlated with MTOP during nucleation events and therefore it is highly likely that they both contain similar organics which can also be found in larger particles.
Figure 3 shows a positive correlation between particle growth rates (GR) during different nucleation events, and gas-phase MTOP concentrations averaged over the events.
2662 A. Laaksonen et al.: VOC oxidation products and new particle formation
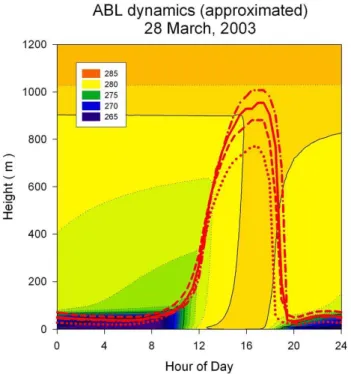
Fig. 4. Evolution of height of mixed layer during 28 March 2003. Dotted line approximates ABL dynamics with bare surface (no veg-etation); dashed line with vegetation similar to one at Hyyti¨ala but with twice less leaf area index (LAI); solid line for Hyyti¨ala vege-tation (pine forest 15 m height, all side LAI 7.4); dash-dot line with vegetation similar to one at Hyyti¨ala but with twice higher LAI. Potential temperature field is for Hyyti¨ala forest and radiation data from Hyyti¨ala tower. Radiation input was the same in all calcula-tions. Colour indicates potential temperature. See text for additional details.
In stark contrast to observations made in Pittsburgh (Zhang et al., 2004) no such correlation can be seen between the GR and gas phase sulfuric acid concentration. We therefore con-clude that oxidation products of α-pinene and other monoter-penes are not only present in the freshly nucleated particles at all detectable sizes, but also determine their growth rates and thus their survival probability into a size range where they become optically active and relevant as CCN.
3.3 Evolution of nucleation event
The spatial and temporal evolution of the nucleation events depends on two quite different gas phase species: sulphur dioxide, the precursor of H2SO4which is likely to be the con-trolling factor in the nucleation of the smallest stable clusters, and VOC oxidation products which, as shown above, dom-inate particle growth. SO2 at the Hyyti¨al¨a station is mostly long range transported: its residence time is on the order of days, and because there are no strong sources nearby, it has quite uniform concentrations in the mixed layer air. Mono-and sesquiterpenes, on the other hMono-and, have shorter lifetime, and they are locally released by trees. As MTOP determine
particle growth rates, it is conceivable that observable par-ticle formation is limited to areas close to the mono- and sesquiterpene sources. Demonstrations of this were obtained from aircraft measurements carried out during the measure-ment campaign
The descent into the aircraft operation area on 28 March 2003, indicated a decoupled boundary layer structure follow-ing a night of significant nocturnal coolfollow-ing. The boundary layer comprised a mixed layer inversion up to 250 m, a first decoupled mixed layer or residual layer at 300–900 m and a second residual layer between 900 and 1400 m where the free troposphere inversion was located. Total particle concentra-tions in the free troposphere and upper residual layer was of the order of 70–100 cm−3, increasing to 2500–3000 cm−3 at about 600 m (through the lower residual layer and mixed layer). No nucleation mode particles were encountered dur-ing the descent. Followdur-ing the descent, a series of 10-min horizontal runs (corresponding to a spatial scale of 60 km) were conducted at heights between 30 m and 300 m above ground level and over fixed ground positions. On the re-turn to the starting ground position, an ascent from the end-ground position to 1000 m was conducted, followed by a de-scent to the start ground position. The first evidence of par-ticle formation was encountered at approximately 09:00 a.m. on the 30 m horizontal where particle concentrations briefly increased from 3000 to 8000 cm−3. For the next hour, during these runs, more small parcels of air containing nucleation mode particles were encountered and gradually, the whole boundary layer become laden with nucleation mode parti-cles and by 10:50 a.m., peak particle concentrations exceeded 30 000 cm−3.
In order to characterise the boundary layer evolution dur-ing the morndur-ing of 28 March, the mixed layer height was modelled using radiation and wind recorded at different heights from the 75 m high mast at the Hyyti¨al¨a measure-ment station. Figure 4 shows potential temperature evolution as a function of altitude during the day. We estimated the ABL dynamics using observed data of potential temperature profile in the free atmosphere (O’Dowd et al., 2008). The geostrophical wind was approximated as 5 m/s. As the sur-face above which the flights took place is not homogeneous, we calculated the ABL dynamics assuming different types of vegetation, which resulted in some variance (see Fig. 4).
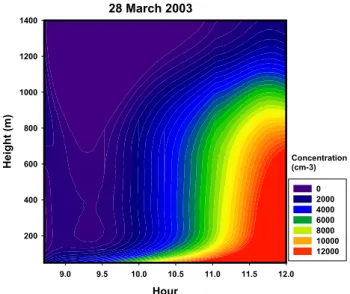
A total of 24 aircraft profiles were conducted to charac-terise the evolution of the boundary layer aerosol during the nucleation event and to identify where the particles are most likely to be formed. An interpolated composite of particle concentration and evolution through the duration of the three flights is shown in Fig. 5. The data shows that new parti-cles are first formed close to the surface, and that the layer of 3–10 nm particles then evolves together with the growth of the mixed layer. (A careful examination of Figs. 4 and 5 would appear to suggest that the particle plume extends above the mixed layer after about 11 a.m.; however individ-ual profiles shown in O’Dowd et al. (2008), confirm that
Concentration (cm-3) Hour 9.0 9.5 10.0 10.5 11.0 11.5 12.0 H e ig h t (m ) 200 400 600 800 1000 1200 1400 0 2000 4000 6000 8000 10000 12000 28 March 2003 μ
Fig. 5. Interpolated contour plot of total particle (3 nm–1 µm) con-centration variation with height and time of day. The first occur-rence of particle production is seen at the lowest levels after which they gradually fill the whole mixed layer.
the particle plume was all the time within the mixed layer. Apparently, the regional variability of the boundary layer structure was larger than suggested by Fig. 4, presumably due to different heat fluxes over lake and canopy surfaces. One should also note that the apparent “smoothness” of the aerosol abundance shown in Fig. 5 is partly caused by aver-aging over many profiles and by contouring artifacts in this type of plot).
As noted above, there are no strong SO2 sources nearby which could cause SO2concentrations to decrease uniformly with height. Furthermore, sulphuric acid concentrations in Hyyti¨al¨a are generally so low that they can only explain a minor fraction of observed particle growth (e.g. Boy et al., 2005). Taken together, these facts demonstrate that mono-and sesquiterpenes, rather than SO2, regulate the evolution of the fresh particle concentrations.
A further demonstration of the canopy influence was ob-tained from a horizontal flight from the Hyyti¨al¨a area to the coast and out over the Gulf of Bothnia (thus moving upwind of the forest canopy). No nucleation was observed over the frozen sea once out of the forest canopy region, showing that production of particles with diameters larger than 3 nm is confined to regions influenced by the canopy.
4 Conclusions
Our aim during the 2003 QUEST campaign was to obtain extensive chemical information of the composition of parti-cles in the widest possible size range, and to use aircraft in characterising the spatial and temporal evolution of nucle-ation events. In order to study aerosol chemistry, we used an array of techniques including aerosol mass spectrometry, several analytical techniques for aerosol samples, and tan-dem differential mobility analysis. In this way we were able to obtain information of similarities in the chemical features of particles in the 10 nm–10 µm size range during and after nucleation events.
During nucleation events, the aerosol chemical character-istics as determined from impactor and filter samples were seen to be consistent with AMS mass spectra. Ethanol growth factors of 10 and 50 nm particles recorded during nu-cleation events correlated with gas phase MTOP concentra-tions, indicating that their organic compositions had similar features. Our results indicate that following nucleation, oxi-dation products of monoterpenes and possibly also sesquiter-penes are condensing on particles of all sizes in measurable quantities. Further, the correlation between gas-phase MTOP and particle growth rates indicates that the VOC oxidation products dominate particle growth. This is reflected in our aircraft results, which show that the first observable parti-cles in the start of the nucleation event emerge close to the VOC source, in this case the forest canopy. As SOA has been very widely observed in other non-boreal environments, the growth of freshly formed particles to CCN active sizes may well be governed by the availability and composition of the SOA material available in that environment.
Acknowledgements. This work was supported by the European
Commission under contract EVK2-CT2001-00127 (QUEST) and by the Academy of Finland.
Edited by: J. G. Murphy
References
Allan, J. D., Jimenez, J. L., Williams, P. I., Alfarra, M. R., Bower, K. N., Jayne, J. T., Coe, H., and Worsnop D. R.: Quantitative sam-pling using an Aerodyne aerosol mass spectrometer – 1. Tech-niques of data interpretation and error analysis, J. Geophys. Res., 108, 4090, doi:10.1029/2002JD002358, 2003.
Allan, J. D., Coe, H., Bower, K. N. Alfarra, M. R., Delia, A. E., Jimenez, J. L., Middlebrook, A. M., Drewnick, F., Onasch, T. B., Canagaratna, M. R., Jayne, J. T., and Worsnop, D. R.: A generalised method for the extraction of chemically resolved mass spectra from Aerodyne aerosol mass spectrometer data, J. Aerosol. Sci., 35, 909–922, 2004.
Allan, J. D., Alfarra, M. R., Bower, K. N., Coe, H., Jayne, J. T., Worsnop, D. R., Aalto, P. P, Kulmala, M., Hy¨otyl¨ainen, T., Cav-alli, F., and Laaksonen, A.: Size and composition measurements of background aerosol and new particle growth in a Finnish forest
2664 A. Laaksonen et al.: VOC oxidation products and new particle formation
during QUEST 2 using an Aerodyne Aerosol Mass Spectrome-ter, Atmos. Chem. Phys., 6, 315–327, 2006,
http://www.atmos-chem-phys.net/6/315/2006/.
Andersson-Sk¨old, Y. and Simpson, D.: Secondary organic aerosol formation in northern Europe: A model study, J. Geophys. Res., 106, 7357–7374, 2001
Anttila, P., Hy¨otyl¨ainen, T., Heikkil¨a, A., Kulmala, M., and Riekkola, M.-L.: Determination of organic acids in aerosol par-ticles from a coniferous forest by liquid chromatography-mass spectrometry, J. Sep. Sci., 28, 337–346, 2005.
Boy, M., Pet¨aj¨a, T., DalMaso, M., Rannik, ¨U, Rinne, J., Aalto, P., Laaksonen, A., Vaattovaara, P., Joutsensaari, J., Hoffmann, T., Warnke, J., Apostolaki, M., Stephanou, E. G., Tsapakis, M., Kouvarakis, A., Pio, C., Carvalho, A., R¨ompp, A., Moortgat, G., Spirig, C., Guenther, A., Greenberg, J., Ciccioli, P., and Kulmala, M.: Overview of the field measurement campaign in Hyyti¨al¨a, August 2001 in the framework of the EU project OSOA, Atmos. Chem. Phys., 4, 657–678, 2004,
http://www.atmos-chem-phys.net/4/657/2004/.
Boy, M., Kulmala, M., Ruuskanen, T. M., Pihlatie, M., Reissell, A., Aalto, P. P., Keronen, P., Dal Maso, M., Hellen, H., Hakola, H., Jansson, R., Hanke, M., and Arnold, F.: Sulphuric acid clo-sure and contribution to nucleation mode particle growth, Atmos. Chem. Phys., 5, 657–678, 2005,
http://www.atmos-chem-phys.net/5/657/2005/.
Cavalli, F., Facchini, M. C., Decesari, S., Emblico, L., Mircea, M., Jensen, N. R., and Fuzzi, S.: Size-segregated aerosol chemi-cal composition at a boreal site in southern Finland, during the QUEST project, Atmos. Chem. Phys., 6, 993–1002, 2006, http://www.atmos-chem-phys.net/6/993/2006/.
Jayne, J. T., Leard, D. C. Zhang, X. F., Davidovits, P., Smith, K. A., Kolb, C. E., and Worsnop, D. R.: Development of an aerosol mass spectrometer for size and composition analysis of submi-cron particles, Aerosol Sci. Technol., 33, 49–70, 2000.
Jimenez, J. L., Jayne, J. T., Shi, Q., Kolb, C. E., Worsnop, D. R., Yourshaw, I., Seinfeld, J. H., Flagan, R. C., Zhang, X., Smith, K. A., Morris, J. W., and Davidovits, P.: Ambient aerosol sam-pling using the Aerodyne Aerosol Mass Spectrometer, J. Geo-phys. Res., 108, 8425, doi:10.1029/2001JD001213, 2003. Joutsensaari, J., Vaattovaara, P., Vesterinen, M., H¨ameri, K., and
Laaksonen, A.: A novel tandem differential mobility analyzer with organic vapor treatment of aerosol particles, Atmos. Chem. Phys., 1, 51–60, 2001,
http://www.atmos-chem-phys.net/1/51/2001/.
Joutsensaari, J., Toivonen, T., Vaattovaara, P., Vesterinen, M., Veps¨al¨ainen, J., and Laaksonen, A.: Time-resolved growth be-havior of acid aerosols in ethanol vapor with a tandem-DMA technique, J. Aerosol Sci., 35, 851–867, 2004.
Junkermann, W.: An ultralight aircraft as platform for research in the lower troposphere: system performance and first results from radiation transfer studies in stratiform aerosol layers and broken cloud conditions, J. Ocean. Atmos. Techn., 18, 934–946, 2001. Junkermann, W.: The actinic UV-radiation budget during the
ES-COMPTE campaign 2001: Results of airborne measurements with the microlight research aircraft D-MIFU, Atmos. Res., 74, 461–475, 2005.
Kallio, M., Jussila, M., Rissanen, T., Anttila, P., Hartonen, K., Reis-sel, A., Vreuls, R., Adahcour, M., and Hy¨otyl¨ainen, T.: Com-prehensive Two-Dimensional Gas Chromatography Coupled to
Time of Flight Mass Spectrometry (GC×GC-TOFMS) in the Identification of Organic Compounds in Atmospheric Aerosols from Coniferous Forest, J. Chromatogr. A, 1125, 234–243, 2006. Kavouras, I. G., Mihalopoulos, N., and Stephanou, E. G.: Forma-tion of atmospheric particles from organic acids produced by forests, Nature 395, 683–686, 1998.
Komppula, M., Lihavainen, H., Kerminen, V.-M., Kulmala M., and Viisanen Y.: Measurements of cloud droplet activation of aerosol particles at a clean subarctic background site, J. Geophys. Res., 110, D06204, doi:10.1029/2004JD005200, 2005.
Kulmala, M., Pirjola, L., and M¨akel¨a. J.M., Stable sulphate clus-ters as a source of new atmospheric particles.Nature 404, 66-69 (2000).
Kulmala, M., H¨ameri, K., Aalto, P. P., M¨akel¨a, J. M., Pirjola, L., Nilsson, E. D., Buzorius, G., Rannik, ¨U., Dal Maso, M., Seidl, W., Hoffmann, T., Janson, R., Hansson, H.-C., Viisanen, Y., Laaksonen, A., and O’Dowd, C.: Overview on the international project on biogenic aerosol formation in the boreal forest (BIO-FOR), Tellus, 53B, 324–343, 2001.
Kulmala, M.: How particles nucleate and grow, Science, 302, 1000– 1001, 2003.
Kulmala, M., Suni, T., Lehtinen, K. E. J., Dal Maso, M., Boy, M., Reissell, A., Rannik, ¨U, Aalto, P., Keronen, P., Hakola, H., B¨ack, J., Hoffmann, T., Vesala, T., and Hari, P.: A new feedback mech-anism linking forests, aerosols and climate, Atmos. Chem. Phys., 4, 557–562, 2004,
http://www.atmos-chem-phys.net/4/557/2004/.
Laaksonen, A., Hamed, A., Joutsensaari, J., Hiltunen, L., Cavalli, F., Junkermann, W., Asmi, A., Fuzzi, S., and Facchini, M. C.: Cloud condensation nucleus production from nucleation events at a highly polluted region, Geophys. Res. Lett., 32, L06812, doi:10.1029/2004GL022092, 2005.
O’Dowd, C. D., Aalto, P., H¨ameri, K., Kulmala, M., and Hoffmann, T.: Atmospheric particles from organic vapours, Nature, 416, 497–498, 2002.
O’Dowd, C. D., Yoon, Y. J., Junkerman, W., Aalto, P., Kulmala, M., Lihavainen, H., and Viisanen, Y.: Airborne measurements of nucleation mode particles II: boreal forest nucleation events, Atmos. Chem. Phys. Discuss., 8, 2821–2848, 2008,
http://www.atmos-chem-phys-discuss.net/8/2821/2008/. Parshintsev, J., Nurmi, J., Kilpel¨ainen, I., Hartonen, K., Kulmala,
M., Riekkola, M.-L.: Preparation of β-caryophyllene oxidation products and their determination in ambient aerosol samples, Anal. Bioanal. Chem. 390, 913–919, 2008.
Pet¨aj¨a, T., Kerminen, V.-M., H¨ameri, K., Vaattovaara, P., Joutsen-saari, J., Junkermann, W., Laaksonen, A., and Kulmala, M.: Ef-fects of SO2oxidation on aerosol hygroscopicity, Atmos. Chem.
Phys., 5, 767–779, 2005,
http://www.atmos-chem-phys.net/5/767/2005/.
Rissanen, T., Kallio, M., Hy¨otyl¨ainen, T., Kulmala, M., and Riekkola, M.-L.: Characerization of organic compounds in aerosol particles during particle formation in rural atmosphere by GC-MS, Chemosphere, 64, 1185–1195, 2006
Sellegri, K., Umann B., Hanke, M., and Arnold, F.: Deployment of a ground-based CIMS apparatus for the detection of organic gasess in the boreal fores during the QUEST campaign, Atmos. Chem. Phys., 5, 357–372, 2005a,
http://www.atmos-chem-phys.net/5/357/2005/.
Sellegri, K., Hanke, M., Umann, B., Arnold, F., and Kulmala, M.:
Measurement of organic gases during aerosol formation events in the boreal forest atmosphere during QUEST, Atmos. Chem. Phys., 5, 373–384, 2005b,
http://www.atmos-chem-phys.net/5/373/2005/.
Topping, D., Coe, H., McFiggans, G., Burgess, R., Allan, J., Al-farra, M.R., Bower, K., Choularton, T.W., Decesari, S., and Fac-chini, M. C.: Aerosol chemical characteristics from sampling conducted on the Island of Jeju, Korea during ACE Asia, Atmos. Environ., 38, 2111–2123, 2004.
Vaattovaara, P., R¨as¨anen, M., Kuhn, T., Joutsensaari, J., and Laak-sonen, A.: A method for detecting the presence of organic frac-tion in nucleafrac-tion mode sized particles, Atmos. Chem. Phys., 5, 3277–3287, 2005,
http://www.atmos-chem-phys.net/5/3277/2005/.
Zhang, Q., Stanier, C. O., Canagaratna, M. R., Jayne, J. T., Worsnop, D. R., Pandis, S. N., and Jimenez, J. L.: Insights into Nucleation Burst and Particle Growth in Pittsburgh Based on Aerosol Mass Spectrometry, Environ. Sci. Technol., 38, 4797– 4809, 2004.