HAL Id: hal-00295304
https://hal.archives-ouvertes.fr/hal-00295304
Submitted on 29 Jul 2003
HAL is a multi-disciplinary open access
archive for the deposit and dissemination of
sci-entific research documents, whether they are
pub-lished or not. The documents may come from
teaching and research institutions in France or
abroad, or from public or private research centers.
L’archive ouverte pluridisciplinaire HAL, est
destinée au dépôt et à la diffusion de documents
scientifiques de niveau recherche, publiés ou non,
émanant des établissements d’enseignement et de
recherche français ou étrangers, des laboratoires
publics ou privés.
Ultrathin Tropical Tropopause Clouds (UTTCs): I.
Cloud morphology and occurrence
Th. Peter, B. P. Luo, M. Wirth, C. Kiemle, H. Flentje, V. A. Yushkov, V.
Khattatov, V. Rudakov, A. Thomas, S. Borrmann, et al.
To cite this version:
Th. Peter, B. P. Luo, M. Wirth, C. Kiemle, H. Flentje, et al.. Ultrathin Tropical Tropopause Clouds
(UTTCs): I. Cloud morphology and occurrence. Atmospheric Chemistry and Physics, European
Geosciences Union, 2003, 3 (4), pp.1083-1091. �hal-00295304�
www.atmos-chem-phys.org/acp/3/1083/
Chemistry
and Physics
Ultrathin Tropical Tropopause Clouds (UTTCs): I. Cloud
morphology and occurrence
Th. Peter1, B. P. Luo1, M. Wirth2, C. Kiemle2, H. Flentje2, V. A. Yushkov3, V. Khattatov3, V. Rudakov3, A. Thomas4,
S. Borrmann4, G. Toci5, P. Mazzinghi6, J. Beuermann7, C. Schiller7, F. Cairo8, G. Di Donfrancesco9, A. Adriani8,
C. M. Volk10, J. Strom11, K. Noone12, V. Mitev13, R. A. MacKenzie14, K. S. Carslaw15, T. Trautmann16,
V. Santacesaria17, and L. Stefanutti18
1Institute for Atmospheric and Climate Science, ETH Zurich, Switzerland
2Institute for Atmospheric Physics, DLR Oberpfaffenhofen, Germany
3Central Aerological Observatory, Moscow, Russia
4Institute for Atmospheric Physics, University of Mainz, Germany
5Quantum Electronics Institute, National Research Council (IEQ-CNR), Florence, Italy
6National Institute of Applied Optics, Florence, Italy
7Institute I: Stratosphere, Forschungszentrum J¨ulich GmbH, J¨ulich, Germany
8Institute for Atmospheric Science and Climate,CNR, Roma, Italy
9ENEA Casaccia, Roma, Italy
10Institut fr Meteorologie und Geophysik, Universit¨at Frankfurt, Germany
11Institute of Applied Environmental Research, Stockholm University, Sweden
12Department of Meteorology, Stockholm University, Sweden
13Observatoire cantonal, Neuchˆatel, Switzerland
14Environmental Science Department, Lancaster University, UK
15School of the Environment, University of Leeds, UK
16Institute of Meteorology, University of Leipzig, Germany
17IROE – CNR 11Nello Carrara”, Firenze, Italy
18Geophysica-GEIE – CNR”, Firenze, Italy
Received: 9 December 2002 – Published in Atmos. Chem. Phys. Discuss.: 19 March 2003 Revised: 25 June 2003 – Accepted: 25 June 2003 – Published: 29 July 2003
Abstract. Subvisible cirrus clouds (SVCs) may contribute to dehydration close to the tropical tropopause. The higher and colder SVCs and the larger their ice crystals, the more likely they represent the last efficient point of contact of the gas phase with the ice phase and, hence, the last dehydrating step, before the air enters the stratosphere. The first simultaneous in situ and remote sensing measurements of SVCs were taken during the APE-THESEO campaign in the western Indian ocean in February/March 1999. The observed clouds, termed Ultrathin Tropical Tropopause Clouds (UTTCs), belong to the geometrically and optically thinnest large-scale clouds in the Earth’s atmosphere. Individual UTTCs may exist for many hours as an only 200–300 m thick cloud layer just a few hundred meters below the tropical cold point tropopause,
covering up to 105km2. With temperatures as low as 181 K
these clouds are prime representatives for defining the water mixing ratio of air entering the lower stratosphere.
Correspondence to: B. P. Luo ([email protected])
1 Introduction
Cirrus clouds are an essential element in the Earth’s radi-ation budget due to their direct radiative forcing and their influence on the water budget in the middle and upper tro-posphere (Lohmann and Roeckner, 1995). Cirrus clouds in the vicinity of the tropical tropopause regions might in part be responsible for the dehydration of the uppermost tropo-sphere and therefore also for the water vapor mixing ratio in the lower stratosphere (Jensen et al., 1996 and 2001; Sher-wood and Dessler, 2000; Gettelman et al., 2001). For cir-rus clouds with particularly thin optical thickness, τ , Sassen et al. (1989) coined the term Subvisible Cirrus (SVC), and used τ < 0.03 as a visibility criterion. Previous studies have found SVCs with optical thicknesses typically in the range
10−3−10−2 (Heymsfield, 1986; Heymsfield and
McFar-quhar; 1996; Winker and Trepte, 1998; Wang et al., 1998; McFarquhar et al., 2000; Omar and Gardner, 2001), with oc-currence frequencies vanishing rapidly at even lower optical
1084 Th. Peter et al.: Ultrathin Tropical Tropopause Clouds (UTTCs)
Peter et al., Fig.1
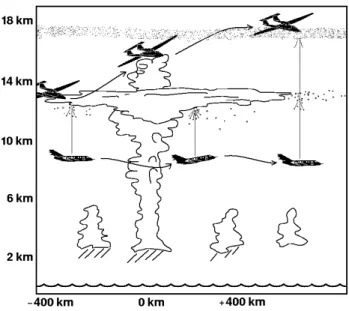
Fig. 1. Sketch of flight strategy of the Falcon (below 12 km) and
the Geophysica (up to 21 km). Both aircraft can travel at the same speed. On line evaluation of the Falcon lidar measurements allows to maneuver the Geophysica into extremely thin clouds, e.g. the UTTC shown at 17 km, which remain invisible to the Geophysica pilot.
thicknesses. First emerging climatological information on laminar cirrus based on remote (lidar, satellite) and in situ (aircraft) retrievals suggest that they are probably ubiquitous in the tropics independent of seasons (e.g. Wang et al., 1998; McFarquhar et al., 2000; Winker andTrepte, 1998).
In February and March 1999, the European airborne cam-paign APE-THESEO was performed from the Seychelles, 5◦S 55◦E, with the aim to investigate the effects of deep
con-vective events and of cirrus on the Upper Troposphere/Lower Stratosphere (UTLS) water budget in the western Indian ocean. This paper describes the morphology and occurrence frequencies of the particularly thin and high SVCs observed during APE-THESEO. The underlying particle counter mea-surements are described by Thomas et al. (2002). The details of the formation process of these clouds, how they are main-tained, and to what degree they may lead to dehydration of the upper troposphere and lower stratosphere is still uncer-tain. A mechanism for their maintenance and stabilization is described in the companion paper (Luo et al., 2003a). Upon cooling UTTCs are prone to dehydrating the air before it en-ters the tropical stratosphere, a mechanism described by Luo et al. (2003b).
2 APE-THESEO flight strategy
Two aircraft were employed during APE-THESEO and closely coordinated with each other: the low-flying Falcon, a German research aircraft equipped with a three-wave-lengths
lidar system (1064, 532, 354 nm backscatter ratios; 532 nm depolarization ratio), and the high-flying Geophysica, a Rus-sian research aircraft with various in-situ and short-range re-mote instruments for measuring particles (size distributions, water and nitric acid in the condensed phase, backscatter in-situ and between 300 m and 2500 m above the aircraft)
and trace gases (gas phase water, ozone, CO, N2O, CFC-11,
CFC-12, SF6). See Table 1 for an overview. For more
de-tailed descriptions of the Falcon lidar system see Wirth and Renger (1996) and of the Geophysica payload see Stefanutti et al. (1999).
The tandem deployment of the Falcon and the Geophysica has some unique features. The Falcon lidar system allows the detection of extremely thin cirrus structures, which can nei-ther be observed by ground-based lidar nor by the pilot of the high-flying aircraft. At 1064 nm wavelength the backscatter ratio is a sensitive indicator of the presence of thin clouds or aerosol layers, even when the simultaneous backscatter mea-surements at 532 nm and 354 nm show practically no indica-tion of a thin cloud feature. This is due to the lower Rayleigh backscatter by the air molecules (∝ λ−4), while the backscat-ter of ice particles is nearly independent of wavelength as the particles are much larger than all wavelengths. The lidar in-formation is available as on-line quick-look inin-formation dur-ing the flight. Owdur-ing to these capabilities the Falcon served as pathfinder for the Geophysica during APE-THESEO. The high flexibility of the Geophysica allows direct changes of altitude and flight direction according to inflight requests by the mission scientist onboard the Falcon, e.g. for obtaining controlled changes in altitude in steps of 50 m. The Fal-con, when throttled, can fly with the same speed (relative to ground) at 10–12 km as the Geophysica at 16–20 km, al-lowing simultaneous measurements on the same object, see Fig. 1. Alternatively, the Falcon can fly ahead with increas-ing distance from Geophysica when new space is to be ex-plored. For more information on the tandem flight options during APE-THESEO and during other campaigns see Peter et al. (2000).
The simultaneous remote sensing lidar measurement and the in-situ measurements provide new quantitative informa-tion on the microphysical and optical properties of cirrus clouds in the 3–4 km below the cold point tropopause, the so-called Tropical Tropopause Layer, TTL (Sherwood and Dessler, 2000). Clouds with a wide range of backscatter-ing ratios and various amounts of condensed water content were found. Besides SVCs and thicker visible cirrus clouds (Santacesaria et al., 2003), UTTCs were detected and could be characterized as a new, distinct class of ultrathin clouds with extremely low optical thickness, τ < 10−3(Luo et al., 2003b).
Table 1. M-55 Geophysica Scientific Payload during the APE-THESEO campaign
In situ Remote Sensing
Aerosol Instruments FSSP-300
Forward Scattering Spectrometer Probe to measure aerosol size distribu-tion in the range 0.1-20 µm.
MAL
Low-power (micro-joule) lidar to measure 532 nm backscatter and depolarization ratios within 1 km above the aircraft.
MAS
Miniaturized Aerosol Sampler (backscatter sonde) to measure 532 nm
backscatter and depolarization in the immediate vicinity of the aircraft. ABLE
High-power aerosol lidar 532 nm, 355 nm, upward or down-ward looking.
CVI-Package
Counter-flow Virtual Impactor to measure particles having a diameter larger than a critical value, which are then heated and evaporate. Eva-poration products are then analyzed by:
Ly-α water
Lyman-alpha instrument to measure the condensed phase water;
TDL
Tunable Diode Laser absorption spectroscopy for HNO3 and H2O.
Chemical Instruments FLASH
Ly-α hygrometer to measure water vapor in the uppermost troposphere and lower stratosphere; only gas phase, no condensed-phase water.
FISH
Ly-α hygrometer to measure water vapor in the UTLS, measures gas phase water plus condensed-phase water (enhanced by a factor 5).
GASCOD
UV-visible spectrometer to measure vertical columns of O3 and NO2, also suited to
measure the upward and downward radiation fluxes.
ACH
Frost point hygrometer.
FOZAN
Chemiluminescent ozone sensor to detect fast ozone variations.
SORAD
Solar radiometer to measure the integrated solar flux from the near UV to the near IR.
ECOC
Modified electrochemical ozone sonde.
HAGAR
Gas chromatograph to measure N2O, SF6, CFC-11 and CFC-12.
Table 1: M-55 Geophysica Scientific Payload during the APE-THESEO campaign.
Peter et al., Fig.2
5°S E A G B F D C 10°S
45°E 50°E 55°E
Fig. 2. Meteosat cloud image of western Indian ocean on 24
Febru-ary 1999 showing a tropical thunderstorm centered at 8◦S 46◦E, about 1000 km southwest of the Seychelles at 5◦S 55◦E (point A). Colors indicate brightness temperatures (i.e. approximately the temperature at the altitude below which the cloud becomes optically thick in the infrared): pink below 213 K; light blue below 208 K; dark blue below 203 K. Yellow and red line: tandem flight path of Falcon and Geophysica (except excursion to point E: Falcon only). Red flight legs: UTTCs detected remotely by Falcon lidar or in situ onboard Geophysica. Yellow flight legs: UTTCs either not present (parts between A and B and around E) or not detectable because of heavy precipitation (B-C) or window icing (partly between F and G). UTTCs cover a region of ∼105km2(D-E-F-G and on the way from A to B) and persist at least 3 h (around F).
3 Measurements
3.1 Overview
A total of seven scientific tandem flights were carried out during APE-THESEO, each 4–5 hours long, mostly employ-ing the Falcon in the pathfindemploy-ing mode. Figures 2–4 give an overview over one of these coordinated flights, which took place on 24 February 1999. This flight aimed at investigat-ing the microphysical properties of particle distributions in the TTL close to a deep convective system which was located about 950 km to the southwest of the Seychelles, see Fig. 2. In Fig. 3, the white curtain with cloud lidar images shows the Falcon measurements (flight level ∼10 km) and the black line (with arrows) is the Geophysica flight path (flight lev-els 14–18 km). In the vicinity of the tropical thunderstorm (from point B to C in Figs. 2 and 3), there are no lidar mea-surements due to heavy precipitation. On the other parts of the flight (C-D-F), an about 2 km thick visible cirrus deck was located between 12 to 14 km, which was directly con-nected with the anvil of the thunderstorm and might in part be outflow from this system. At greater distances from the storm (G) the visible cirrus cloud turns into an SVC layer at ∼14 km. Distinct and extensive UTTC layers were de-tected above 17 km altitude. The UTTCs are separated from the anvil clouds and other cirrus by 3–4 km vertical distance.
1086 Th. Peter et al.: Ultrathin Tropical Tropopause Clouds (UTTCs)
Peter et al., Fig.3
20 km 18 16 14 12 A G F E C B D
Fig. 3. Aerosol backscatter ratio at 1064 nm (i.e. Raer=R1064−1 = the backscatter coefficient of aerosol divided by that of cloud-free air)
measured by OLEX on the Falcon on the same flight as in Fig. 2. The measurement curtain is shown from 12 to 20 km altitude. Periods with no measurements (either due to heavy precipitation in the vicinity of the Cb or due to window icing) are marked by gray vertical lines. The Geophysica flight path is marked as black curve. The Geophysica followed the Falcon initially with 30–45 min delay, but after a northward excursion of the Falcon (to E) was flying exactly above it (from F on within a few tens of meters in the horizontal direction).
They are also disconnected from the cumulonimbus turrets, which reached a maximum altitude of 15 km, see Fig. 4 (see also Thomas et al., 2002). In some locations there is a UTTC double layer, probably related to a double tropopause (as of-ten observed in the Seychelles radio sondes).
The general pattern of thicker clouds below 15 km and very thin clouds above 17 km altitude without direct con-nection corroborates the concept of the TTL: deep convec-tion lifts large amounts of water to the lower edge of the TTL, but usually not deeply into it. Within the TTL the air rises slowly, mainly radiatively and without further convec-tive drive. Cirrus clouds may form within the TTL and affect the water vapor budget. Though suggestive, this picture does not anticipate the mechanisms of dehydration in the TTL. Deep convection might lead to air masses overshooting the buoyancy equilibrium height (hyperventilation), and conse-quently to cooling far below ambient temperatures. Provided that ice crystals grow to sufficient sizes and manage to sed-iment out of these air masses before they sink back to the equilibrium buoyancy level (with concomitant heating), hy-perventilation might lead to extremely dry air masses. This mechanism has first been advocated by Danielsen (1982) and is recently again promoted by Sherwood and Dessler (2000). Furthermore, Sherwood (2002) argues that condensation out-side of convection does not reset the water vapor to a lower value independent of convective influence. Whether the ice
particles in convective hyperventilation can grow to sizes large enough for rapid sedimentation is currently very un-clear. On the other hand, the measurements described in this work in combination with cirrus cloud modeling lead Luo et al. (2003b) to conclude that UTTCs may indeed be the final step in the dehydration sequence through which air passes on its way from the lower troposphere to the stratosphere.
3.2 Lidar measurement of UTTCs
During APE-THESEO lidar measurements on board the Fal-con were performed at 355 nm, 532 nm and 1064 nm. In addition, at 532 nm the depolarization ratio is measured, which is an indicator for the shape of the particles (spherical droplets versus non-spherical crystals). Aerosol backscat-tering ratios @ 1064 nm within UTTCs are in the range 1– 7, while the cloud layers remain practically invisible at @
532 nm, Raer532 < 0.2. This makes these particles hard to
detect, and standard aerosol lidar measurements @ 532 nm from the ground require very long integration times or do not detect UTTCs at all. We performed ground measurements during night with the Falcon lidar @ 1064 nm, and an inte-gration over several hours reveals the presence of the UTTCs as a faint signal below the tropopause.
In principle, it is easier to observe thin laminar clouds at the tropical tropopause when looking from above. The LITE experiment with an aerosol lidar @ 532 nm onboard
Peter et al., Fig.4
C U T T A U U C S
A B C D F G A
Fig. 4. In situ measurements onboard Geophysica on 24 February
1999, same flight as in Fig. 2 and 3. Upper panel: flight altitude (blue curve, left hand ordinate) and temperature (red curve, right hand ordinate) with a sketch of the cloud pattern as derived from the remote and in situ measurements. Lower panel: FSSP-300 particle volume (blue curve, left hand ordinate) and particle number density (black curve, right hand ordinate). Marks A-G in upper panel are equivalent to Fig. 2 and 3. Marks in lower panel: C = cirrus; U = UTTC; T = cumulonimbus turret; A = cirrus anvil; S = stratus cloud.
the space shuttle has demonstrated the existence of extensive laminar cirrus in the tropics all around the globe (Winker and Trepte, 1998). The clouds seen by LITE are of similar
thick-ness and altitude as UTTCs, but they find R532aer ≈ 3, and
consequently the optical thickness of these clouds is typi-cally one order of magnitude higher than UTTCs. Therefore, UTTCs would probably not be visible for LITE.
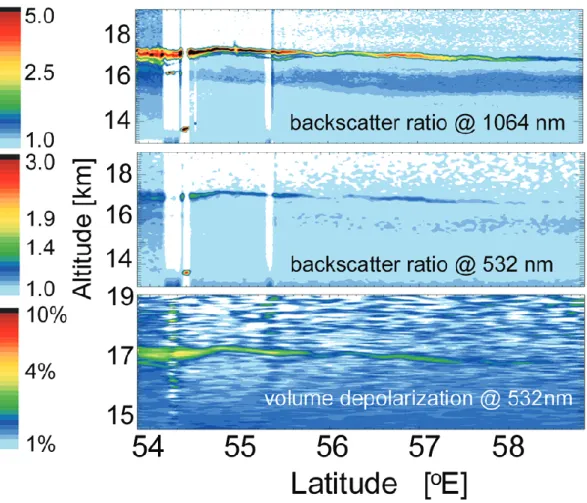
While on 24 February 1999 UTTCs are clearly discernible in the in situ data and the 1064 nm lidar backscatter (Figs. 3 and 4), the 532 nm backscatter and depolarization data are of-ten noisy because thicker cirrus between the aircraft and the UTTC lead to additional weakening of the in any case small UTTC signal (the Rayleigh signal from molecular scatterers is 16 times stronger at 532 nm than at 1064 nm). However, during a later flight on 27 February 1999 UTTCs were mea-sured remotely without other clouds disturbing the observa-tion, see Fig. 5. The total backscattering ratios @ 532 nm are smaller than 1.3, with a volume depolarization coefficient of 2–4%. The optical thickness @ 1064 nm of UTTCs can be
Table 2. Statistics of the total of 19 hours of OLEX in-flight
obser-vations covering some 14000 km of flight distance. Clouds which are optically so thick that it cannot be judged whether or not a UTTC is above the cloud are not included in this statistics
19 hours of airborne aerosol Fraction of observations lidar observations
Thicker cirrus (visible or SVC) 40% without UTTCs
Thicker cirrus and UTTCs 19% Only UTTCs, no thicker cirrus 12%
Clear sky 29%
estimated to range from 1.3 × 10⁻⁴to 8 × 10⁻⁴using a lidar
coefficient of 80 (the ratio between the extinction coefficient to backscattering coefficient) obtained by a T-matrix calcu-lation assuming that the ice particles are prolate spheroids with an aspect ratio ranging from 0.5 to 0.8 (Mishchenko, 1991; Carslaw et al., 1998). The aerosol backscattering ra-tios at shorter wavelengths (532 nm and 355 nm) are much smaller and are hardly distinguishable from the background. The small backscattering ratios @ 532 nm is corroborated by in situ measurements onboard Geophysica performed by the sideways-looking scatterometer MAS R532aer <0.2.
From Figs. 2, 3 and 5 based on lidar measurements the following characteristics of the UTTCs may be summarized: (a) The clouds are located only a few hundred meters below the tropical cold point tropopause with a vertical thick-ness of only 200–300 m, making them prime candidates for the last dehydration step of air during troposphere-to-stratosphere exchange.
(b) Their horizontal extension is several thousands of square kilometers.
(c) Aerosol backscattering ratios of UTTCs are extremely low (R1064aer =1 − 7, R532aer < 0.2), which makes these clouds currently best accessible by aircraft-borne lidar measurements @ 1064 nm.
(d) The lidar signal @ 532 nm of the UTTCs shows an aerosol depolarization signal of 10–30% from both OLEX (remotely from the Falcon) and MAS (in situ on Geophysica), indicating particles are of non-spherical shape.
(e) Within UTTCs, the backscattering ratio is relatively ho-mogeneous, despite the small backscattering ratio, call-ing for a non-trivial stabilization mechanism (Luo et al., 2003a).
(f) During the total of 19 hours of OLEX in-flight observa-tions on 7 mission flights, the UTTC coverage was 31%, see Table 2 for more statistical information.
1088 Th. Peter et al.: Ultrathin Tropical Tropopause Clouds (UTTCs)
Fig. 5. Lidar measurements during another APE-THESEO flight on 27 February 1999. Backscattering ratios at 1064 nm and 532 nm and
volume depolarization at 532 nm measured by OLEX on the Falcon.
3.3 In situ measurements
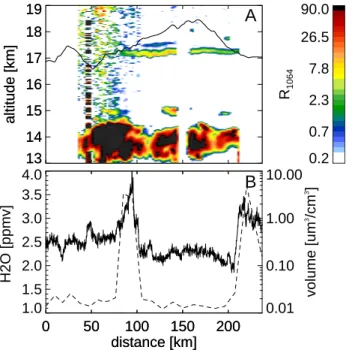
One section of the extensive UTTC shown in Figs. 2–4 is also shown in Fig. 6a, together with results from the in situ total water measurements (FISH) and the particle counter mea-surements (FSSP-300) on board of the Geophysica in Fig. 6b. The total water, measured by the Ly-α hygrometer FISH, is shown by the solid line. Extremely low water mixing ratios were found in the tropical tropopause region (2.0–2.5 ppmv in the cloud free areas). Subtracting the gas phase (obtained
from the cloud-free areas) from the total H2O pressure
mea-sured by FISH and averaging over the cloud altitude ranges (identified by FSSP, dashed line) yields about 100 ppbv of
H2O in the condensed phase, after accounting for
oversam-pling of particulate water in the cloud particles by a factor of
∼5 (particle oversampling is a common property of forward
looking hygrometers on aircraft, without which the cloud wa-ter could not be dewa-termined; the oversampling factor is esti-mated from the aerodynamic properties of the inlet configu-ration). The FSSP-300 measurements (Fig. 6b and 7) show a sudden increase in total particle volume when entering a UTTC. The FSSP-300 size distributions of UTTCs show a
distinct particle mode around r ≈ 5 − 6 µm and particle number densities of 5–10 particles per liter for r > 3 µm (Fig. 7), which are responsible for the measured high particu-late volume. The volume density measured by the FSSP-300 corresponds to a water vapor mixing ratio that condensed in the particulate phase of ∼40 ppbv, which is in fair agreement with the FISH measurement (the origin of the factor 2.5 dis-crepancy is not known, but given the accuracies of both in-struments this discrepancy is quite acceptable).
Given the small fraction of only 1–5% of the total wa-ter residing in the condensed phase the identification of the UTTCs as water ice particles must be questioned. An alter-native identification as nitric acid containing particles, e.g.
nitric acid trihydrate (NAT ≡ HNO3·3H2O) as known from
polar stratospheric clouds, would automatically result in very small amounts of condensate, as there is only a limited
amount of HNO3at the tropical tropopause. The existence of
NAT at the tropical tropopause has been suggested by Hervig and McHugh (2002). However, Luo et al. (2003a,b) address this question specifically and conclude that the UTTC parti-cles consist indeed of water ice. This conclusion is, besides
Peter et al., Figure 5 13 14 15 16 17 18 19 altitude [km] 13 14 15 16 17 18 19 altitude [km]
A
0.2 0.7 2.3 7.8 26.5 90.0 R1064 0 50 100 150 200 distance [km] 1.0 1.5 2.0 2.5 3.0 3.5 4.0 H2O [ppmv]B
0 50 100 150 200 distance [km] 0.01 0.10 1.00 10.00 volume [um 3 /cm 3 ]Fig. 6. Simultaneous lidar and in situ measurements of the UTTCs
between points D and F in Fig. 3. Panel A: the cloud lidar backscat-tering ratio @ 1064 nm. The black line shows the flight route of the Geophysica aircraft. Panel B: in situ measurements on board of Geophysica. Dashed line: volume in condensed phase measured by the FSSP-300 (right hand ordinate). Solid line: total water mea-sured by the hygrometer FISH (which oversamples particulate water by a factor of 5, left hand ordinate).
other arguments, corroborated by the counter-flow virtual impactor (CVI) measurements onboard of the Geophysica. The CVI has an integrated tunable diode laser spectrometer
(CVI-TDL) for the measurement of HNO3in the particulate
phase, but the instrument showed practically no particulate nitric acid during the campaign (not shown here, see Luo et al., 2003b), except for one flight into a tropical cyclone.
Vertical profiles of the in-situ measurements are shown in the companion paper (Luo et al., 2003a). On 24 January 1999 the tropopause over the western Indian ocean was ex-tremely cold (T ≈ 188 K) with a height of about 17.5 km. The UTTCs indicated by an enhancement in the ice volume were located at about 17.1 km, 400 m below the cold point tropopause. The air was subsaturated with respect to ice be-low the UTTCs and supersaturated above the UTTCs. In the cloud layer, the air was in equilibrium with ice. This obser-vation is important to explain the stability of these thin cloud layers, as we discuss in detail in the companion paper (Luo et al., 2003a).
3.4 Determination of UTTC condensed mass from lidar
measurements
The water mixing ratios, that condensed in the UTTCs, can also be estimated from the remote sensing lidar measurement
Peter et al., Figure 6
Fig. 7. Particle size distributions as function of (equivalent sphere)
radius r measured by the FSSP-300 on board of Geophysica on 24 February 1999. Open squares: measurements inside UTTCs from several cloud encounters (see Fig. 4 and Fig. 3 between points D and F). Lines without symbol: background aerosols in the immediate vicinity below or above UTTCs.
using the T-matrix method for the backscattering coefficients (Mishchenko,1991, Carslaw et al., 1998). The simulated
li-dar backscattering ratio @ 1064 of 1 ppbv H2O condensed
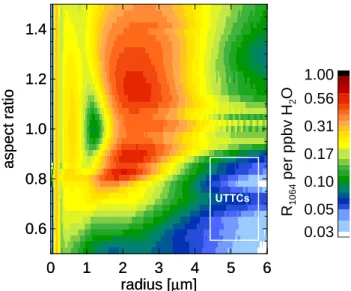
in ice particles is shown in Fig. 8. A temperature of 190 K is used for the calculation of the molecular number density of air. The size of the UTTC particles is 5–6 µm according to the in situ FSSP measurement. For particles with this size the lidar backscattering ratio of 1 ppbv of ice ranges from 0.04 to 0.2, depending on the aspect ratio (ratio between the axes perpendicular and parallel to the rotational symmetry). This leads to an ice water content of 5 to 25 ppbv for a cloud with backscattering ratio of unity @ 1064 nm. For the
ob-served UTTCs with R1064aer =1 − 7, this results in about 25–
170 ppbv of H2O that condensed as ice (for aspherical
parti-cles with aspect ratio = 0.5) or 5–70 ppbv (for nearly spher-ical or oblate particles). The same cloud was also sampled by the in situ instruments (Fig. 6), showing an ice water con-tent of 40–100 ppbv. The ice water concon-tent of 25–170 ppbv obtained from the lidar measurements, consistent with the in situ data, provided an aspect ratio of 0.5 for the ice parti-cles is assumed. A more spherical shape (aspect ratio >0.5) would lead to less ice water content. The analysis above sug-gests that the ice particles with r ≈ 5 µm may have a highly non-spherical shape. In the flight on 27 February 1999, even lower aerosol lidar backscatter ratios @ 1064 nm (1–2) over a larger area were found, indicating that the ice water content
1090 Th. Peter et al.: Ultrathin Tropical Tropopause Clouds (UTTCs)
Peter et al., Figure 7
0 1 2 3 4 5 6 radius [µm] 0.6 0.8 1.0 1.2 1.4 aspect ratio 0 1 2 3 4 5 6 radius [µm] 0.6 0.8 1.0 1.2 1.4 aspect ratio 0.03 0.05 0.10 0.17 0.31 0.56 1.00 R 1064 per ppbv H 2 O UTTCs
Fig. 8. Aerosol lidar backscattering ratio of 1 ppbv H2O condensed
as ice particles with radius and asphericity as indicated on the axes (aspect ratio defined as ratio between the axes perpendicular and parallel to the rotational symmetry). The aerosol backscatter is cal-culated by using the T-matrix method (Mishchenko, 1991) assum-ing that the particles are spheroids. The backscatterassum-ing ratio can be scaled to other ice water content by just multiplying the scale shown in the right hand side by the amount of the actual ice water content in ppbv. The radius given here is the mode radius (equiva-lent sphere) of a lognormal size distribution with mode width σ = 1.20. The white box in the lower right corner indicates the region of interest for UTTCs.
can be as low as 25 ppbv.
Hence, the three independent instruments agree with each other within a factor of 2.5, providing strong evidence that the total amount of condensed phase water is very small, 25– 100 ppbv.
4 Summary
UTTCs have the following characteristics: (i) the coverage of these clouds was found to be high (31%) during the APE-THESEO campaign in February/March 1999 in the western Indian Ocean; (ii) the vertical thickness of UTTCs are only 200–300 m; (iii) they reside only a few hundred meters below the cold point tropopause; (iv) their horizontal extent may reach thousands of square kilometers; (v) the inside of the cloud layer is characterized by a high degree of homogeneity; (vi) they consist of water ice particles with a condensed
mat-ter in the cloud particles of 25–100 ppbv H2O, corresponding
to only 1–5% of the total available water vapor; (vii) ice crys-tal radii are 5–6 µm, number densities 5–10 L−1.
The high degree of homogeneity, the large geographic ex-tent and the faint nature of UTTCs requires a stabilization mechanism, which is not necessary or known for other kinds
of clouds. This is treated in detail in the companion paper (Luo et al., 2003a). The unique combination of high altitude and low number density makes UTTCs highly suited to serve as drying agent during the last step of dehydration of air di-rectly before troposphere-to-stratosphere exchange. Luo et al. (2003b) investigate the conditions under which UTTCs serve this purpose. They conclude, that UTTCs are likely to
yield a lowering of 0.35 ppmv of H2O in the air exchanged
from the troposphere to the stratosphere in the tropics.
Acknowledgements. We are grateful to Stefano Balestri (APE)
and Heinz Finkenzeller (DLR) for their organizational and infra-structural work, without which the campaign would not have taken place. We thank the pilots on both aircraft, Marcus Scherdel, Stefan Grillenbeck, Oleg Chtchepetkov and Alexander Bestchastnov, for their extremely flexible approach to even the most difficult tasks. Further we thank Gilbert Faure (Director General of Civil Avia-tion) and Alain Volcere (Airport Manager – operations – DCA Sey-chelles) of the Seychelles Airport authorities for their unbureau-cratic support in all phases of the campaign. We are grateful to Adrian Tompkins at ECMWF and Marcia Baker at the University of Washington for fruitful discussions. Finally, we thank the Eu-ropean Commission for funding the APE-THESEO campaign, and several national agencies for additional support.
References
Carslaw, K. S., Wirth, M., Tsias, A., Luo, B. P., D¨ornbrack, A., Leutbecher, M., Volkert, H., Renger, W., Bacmeister, J. T., and Peter, Th.: Particle microphysics and chemistry in remotely ob-served mountain polar stratospheric clouds, J. Geophys. Res., 100, 5785–5796, 1998.
Danielsen, E. F.: A dehydration mechanism for the stratosphere, Geophys. Res. Lett., 9, 605–608, 1982.
Gettelman, A., Holton, J. R., and Douglass, A. R.: Simulations of water vapor in the lower stratosphere and upper troposphere, J. Geophys. Res., 105, 9003–9023, 2000.
Hervig, M. and McHugh, M.: Tropical Nitric Acid Clouds, Geo-phys. Res. Lett., 29, 10.1029/2001GL014271, 2002.
Heymsfield, A. J.:, Ice particles observed in a cirriform cloud at
−85◦C and implications for polar stratospheric clouds, J. Atmos. Sci., 43, 851–855, 1986.
Heymsfield, A. J. and McFarquhar, G. M.: high albedos of cirrus in the tropical Pacific warm pool: Microphysical interpretations from CEPEX and from Kwajalein, Marshall islands, J. Atmos. Sci., 53, 2424–2245, 1996.
Jensen, E. J., Toon, O. B., Pfister, L., and Selkirk, H. B.: Dehy-dration of the upper troposphere and lower stratosphere by sub-visible cirrus clouds near the tropical tropopause, Geophys. Res. Lett., 23, 825–828, 1996.
Jensen, E. J., Pfister, L., Ackerman, A. S., Toon, O. B., and Tabazadeh, A.: A conceptual model of the dehydration of air due to freeze-drying by optically thin, laminar cirrus rising slowly across the tropical tropopause, J. Geophys. Res., 106, 17 237– 17 252, 2001.
Lohmann, U. and Roeckner, E.: Influence of cirrus cloud radiative forcing on climate and climate sensitivity in a general circulation model, J. Geophys. Res., 100 , 16 305–16 324, 1995.
Luo, B. P., Peter, Th., Wernli, H., et al.: Ultrathin Tropical Tropopause Clouds (UTTCs): II. Stabilization and Destabiliza-tion Mechanisms, Atmos. Chem. Phys., this issue, 2003a. Luo, B. P., Peter, Th., Fueglistaler, S., et al.: Dehydration
poten-tial of ultrathin clouds at the tropical tropopause, Geophys. Res. Lett., 30, doi : 10.1029/2002GL016737, 2003b.
Mishchenko, M. I.: Light scattering by randomly oriented axially symmetric particles, J. Opt. Soc. Am., 8, 871–882, 1991. McFaquhar, G. M., Heymsfield, A. J., Spinhirne, J., and Hart, B.:
Thin and subvisual tropopause tropical cirrus: Observations and radiative impacts, J. Atmos. Sci., 57, 1841–1853, 2000. Omar, A. H. and Gardner, C. S.: Observation by the Lidar In-Space
Technology Experiment (LITE) of high altitude cirrus clouds over the equator in regions exhibiting extremely cold tempera-tures, J. Geophys. Res., 106, 1227–1236, 2001.
Peter, Th., Meilinger, S. K., and Carslaw, K. S.: Quasi-Lagrangian Measurements of Clouds at and above the Tropopause, SPARC Newsletter No. 12, 2000.
Santacesaria, V., Carla, R., MacKenzie, R. A., Adriani, A., Cairo, F., Didonfrancesco, G., Kiemle, C., Redaelli, G., Beuermann, J., Schiller, C., Peter, Th., Luo, B. P., Wernli, H., Ravegnani, F., Ulanovsky, A., Yushkov, V., Sitnikov, N., Balestri, S., and Ste-fanutti, L.: Clouds at the tropical tropopause: a case study during the APE-THESEO campaign over the western Indian Ocean, J. Geophys. Res., 108, 10.1029/2002JD002166, 2003.
Sassen, K., Griffin, M. K., and Dodd, G. C.: Optical-scattering and microphysical properties of subvisual cirrus clouds, and climate
implications, J. Appl. Meteorol., 28, 91–98, 1989.
Sherwood, S. C. and Dessler, A. E.: On the control of stratospheric humidity, Geophy. Res. Lett., 27, 2513–2516, 2000.
Sherwood, S. C.: A Microphysical Connection Among Biomass Burning, Cumulus Clouds, and Stratospheric Moisture, Science, 295, 1272–1275, 2002.
Stefanutti, L., Sokolov, L., Balestri, S., MacKenzie, A. R., and Khattatov, V.: The M-55 Geophysica as a platform for the Air-borne Polar Experiment, J. Ocean Atm. Tech., 16, 1303–1312, 1999.
Thomas, A., Borrmann, S., Kiemle, Ch., Cairo, F., Volk, M., Beuermann, J., Lepuchov, B., Santacesaria, V., Matthey, R., Rudakov, V., Yushkov, V., MacKenzie, A. R., and Stefanutti, L.: In situ measurements of background aerosol and subvisible cirrus in the tropical tropopause region, J. Geophys. Res., 107, 2001jd001385, 2002.
Wang, P. H., Minnis, P., McCormick, M. P., Kent, G. S., Yue, G. K., Young, D. F., and Skeens, K. M.: A study of the vertical struc-ture of tropical (20◦S–20◦N) optically thin clouds from SAGE II observations, Atmos. Res., 47/48, 599–614, 1998.
Winker, D. M. and Trepte, C. R.: Laminar cirrus observed near the tropical tropopause by LITE, Geophys. Res. Lett., 25, 3351– 3354, 1998.
Wirth, M. and Renger, W.: Evidence of large scale ozone depletion within the Arctic polar vortex 94/95 based on airborne LIDAR measurements, Geophys. Res. Lett., 23, 813–816, 1996.