MIT LIBRARIES
Digitized
by
the
Internet
Archive
in
2011
with
funding
from
Boston
Library
Consortium
IVIember
Libraries
DE\A/BY
Massachusetts
Institute
of
Technology
Department
of
Economics
Working
Paper
Series
COUNTRY
PORTFOLIOS^
Aart
Kraay,
The World
Bank
Norman
Loayza,
Banco
Central
de Chile
and
The World
Bank
Luis S
erven,
The
World
Bank
Jaume
Ventura,
MIT
Working
Paper
00-16
July
2000
Room
E52-251
50
Memorial
Drive
Cambridge,
MA
02142
This
paper
can
be
downloaded
without
charge
from
the
Social
Science
Research Network
Paper
Collection
at'M^^'CHUSETTSiNSTlTUTE
OFTECHNOLOGY
OCT
2 5Massachusetts
Institute
of
Technology
Department
of
Economics
Working Paper
Series
COUNTRY
PORTFOLIOS^
Aart Kraay,
The
World
Bank
Norman
Loayza,
Banco
Central
de
Chile
and
The
World Bank
Luis
Serven,
The
World
Bank
Jaume
Ventura,
MIT
Working Paper
00-16
July
2000
Room
E52-251
50
Memorial
Drive
Cambridge,
MA
02142
This
paper
can
be downloaded
without
charge from
the
Social
Science
Research Network Paper
Collection
atAbstract
How
do
countries holdtheirfinancial wealth?We
constructanew
databaseof
countries' claimson
capital locatedathome
and
abroad,and
internationalborrowingand
lending,covering 68countries
from
1966to 1997.We
find that asmallamount
ofcapital flows from richcountries topoor
countries. Countries' foreign assetpositions areremarkablypersistent, and mostlytaketheform
offoreign loansratherthan foreign equity.To
interpretthese facts,we
build asimplemodel
ofintemafional capital flo9wsthathighlights the interplaybetween
diminishingreturns, production riskand
sovereign risk.We
show
that in the presence ofreasonable diminishingreturns and productionrisk, the probabilitythatinternational crises occurtwice a centuryis
enough
to generate a setof counfryportfolios that areroughlyconsistentwiththe data.
*We
thankMark
Aguiar,Daron Acemoglu,
Giancarlo Corsetti, Raquel Fernandez, RobertE.Lucas
andMark
Wright for insightfulcomments
on
aprevious draft andGian Maria
Milesi-Ferretti for his advice inthe construction of ourdataset.
We
are also grateful toCesarCalderon,Alex
Karaivanov,George Monokroussos,
andRashmi
Shankarforexcellentresearchassistance.The
opinionsexpressedhere are the authors'anddo
not necessarilyreflectthoseoftheWorld
Bank, itsexecutive directors, or the countriestheyrepresent. Financial support
from
theRegional Studies
Program
oftheLatm
American Region
oftheWorld Bank
is gratefullyIntroduction
How
do
countries hold theirfinancial wealth?Our
objective is to provide adescription ofcountry portfolios
and
advance
a parsimonious explanation oftheirmain
features.By
country portfolio,we
refer tothefinancial wealth ofthe countryand
how
it is distributed across holdings ofdomesticcapitaland
variousforeign assets.By
the net foreign assets ofa country,
we
refer tothe country's holdings offoreign equityand
loansminus
foreigners' holdings ofdomesticequityand
loans.We
first turn tothedata
and
ask:How
large are netforeign asset positions?What
countrycharacteristicsseem
tobe
associatedwith positive netforeign asset positions?How
persistent are netforeign asset positions?What
is the relativeimportance of foreign loansand
equity?Withthe
answers
athand,we
go
to the theoryand
ask:Why?
To
determinethemain
features ofcountry portfolios,we
constructanew
databaseon
foreigners' holdings ofdomestic equityand
loans,and
domesticresidents' holdings offoreign equity
and
loans.Our sample
covers the period1966-1997 and
includes68
countriesthat accountfor over90 percent ofworld productionand
trade. Constructing thisdatabase
forces us tochoose
among
fragmentaryand
imperfect sources of information
and
thenmake
(heroic?) assumptionson
how
toreconcile
them and
fill in the gaps.^ Despitethis,we
feel confidentthe inferenceswe
draw
fromthis data are robust. In fact, there is nothing subtle aboutthe empiricalregularities
we
highlight here.The
following are all verystriking features ofthe data:1. Net foreignasset positions as a share ofwealth are small in absolute value
and
negative for
most
countries.Roughly 80
percent ofthe observations in oursample
consist ofcountries
whose
net foreign assets as ashare ofwealth are less than20
percentin absolute value.We
alsofindthat the net foreign asset position isnegative forabout
80
percent oftheobservations in our sample.^ See Sinn
[1990], Rider [1994] andLane and Milesi-Ferretti[1999] foralternativesourcesof data onforeignassetpositions.
Introduction
How
do
countries hold theirfinancial wealth?Our
objective is to provide adescription of country portfolios
and advance
aparsimonious explanation oftheirmain
features.By
countryportfolio,we
refertothefinancial wealth ofthe countryand
how
it is distributed across holdings ofdomesticcapitaland
variousforeign assets.By
the net foreign assetsofa country,
we
referto thecountry's holdings of foreign equityand
loansminus
foreigners' holdingsofdomestic equityand
loans.We
firstturn tothedata
and
ask:How
large are netforeign asset positions?What
country characteristicsseem
tobe
associated with positive netforeign asset positions?How
persistentarenetforeign asset positions?
What
is therelative importance offoreign loansand
equity?Withthe
answers
at hand,we
go
tothe theoryand
ask:Why?
To
determinethemain
featuresofcountry portfolios,we
constructanew
database on
foreigners' holdings ofdomestic equityand
loans,and
domesticresidents' holdings offoreign equity
and
loans.Our sample
covers the period1966-1997
and
includes68
countries that accountforover90
percent ofworld productionand
trade. Constructing thisdatabase
forcesus tochoose
among
fragmentaryand
imperfectsources of information
and
thenmake
(heroic?) assumptionson
how
toreconcile
them and
fill in the gaps.^ Despite this,we
feel confident the inferenceswe
draw
from this data are robust. Infact, there is nothing subtle aboutthe empiricalregularities
we
highlighthere.The
following areall verystriking features ofthe data:1. Net foreign asset positions as a shareofwealth are small in absolute value
and
negativefor
most
countries.Roughly 80
percentofthe observations in oursample
consistofcountries
whose
netforeign assets as a shareofwealth are lessthan20
percent in absolutevalue.We
alsofindthat the net foreign asset position isnegative for about
80
percentofthe observations in our sample.^
See
Sinn[1990], Rider [1994] and Lane and Milesi-Ferretti [1999] foralternative sources of data onforeign assetpositions.
2.
There
is a strong positive relationshipbetween
financial wealthand
the net foreign asset position in a cross-section ofcountries. In particular,we
find thatwhen
financial wealth doubles, the share of netforeign assets in wealth increasesbythree to six percentage points. Cross-country variation in financial wealth
seems
to explain (in a statistical sense)most
ofthevariation in net foreign assetpositions,
even
after controlling for aset ofvariablesthat aredesigned to capturecross-country differences in aggregate production functions.
3.
The
share ofnetforeign assets in wealth is very persistent overtime.A
simpleregression ofthis share
on
its lagged value delivers a slope coefficient of0.98and
a R^ of93 percent. Since
we
find thatbetween
40
percentand 70
percentofthevariation in
changes
in netforeign assets canbe
attributed tochanges
in relativewealth, it
seems
reasonable to conclude that persistence in relative wealth isan
importantsource ofpersistence in foreign assets.
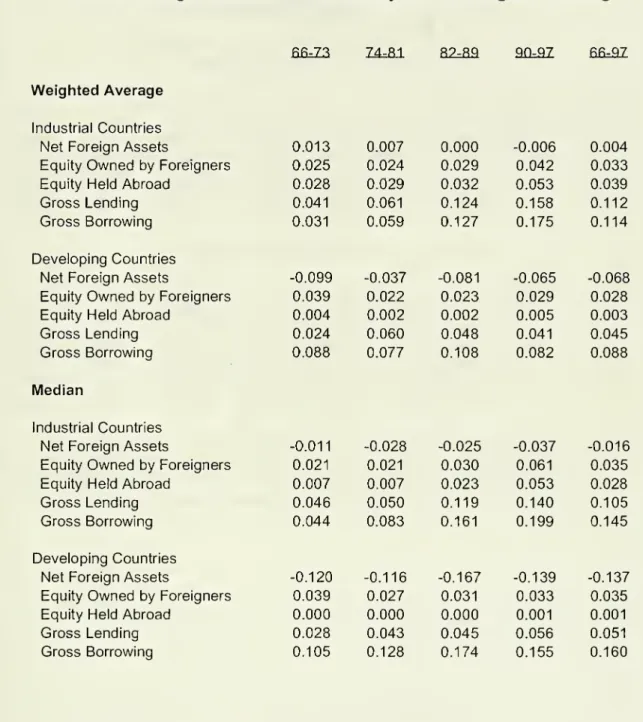
4.
Gross
foreign asset positions are smalland
consist mostly offoreign loans ratherthan foreign equity. In developing countries, foreign equity assets
and
liabilitiesare roughly 0.3
and
2.8 percent ofwealth, while foreign loan assetsand
liabilitiesaccountfor4.5 percent
and
8.8 percent ofwealth. In industrial countries, foreignequity assets
and
liabilities are roughly 3.3and
3.9 percent ofwealth, whileforeign loan assets
and
liabilitiesaccountfor 1 1 percent ofwealth each.To
sum
up,we
observe that net foreign asset positions are small relative towealth
and
tend to be negative, exceptfor afew
rich countries.These
net foreignasset positions are remarkably persistent as afraction ofwealth,
and
mostly consistofforeign loans rather thanforeign equity holdings. This picture that
emerges
fromthe data is so clear that
we
think itshould constitute themain
target ofany
successfultheoryof international capital flows.
It
seems
safeto argue that such a theory requires at leasttwo ingredients.To
explain the strong positive association
between
wealthand
netforeign assetto
move
from richto poor countries. Natural candidatesfor this role are diminishingreturns atthecountry level
and
country-specific production risk. If either ofthese twoforces are present, the risk-adjusted rate of return to capital declines as
more
capitalis invested in a country, creating
an
incentive to investin countries thathave
littlecapital. Inthe
absence
ofa counten/ailing force, this incentivewould onlybe
eliminated if capital stocks
were
equalized across countries.Hence
the theoryneeds
asecond
ingredient to explainwhy
net foreign assetpositionsare so small.^
A
popularview isthatthetheoryjustneeds
to recognizethatrich countries
have
betteraggregate productionfunctions,and
this iswhy
investorskeep most
oftheircapital in rich countrieseven
in the presence ofdiminishing returnsand
production risk. While this is likelyto betrue tosome
extent,we
look elsewhereforthe
second
ingredient ofthetheory, forthree reasons. First,we
findthat standardvariables
we
thinkare associated with betteraggregate production functions(human
capital, quality ofinstitutions,
and
others)seem
to beeither unrelated to the net foreign asset position ofa country or, alternatively, explain very little ofitsvariation(See Table 3
and
the discussion of itbelow). Second, while better aggregateproduction functions in rich countries
can
explainwhy
netforeign asset positions aresmall, theycannotexplain
why
grossforeignequity positions are alsosmall.To
theextent that investors
have
a desireto diversify production risk, the theorywould
predict thatthey
choose
largegrossforeign equitypositions that are roughlybalanced. Finally, betteraggregate production functions in rich countriescannot
explain
why
most
international trade consists ofloans ratherthan equity. While bothassets are useful to transfer capital across countries, equityhas the additional benefit ofallowing countries to share production risk
and
should therefore always bepreferred over loans.
Why
are observedforeign equity positions so small?Why
areforeign loans ratherthan foreign equity the assetthat is
most
traded internationally?To
answer
thesequestions,we
would stillneed
toadd
additional elements tothetheory anyway.
Inthis
paper
we
explore the alternative hypothesis thatsovereign risk mightbe
thesecond
ingredient thatthetheory needs.^ Inthepresence
ofthissort of risk,domesticcapital offers domestic investors notonly the value ofits productionflow, but
alsoa
hedge
against the risk offoreign default. This creates ahome
bias inthedemand
for capital that mightexplainwhy
net foreign asset positions are small.Should
we
also expectthat sovereign risk leadsto small grossforeign equitypositions? Is it
even
possible that sovereign risk explainswhy
most
international tradein assets consists ofloans ratherthan equity?
The
answers
tothesequestionsdepend
cruciallyon
theconsequences
forinvestors ofaforeign default.Assume
first thatifa country defaultson
itsforeign obligations, foreigncountries respond by seizing the assetsthat this country
owns
abroadand
then usingthese assetsto (partially)
compensate
creditors.Assume
alsothatthe process by which assets are seizedand
transferred to creditorsdoes
not give rise toany
costs or loss of value. In this case, the loss suffered by creditors in the event ofdefault isdetermined bytheir netforeign asset position vis-a-visthe defaulting country.
To
minimizeexposure
to sovereign risk, investorsthenchoose
small net foreign assetpositions. But they
do
nothave
to hold small grossforeign equitypositions. Infact, tothe extentthat investors
have
adesireto diversify production risktheywould
againchoose
largeforeign equity positions thatare roughly balanced.Under
these assumptions, sovereign risk provides a rationaleforwhy
netforeign asset positionsare small, but it cannot explain
why
grossforeign equity positions aresmall. Neithercan it explain
why
most
international trade consistsofloans ratherthan equity.If
we
want
to hold sovereign risk responsibleforthe small gross foreign equity positions observed in the data,we
need
toremove
at leastone
oftheassumptions ofthe previous paragraph.
Perhaps
legalsystems
do
not allowcreditors to seize theforeign assets ofdefaulting countries. Or,
even
iftheydo, thetransfer ofownership^Obstfeld and Rogoff
[1996, p.349] define sovereign riskas referringto"...anysituation in
which a government defaults on loan contractswith foreigners, seizes foreign assets located
within itsborders, or prevents domesticresidentsfromfullymeetingobligationstoforeign
might involve large costs
and
asubstantial loss of value. Inthis case, investors'exposureto sovereign risk is
no
longertheir net foreign asset position vis-a-visthedefaulting country, but instead sonnefraction oftheirgrossforeign asset position.
Now
the existence ofsovereign riskcan
potentiallyexplainwhy
investorschoose
small grossforeign equitypositions.
With the help ofthe additional (and
we
think realistic) assumption thattransferring ownership ofequity is costlierthantransferring ownershipofloans,
sovereign risk can also explain
why
most
international trade in assets consistsof foreign loans ratherthanforeign equity. Investors issuing foreign loansand
equityarewilling to sell these assets ata discountthat reflectsthe value for
them
ofthe gainthey receive in the eventofdefault.''
What
is this gain?A
domestic investorwho
hasborrowed abroad
receives the full value ofthe loans. This gain is exactly equal totheloss experienced by theforeign investor.
A
domestic investorwho
has sold equityclaims toforeigners receives thefull value oftheequity, but loses
any
valuableadvantage
that foreign investors broughtto thefirm (experience, managerial skills,know-how,
access to bettertechnologyor relationships, firm-specific knowledge,and
so on). This gain is less than the loss experienced bytheforeign investor. Therefore
inthe event ofdefault,foreign loans give rise onlyto puretransferswhile foreign
equity creates losses. Whilethe latterallows investors to
hedge
against productionrisk, it is a
worse
hedge
against sovereign risk than the former. Ifthe desireto avoiddiminishing returns induces investorsto transfercapital from richto poorcountries,
foreign loanswill
be
amore
attractive asset ifsovereign risk is high relative toproduction risk. Thus, sovereign risk has also the potential to explain
why
loans arethe preferred asset tofinance capital flows.
The
notion that foreign equityand
loans are subject to sovereign risk is hardlynovel or controversial
among
observers of international financial markets.The
interesting issue is
whether
reasonable probabilities of default can quantitatively"*
This discount in loancontracts shows up Inthe Interest rate. Theevidence Isoverwhelming thatloanstodeveloping countries usually
command
a higherInterestratethan domesticexplain the
main
features ofcountry portfolios.To
determine this,we
constructasimple North-South
model
of international capital flows.The
production technologyexhibits diminishing returns at the country level
and
country-specific risk. In thismodel, the world
economy
experiences periods with substantial international trade inassets, which
end up
in a crisis period in whichSouth
defaultson
itsforeignobligations. North investors seize South'sforeign assets, butthis transfer ofassets is
costly.
The
defaultinitiates a crisis period in which international financial marketsshutdown.
Eventually, international trade in assetsresumes and
the cycle starts again.It
seems
clear thatthismodel
can, in principle, explain thefacts discussed above. Ifsovereign risk is sufficiently high, net capital flows willbe
small (Fact 1). If eitherdiminishing returns or country-specific production risk is important,we
shouldobserve a tendencyfor capital toflowfrom rich to poor countries (Fact 2).
To
theextentthat transferring ownership of foreign equity is costlierthantransferring
ownership of loans, grossforeign assetpositions should
be
smalland
consistprimarily of loans ratherthan equity (Fact4). Ifthe
model
generates persistence intheworld distribution ofwealth, this can naturallyexplain the persistence offoreign asset
positions (Fact3). It is
much
less clearhowever whether
thismodel
is able to providea reasonable quantitative description ofthe data.
A
perhapssurprising finding is that,even
in the presence ofreasonable diminishing returnsand
production risk, theprobability that international crises occur twice a century is
enough
to generate a setofcountryportfolios that are roughly consistent with the data.
The
paper is organized asfollows: Section I provides a briefdescription ofourdatabase
and
extensivelydocuments
the four factsmentioned
above. Section IIpresents the
model and
discusses itsmain
qualitativeand
quantitative implications.Appendix
A
provides a detailed discussion ofhow
we
constructed our database, whileI.
A
Description
of
Country
Portfolios
Inthis section,
we
describe themain
characteristics of countryportfolios usinga
new
database
covering68
countries from1966
to 1997.We
first providean
overview ofthe sources
and methodology used
to constructthe data.We
thensummarize
itsmain
features in theform offourfacts.Appendix
A
providesdetailson
the data
and
describeshow
we
accountforchanges
in thevalue ofstocks ofassets.1.1
A
New
Database
on Country
PortfoliosOur
databasecontains estimates ofdomestic capital stocksand
foreignassets of countries.^ In particular,
we
have
measures
forthefollowing quantities:k =
Domestic
capital stocke =
Domestic
equityowned
byforeign residents.e* = Foreign equity
owned
by domestic residents.I =
Loans
issued bydomestic residentsand
owned
byforeign residents.I* =
Loans
issued by foreign residentsand
owned
by domestic residents.We
measure
these quantities perdomestic resident in constant1990
US
dollars.We
define a=k+e*-e+r-l
and
f=e*-e+r-l asthe financialwealth or portfolioofthe countryand
its net foreign assets, respectively.We
referto a countryas
a creditor (debtor) ifits netforeign assets are positive (negative).
We
construct estimates ofeach
component
of financial wealth in two steps.First,
we
use the limited available information on stocksofthese assetsto determinean
initial value. Second,we
use flow dataand
estimates ofchanges
in the value ofthese assets to extend the initial stocks forward
and backward
overtime.We
relyon
^
We
abstractfrom othercomponents ofwealth suchas land, natural resources, andhuman
this
method
ofcumulating flowseven
forthose countrieswhere
more
stock data isavailable in orderto avoid a potential bias. Since long time series ofstock data are
available only fora
few
rich countries,using these as the primary sourcewould
essentially result in different
methods
beingused
to construct stocks for richand
poorcountries.
These
differenceswould
then contaminate ourinferences regardinghow
portfolios varywith wealth.
We
rely on data from anumber
of standard sources.We
obtain initial stocksofdomesticcapital from the
Penn
World
Tables,and
use flow dataon
gross domestic investment to buildup
stocks of capital valued inUS
dollars atPPP.
In ordertodetermineforeign holdings ofdomesticequity
and
domestic holdings offoreign equity,we
rely primarilyon
dataon
stocksand
flows of directand
portfolio equityInvestment reported in the International
Monetary
Fund's Balance ofPayments
Statistics Yearbook.We
againuse
the limited availableinformationon
stocksreported in this
and
a variety ofothersourcesto determine the initial level ofeach
assetfor
each
country,and
then use corresponding flowdata from the balanceofpayments
to construct stocksfor remainingyears. Finally,we
combine
stock data onthe debts ofdeveloping countries reported in the
World
Bank's GlobalDevelopment
Financewith data
on
stocksand
flowson
debt from the Balance ofPayments
Statistics
Yearbook
to buildup
stocks ofborrowingand
lending forall countries in oursample.^
Our
sample
ofcountries is determined primarily by data availability.We
beginwith a
sample
of98
countries with population greaterthanone
millionand
percapitaGDP
greaterthan 1000
US
dollars atPPP
in 1990.Of
thesewe
discard25
countrieswith missing, incomplete, or inconsistentbalance of
payments
data. This leaves uswith an unbalanced panel of
73
countries spanningon
average25
ofthe yearsbetween 1966 and
1997. Inthe empiricalwork
thatfollowswe
restrict attention toa®
We
assume
throughoutthat stocksofdebt reported inthesesources constitute solelytheassets and liabilities ofdomestic residents.
To
theextentthatthese reflectdebt issued byorowed
toforeign-ownedfirmsoperating in the country,we
are overestimating the loan assetsand liabilities ofdomestic residents. Given that foreign holdingsofdomesticequityare small
set of
68
countries excluding fivetransition economies. Table 1 liststhese countriesclassified by geographical region.
As
the table shows, oursample
includes basicallyall industrial countries
and
a substantialnumber
ofdeveloping countriesfrom allregions ofthe world.
The
countries in oursample
accountforover90
percent ofworld production
and commodity
trade. It is reasonabletothink that these countriesalsoaccountfora similar fraction ofworld trade in assets. ''
Despitethis wide
coverage,
we
do
not findthat netforeign assetssum
tozero across countries in oursample. Inthe
case
ofclaimson
equity,we
find thatthesum
ofall countries reportedclaims
on
foreign equityison
average about3 percent less than reported foreignclaims
on
domestic equity. In the case of lending the discrepancy is larger, with worldreported borrowing exceeding lending by about 12 percent. While these
discrepancies are nottrivial, they are ofa
comparable
order ofmagnitudetowell-known
discrepancies in flowson
foreign assets.1.2
Main
Features
of
Country
PortfoliosInthis subsection
we
examine
themain
features ofcountryportfolios using thedatabase described above.
We
organize the discussion around fourmain
facts orfindings.
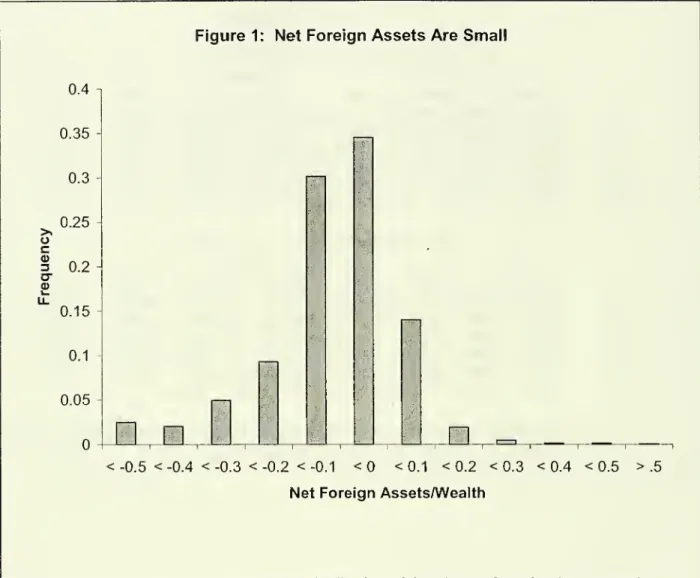
Fact 1
:
Netforeign assets
as
a
share of wealth are smalland
negative formost
countries.Figure t
shows
the distribution ofthe shareofforeign assets in wealth,—
,
a
pooling the available
1717
observations forall countriesand
years. Overwhelmingly,net foreignassets representa small fraction ofthe wealth ofdomestic residents.
''
Our procedureresults inestimates ofwealth thatare very small (and occasionally negative)
forafewcountry-year observations, correspondingtocountries with very large external debt.
We
excludethese observations by limitingthesample tothosewherethe ratioofwealth toRoughly
80
percentofthe country/year observations are lessthan20
percent inabsolute value. Also, about
80
percent ofthecountry-yearobservations are negative.Perhaps
Figure 1 is concealing important variation across regionsand
overtime in the sizeand
sign ofthe net foreign asset position.To
rule outthis possibility, Table 2reports theshareofnetforeign assets in wealth, aggregating across countries in
different regions
and
time periods.The
toppanel reportswealth-weighted averages,and
the lower panel reports the shareforthe typical (median) countryineach group
and
period. Clearly, thefinding thatmost
countrieshave
a small butnegative netforeign asset position holds across regions
and
overtime.Since net foreignasset positions are small relative to wealth, it follows that
there is a strong relationship
between
countries' financialwealthand
theircapitalstock.
To
see
this, Figure 2 plots the capital stock, k, against financial wealth, a,averaging the available years over the period
1966-1997
foreach
country.A
simpleregression ofthe capital stock
on
domesticwealth deliversand
R^of98
percentand
a slope coefficient of 0.93. Clearly, the world distribution of capitalstocks is very close
to the world distribution ofwealth. This
does
notmean
however
that differencesbetween
these two distributions arerandom
or uninteresting. Although the slopecoefficient
appears
tobe
very close to one, the null hypothesis thatthis coefficient isone
isrejected atconventional significance levels.We
also rejectthe null hypothesisthatthe intercept is zero. That is,
on average
the capital stockexceeds
wealth in poorcountries
and
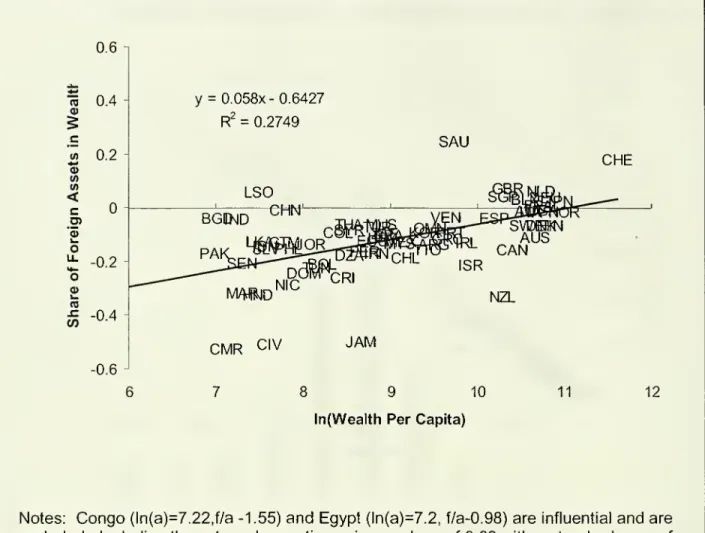
is less than wealth in richcountries. This leads us tothe nextfact:Fact 2:
The
share of netforeign assetsin the countryportfolio increases with wealthin across-section of countries.
The
strong positive associationbetween
the share of netforeign assetsand
wealth is apparent in Figure 3, which plotsthe
average
shareof net foreign assets inwealth,
—
, againstthe logarithmofwealth, ln(a), foreach
country over 1966-1997.a
Virtually all (44 out of47) developing countries are debtors, as aretwo-thirds of
industrial countries (14 outof21). Tiie ten creditor countries in our
sample
are mostlyrich industrial countries (Belgium/Luxembourg, Switzerland,
Germany,
France, UnitedKingdom,
Japan,and
the Netherlands),and
three developing countries (SaudiArabia, Singapore,
and
Lesotho).^The
relationshipbetween
wealthand
netforeignasset positions holds acrosssubperiods.
The
first row ofTable 3 confirmsthat the simple results in Figure 3(shown
in the firstcolumn) hold acrossthe differentsubperiods(shown
in theremaining columns).
The
estimated coefficients range from 0.04to 0.08and
aresignificantly differentfrom zero in
each
subperiod.The magnitudes
ofthesecoefficients indicate that
when
wealth doubles, the share offoreign assets in wealthincreases bythree to six percentage points. In the next
row
ofTable 3we
introduceregional
dummies.
With the exception ofthe first subperiod, thecoefficienton
thelogarithmofwealth increases slightly,
and
remains significantlypositive. Inthe thirdrow
ofTable 3we
check
whetherthechanges
in the wealth elasticity across periods isan
artifactofthechanging composition ofthesample
by restricting attention to abalanced panel of8-yearaverage observations.
The
resultsdo
notchange
substantially.
There
are reasonsto think thatthe relationshipbetween
wealthand
the net foreign asset position iseven
stronger thanwhat
a simple regressionwould
find. It iseasy
to think offactors thatare positively correlated with wealthand
are likelyto benegatively correlated withthe net foreign asset position ofa country. First, wealth is
stronglycorrelated with
human
capital, technologyand
institutional quality, all ofwhich raisethe returns to capital
and
make
foreign assets less attractivefor rich countries. Second, the variability ofreturns is also negatively correlated with wealth,making
foreign assets less attractive for rich countries. Third, theremay
also bescaleeffects
whereby
returnsare higher insome
ofthe larger, richereconomies
in oursample. All ofthese
arguments can be
summarized
bysaying that it is likelythat richLesotho is
somewhat
ofan anomaly, as itruns large current accountsurplusesreflectingprimarilyworkers' remittancesfrom SouthAfrica.
countries
have
better aggregate production functionsand
therefore findforeignassets less attractive.
To
the extentthat this is the case, the simple regressionsofthe net foreign asset positionon
wealth contain omitted variables that biasdownwards
the slopecoefficient.
We
therefore introduce anumber
ofadditional control variablesinto the regression.
We
proxyforhuman
capital with thenumber
ofyears ofsecondary
education in the workforce,and
controlfor scaleeffects using thelogarithmof population.
We
includeopenness
to international trademeasured
astrade
volumes
as a share ofGDP,
financial depthmeasured
as the ratio ofM2
toGDP,
government consumption
as a share ofGDP,
and
an indexofcivil liberties, asproxiesfor thequality ofthe institutional environment.
We
measure
thevariability ofreturns using the standard deviation ofreal per capita
GDP
growth overthe indicatedperiod. Finally,
we
include a set of regionaldummies
to controlforotherunobserved
region-specific heterogeneity.
The
remainderofTable 3summarizes
theresults ofthisaugmented
regression. Averaging overall years, thecoefficient
on
wealth rises to 0.07and
remains very significant. Consistentwith the view thathigh levels of
human
capitalmake
domestic capitalmore
attractive,we
findthatyears ofsecondary educationenters negativelyalthough not quite significantly atthe 10 percent level.
Somewhat
surprisingly, population size enters positively, suggesting thatthere
may
be
diseconomies
ofscale orcongestion effects thatmake
domestic capital less attractivein large countries. Public
consumption
as a share ofGDP
enters negativelyand
approaches
significance atthe 10 percent level, whichmay
reflectan
increaseddemand
forforeign loans tofinance public consumption. Finally, financial depthenters positively
and
significantly. Thismay
reflect thefact that countrieswithwell-developed
financial marketshave
lessneed
for recourse to international financialmarkets.
The
remaining control variables, openness, civil liberties,and
the volatility ofgrowth
do
notenter significantly. Although themagnitude and
significance ofthecoefficients
on
these variables differssomewhat
across subperiods, the results arequalitatively similar tothose obtained in thefirstcolumn.
From
Table 3we
can also obtain asense
ofthemagnitude
and
relativeimportance ofwealth relativeto otherfactors as adeterminant offoreign assets
positions. Consider the regression in thefirst
column
ofTable 3based on average
data over the period 1966-1997.
A
one
standard deviation increase inthe logarithm ofwealth (which correspondsto roughly athree-fold increase) leads to roughly
two-thirds ofa standard deviation increase inthe net foreign asset position, or about 10 percentage points. In contrast, a
one
standard deviation increase in the remainingsignificant control variables leads to
an
increase (inabsolute value) ofonlyone-third ofa standard deviation inthe the net foreign asset position. Anotherway
to see theimportance ofwealth in explaining the cross-country variation in foreign assets is to
perform a variance decomposition ofthefitted values from these regressions.
The
bottomrow
of Table 3reports the share ofthe variance in predicted foreign assetsthat can
be
attributed towealth.^ Averaging overthe entiresample
period,we
findthat almost
60
percent ofthe cross-countryvariation in predicted foreignassets isdue
to cross-countryvariation inwealth. In all butthe first subperiod
we
similarly findthatthe majority ofthe variation in predictedforeign assets is
due
to variation in wealth.Fact 3:
The
share ofnetforeign assetsin the countryportfolio ispersistent overtime.Figure4 plotstheshare ofnetforeign assets in wealth in a given country
and
year
on
thevertical axis, against its value laggedone
year (inthefirst panel), fiveyears (in the
second
panel)and
10 years (in thethird panel)on
the horizontal axis,pooling all country-year observationsoverthe period 1966-1997.
From
thesethreefigures it is clear that the shareofforeign assets inwealth is very persistent.^"
The
®
We
useadecomposition ofthevarianceofthe
sum
oftwocorrelated randomvariablessuggested byKlenow and Rodriguez-Clare[1997]. In particular, ifZ=X+Y, they define the
shareofthevarianceofZ attributableto
X
as COV(X,Z)A/AR(Z). This numberhas thefollowing natural interpretation: If
we
observethatZ
is onepercent above itsmean
butwe
didnotobserve
X
andY
separately, thenwe
would inferthatX
is COV(X,Z)A/AR(Z) percentabove its
mean
value.We
applythis defining Z asfitted foreignassets, andX
as the estimated coefficienton wealth multiplied bywealth.^°
Thisfact
was
also noted by KraayandVentura [Forthcoming] in a smaller sampleof 13OECD
economies,who
argue thatthisobservationcan explain thelong-standing puzzleraised by Feldstein and Horioka [1980].
simple correlation
between
the shareofforeign assets in country portfolios in agivenyear
and
thesame
share laggedone
year is 0.96.Even
over a 10-year horizon thesimplecorrelation is a respectable 0.55. Thisvery strong persistence ofthe share of
foreign assets in country portfolios is all the
more
surprisingwhen
one
considershow
small foreign assets are relative to wealth. In our
sample
the typical (median) countryholds roughly
-10
percentofits wealth in foreign assets,and
its ratio ofwealth toGDP
is around 2. This impliesthata current account surplusof5 percentofGDP
sustainedfor only fouryears
would be
sufficient to entirely erase a country's netforeign asset position. Yet in thedata
we
see
that netforeign assets as a share ofwealth
on average
barelychange
overthis horizon, as indicated by the estimatedslope coefficients which are very closeto one.
The
pooled data in Figure 4 neverthelessmask
some
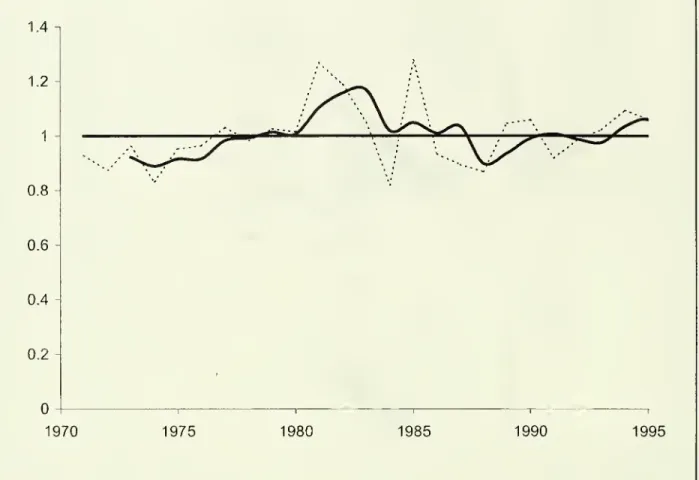
interesting variationovertimein the persistenceofforeign assets in country portfolios. In Figure 5
we
disaggregate theannual persistence in thetop panel ofFigure4 by year. For
each
year indicated
on
the horizontal axis,we
regress the share offoreign assetsin wealthon
a constantand
its one-yearlag,and
then plotthe resulting slope coefficientson
the vertical axis as a
dashed
line.The
solid lineshows
a three-yearcenteredmoving
averageofthese estimated slopes.
When
this slope is greaterthan (less than) one, the foreign assets ofall countrieson average
expand
(contract).From
themid-1970s
to the mid-1980s, the slopes are all greaterthanone. This reflects primarilythe rapid
buildupofdebtofdeveloping countriesfinanced by borrowing from rich countries
and
oil producers, followed
by an
even
greater increase intheir recorded debts asmany
ofthese countries
suspended
payment
during the debtcrisis ofthe 1980s.As
thedebt crisis
was
eventually resolved in the late 1980s, the portfolios ofall countriescontracted
and
theslopes fallbelow
one.Somewhat
surprisingly, the estimated slopeis near
one
during the 1990s, providing little evidence ofsystematic increases intheshare ofnetforeign assets in country portfolios duringthis period.
Why
isthe netforeign asset position as ashare ofwealth so persistent?One
immediate possibility is thatthe persistenceofnet foreign assets reflectsthe
persistence ofwealth, which
we
have
seen
to bean
important determinant ofthecross-countryvariation in netforeign assets.
We
investigatethis iiypothesis empirically by regressing thechange
in netforeign assetson
thechange
in thelogarithm ofwealth
and
thechanges
in the othercontrolvariables considered in Table3, using the three eight-year
changes
implied bythefour 8-yearaveraged
periodsusing in Table 3.
We
then perform thesame
variance decomposition as beforetodetermine
what
shareofthe variation inchanges
in netforeign assets aredue
tochanges
in wealth.We
find thatbetween 40
percentand 70
percentofthe variation inchanges
in net foreign assets canbe
attributed tochanges
in wealth. This suggeststo us that persistence in wealth is an important source ofpersistence inforeign
assets.
Fact4:
Gross
foreign assetpositions aresmalland
consistmostlyofforeign loansratherthan foreign equity.
Net foreign assets consistofnet claims
on
foreignequity (e*-e)and
netlending abroad, (l-l*).
We
illustrate the relative importance ofthe latter in explainingthe cross-country variation in country portfolios in two ways. Table 4
shows
thecomposition offoreign assets as theyvaryacross regions,
income
groups,and
time.Averaging overall years, claims
on
foreign equity consist ofonly0.3 percent ofthewealthofdeveloping countries, while foreign claims
on
domestic equityaccountfor2.8 percent ofwealth.
Among
industrial countriesclaimson
foreign equityand
foreignclaims
on
domesticequityare onlysomewhat
largerand
consist ofonly 3.3percentand
3.9 percentofwealth." In contrastgross borrowingand
lending accountfor 8.8percent
and
4.5 percent ofwealth ofdeveloping countries,and
1 1 percent ofwealtheach
for industrial countries. Finally, it is interesting to notethatthe shareofgross borrowingand
lending in thewealth of industrial countries ismuch
larger than that ofdeveloping countries, especiallyduring the 1990s.
"
A
largeliterature hasdocumentedthatthe holdingsof foreign equity of investors in afewrich countries are very small (Frenchand Poterba [1991],Tesar andWerner [1992] and others). Lewis[1999] provides an excellent surveyofalternativeexplanationsfor this empirical
regularity. Ourdata confirmsthat itapplies toa
much
broaderset ofcountries and assets.In contrastwith Table
4
which focuseson
gross positions, Figure 6 providesevidence
on
the importanceofnet lending in explaining the cross-country variation innet foreign assets.
We
plot net lending as a share ofwealthon
the vertical axis,and
the share of foreign assets in wealth
on
the horizontalaxis, averaging overthe period1966-97.
The
top panelshows
the results for all countries, while the bottom panelshows
thesame
informationfor industrial countries only. Sincethe slope ofthis relationship is nothingmore
than the covariancebetween
netforeign assetsand
netlending divided by the variance ofnetforeign assets, this slope can
be
interpreted asthefraction ofthe variancein net foreign assets attributable to variation in net lending.
In ourfull
sample
ofcountriesthisfraction is82
percent. Forthe developing countries in oursample
this is not surprising at all, sincewe
have seen
thatgross equitypositions are small.
What
ismore
surprising isthatthesame
number
applies to industrial countrieswhere
cross-border claimson
equityaremuch
more
prevalentthan in developing countries.
From
this evidencewe
conclude thatmost
ofthecross-country variation in net foreign assets
can be
attributed todifferences in netlendingratherthan inforeign direct
and
portfolio equity investment.To
sum
up,we
have
seen
thatthe share ofnet foreign assets in countryportfolios is small
and
typically negative (Fact 1), exhibits a strong positiveassociation with wealth in a cross-section ofcountries (Fact 2), is remarkably
persistent overtime (Fact3),
and
consists primarily offoreign loans ratherthanforeign equity (Fact 4).
II.
Towards
an
Explanation
of
Country
Portfolios
We
next develop amodel
thatemphasizes
the interplay ofdiminishing returns,production risk
and
sovereign risk in aworld populated byhomogeneous
mean-variance investors.^^ Diminishing returns
and
production risk implythat therisk-adjusted rate ofreturn to capital declines as
more
capital is invested in a country. Ifthese
were
the only forces atwork,we
would observe all countries choosing thesame
portfolios,and
the world distribution of capital stockswould
be
determined bythe equalization ofrisk-adjusted rates ofreturn. Sovereign risk
however
generates ahome
bias in thedemand
for capital. Ifthiswere
theonly force atwork, countrieswould
hold onlydomestic capitaland
the world distribution of capital stockswould
mimic
the world distribution ofwealth.The
set ofcountry portfoliosand
the worlddistribution of capital stocks is
shaped
bythe interaction oftheseforces.11.1
A
Model
of
InternationalCapital
Flows
The
world containstwo countries, Northand
South;one
factor ofproduction,capital;
and
a singlegood
that canbe
used
for consumptionand
investment. Thisgood
isused
as the numeraire.Each
country contains a continuum of identicalconsumer/investorsthat evaluate
consumption sequences
as follows:(1) EJlnc(t)e"^' dt (5>0)
where
c is consumption.The
time index will be omittedwhenever
this is notconfusing. Throughout,
we
usean
asterisk todenote South variables.We
assume
North has higher initialwealth than South, i.e. a(0)>a*(0).
^^The
keypropertyofthese investors is thatthe shareofeach assetintheir portfolio does not
depend ontheirwealth, butonlyonthe
menu
ofavailable assets. By homogeneous,we mean
thatall Investors haveidentical (homothetic) preferences, although possiblydifferentwealth
and
menu
ofavailable assets.The
productiontechnology is quite simple. Let kand
k*be
thecapital stocksofNorth
and
South.To
produce
one
unitofcapital,one
unitoftheconsumption
good
isrequired. Since capital is reversible, the price of
each
unitis alwaysone and
its returnis the flowofproduction net of depreciation. Letco
and
co*be
two standardWiener
processes with independent increments. That is, E[do)]= E[dco*]=0, E[dco^]=E[dcL)*^]=dt
and
E[do>do/]=0.Then
the flow ofproduction netofdepreciation is given byTtdt+adcain North
and
7T;*dt+adco* in South;where n
and
n* are short-hand for 7t=9k"^and
7i:*=0k*"'' (0<y<1; 9>0)and a
is a positive constant.The
parameterymeasures
the strength ofdiminishing returns which, for simplicity, are treated here asan
externality or congestion effect.^^The
parametera
measures
the importance ofcountry-specific production risk. Therefore, thisformulation
assumes
thatbothcountries
have
thesame
technologyand
embodies
thetwo
forcesthatmake
therisk-adjusted rate of return to capital decreasing in the capital stock
and
create incentivesforcapital to
move
from rich to poorcountries.Domestic
investorsown
the domesticstock of capitaland
can enter into loanand
equity contracts with foreign investors. International loans promisetopay an
instantaneous interest rate rdt. At the beginning ofthe period, the lender gives the
principal tothe borrower. Atthe
end
ofthe periodthere are two possible outcomes.The
borrower might honor its promise, in whichcase
the lender receives the principal plus interest.The
borrower mightalsodefaulton
its promise, in whichcase
theborrower
keeps
the principaland
interestand
the lender receives nothing.A
shareofNorth (South) equityhas pricev (v*)
and
promises topay
the net flow ofproductiongenerated by
one
unitofNorth (South) capital. At the beginning ofthe period thebuyergives the value ofthe equityto the seller.
The
sellerprovides the buyerwith aunitofcapital
and
allows him/herto operate the production technology.Once
again,at the
end
ofthe period there aretwo possible outcomes.The
sellermight honor itspromise, inwhich
case
the buyerreceives the value ofthe equityand keeps
the netflowofproduction.
The
sellermight alsodefaulton
its promise, in whichcase
the^^At
thecostoffurthernotation,
we
couldgeneratethisdependence byassumingthere isaproductionfactor thatis not priced. Sincethis is wellknown,
we
dispense withtheformalities.seller
keeps
the value ofthe equityand
then pays a costX (0<X<1)to repossess theunitof capital
and
the net flowof production.The
buyer receives nothing. Let I betheamount
of lending from North to Southand
e (e*)be
thenumber
ofNorth (South)shares
owned
by South (North).It isevidentthat international loan
and
equity contractswill beused
inequilibrium if
and
onlyifthe probability thatthey arehonored
ishigh enough. Thisobservation raises a familiartime-inconsistency problem. Since
governments
cannotpunishforeign citizens, internationaltrade in assets relies
on
governments'willingnessto punishtheir
own
citizens iftheydefaulton
theirobligations towardsforeigners. 'Ex-ante' both
governments
would like tocommit
todo
thisand
allowinvestors toexploit beneficial trade opportunities.
However,
'ex-post'governments do
not
have an
incentive to punish default ifthe benefitsexceed
the costs.The
benefits of default are clear. But,what
are the costsofdefault?We
shallassume
they varyovertime. Let s={0,1}
be
the state ofthewortd. During 'normal times' (s=0) bothcountries can credibly
commit
to retaliatewith penalties that are largeenough
toensure that default never occurs. During 'crisis periods' (s=1) countries cannot
credibly
commit
to penaltiesbeyond
retaliation in kind.As
a result, if s=1 South (North) defaults ifits netforeign asset position is negative enough, i.e.ve-l-v*e*<-Ae*
(v*e*+l-ve<-A,e).^'* Leta
dtand
|3dtbe
the probabilitiesthat the wortd transitionsfrom
8=0
tos=1and
vice versa;and
assume
thesetransitions are independentofproduction shocks, E[dcods]=E[dca*ds]=0.
The
value ofds is revealed afterthebeginning-of-penod
payments
of loanand
equity contractshave
alreadybeen
made.
What
is the equilibrium probabilityofdefault?Assume
investors believe theprobability of default is zero. Ifa*>a(1-A), the country portfolios
chosen
by investorsare consistentwith this belief.^^ In this case, the equilibnum probability ofdefaultis
^'*
The seminal papers on sovereign risk andthe abilityofvarioustypes of penaltiestosustain trade areEaton and Gersovitz [1981] and Bulowand Rogoff [1989]. Eaton and Fernandez
[1995] and Obstfeldand Rogoff[1996, chapter6] aretwoexcellent surveysofthis topic.
^ If investors believe thatthe probability of defaultiszero, the equilibrium of the model implies
v=v*=1, k=k*=(a+a*)/2, e=a*/2, e*=a/2and 1=0. Naturally, no countrydefaults ifs=0. Buteven ifs=1, Northdoesnot default and neither does Southifa*>a(1-X).
zero
and
sovereign riskis simply notan
issue.We
shall thereforeassume
fromnow
onthat a*(0)<a(0)-(1-X). In this case, the equilibrium probability of default is
state-dependent.
Assume
the initial state is s=1and
investors believe that defaultoccurs ifthe state
does
not change. Then, investorsdo
not purchase foreign loansand
equitysince they expectdefault to occurwith probability close toone, i.e. 1-|3dt. But then
both countries are indifferent
on whether
to default or not.To
ensurethatan
equilibrium exists
we
assume
theydefault(on their non-existentforeign obligations)so thatthe beliefs ofinvestors are consistent. This implies thatthere is
no
trade Inassets during 'crisis periods'.
Assume
nextthatthe initial state iss=0 and
investorsbelieve that default occurs ifthe state changes. In this case, investorswill
purchase
foreign loans
and
equitysince default occurs onlywith avery small probability, i.e. adt. Ifthis probability is not too large, thechosen
country portfolios are consistentwith South defaulting in the unlikelyeventthe state ofthe world changes. Otherwise,
there is
no
Nash
equilibrium in which the countryfollows a purestrategy.^®We
shallrestrictthe analysis to the case in which
a
is small. This implies thatadt
is theequilibrium probability of default in 'normal times'.
To
sum
up, theworldeconomy
exhibits periods oftrade in assets thatculminate in crises (s transitions from
s=0
to s=1) inwhich the debtor countrydefaults.
The
parametersa
and
A.measure
the probabilityand
the destructiveness ofthis crisis. After itoccurs, a period
ensues
in which there isno
trade in assets.Eventually, international trade in assets
resumes
(stransitionsfrom s=1 tos=0)and
the cycle starts again. Although in normal times there might
be
substantial trade inassets, the (small) probability that acrisis occurs
has an
important effecton
thestrategies followed by investors.
We
describethese strategies next.^^
We
canconstruct a mixed-strategyNash equilibrium asfollows: Let p bethe probabilityof defaultthat leads investorstochoosecountryportfolios suchthatve-l-v*e*=-Ae*. South is
indifferent between defaulting ornot. There is an equilibrium in which Southdefaults with
probability (p/a)dt.
11.2
Investment
Strategies
In crisis periods, the only decision that investorsface is
how much
toconsume
and
save. This limited choice isembedded
inthis budget constraintwhich appliesonlyduring crisis periods:
(2)
da
=(7ia-c)dt
+aadco
In normal times there istrade in assets,
and
we
can writethe budgetconstraint ofthe representative investorin North asfollows:
(3)
da
= [7r(k-e) +7i*e*+rl-c]dt
+(7-[(k-e)d(o+e*d(o*]+[(v-A)e-v*e*-l]ds
where, ofcourse, the following restriction applies:
(4) a=
k-ve
+
v*e*+l
The
firsttwo terms ofthe budget constraint (3) arestandardand
show
how
theexpected return
and
volatilityofwealthdepends on
asset choice, conditionalon
thestate ofthe world not changing.
The
thirdterm describes the wealthshock
that theinvestorexperiences atthe onset ofa crisis period. Throughout,
we
rule out Ponzischemes
and impose
short-sale constraintson
the holdings offoreign equity. Thislast restriction is a logical implication ofsovereign risk.
To
determine the optimal consumptionand
portfolio rules, the representativeconsumer
in Northmaximizes
(1) subject to (2)-(4)and
thedynamics
ofassetphces
and
their return characteristics, i.e. the laws ofmotion ofr, v , v*, n, n*,a and
a*.Since the representative
consumer
is infinitesimal, he/she understands that his/heractions
have no
influenceon
these pricesand
their evolution.The
representativeconsumer
in the South solves a similar problem.Appendix
B
shows
that thefirst-orderconditions associated with the investor's problem can
be
written as follows:(5) c
=
6a
(6) 2k-e
7T:-p=
a
a (7) a r p=
a-_
^k-^e
2k-e
,, , a (8)p-v-n
=
-a
+
a(A-v)
ak-Xe
e*
(9) If7i*-r-v*<0, e*=0. Otherwise, re*
-p
•v* =a^ +a
vk-Xe
where
pis the multiplierassociated with constraint(3) divided bythe marginal utility ofwealth. This quantity can
be
interpreted as the risk-free rate that applieson
loansbetween
North residents.A
similar set offirst-orderconditions applyto South.Equation (5) is thefirst-order condition associatedwith c;
and
shows
thefamiliar result that
consumption
equalsthe annualized value ofwealth. Sincethe rate oftime preference isused
as the discount factor, theconsumption
rule is independentofthe state ofthe world.
Equations (6)
and
(7) are the firstorder conditions associated with kand
I;and
describe
how
investors value productionand
sovereign risk, respectively. Equation(6) says thatthe
premium
for holding production risk, n-p, is the covariancebetween
the return to
one
unitof capitaland
one
unitofthe investor'sportfolio, a^(k-e)/a.Equation (7) says thatthe
premium
forholding sovereign risk, r-a-p, is alsoproportionalto the covariance
between one
unit ofloansand
one
unitofthe investor'sportfolio, i.e.
a
. Butsince this time the effectoftheshock
is 'large' ora
non-local,thefactor of proportionality is not
one
butthe ratioofthe marginal valueofwealth before
and
aftera crisis occurs, i.e. .k-Ae
Equations (8)
and
(9) are thefirst-orderconditions associated with eand
e*;and
describe the supplyofNorth equityand
thedemand
for South equity,respectively. Equation (8) can
be
interpreted asdetermining the price atwhich North iswilling to sell equity.Each
share sold bythe North reducesincome
byone
unitof output, but also provides a gain of 1-A.in the eventofacrisis. This iswhy
equitywillbe
sold at adiscount, i.e. v<1. Using Equations (6)and
(7),we
find thatthis discount is equal tothe gain obtained in the event of a crisistimes the price ofone
unitofincome
in this state oftheworld, i.e. 1-v=(1-^)—
-. Equation (9) defines the
r
demand
forSouth equity. Thisasset contains both production riskand
sovereign riskand
the requiredpremium
reflects just this.Thiscompletes the description ofthe model. Equations (4)-(9)
and
theircounterparts for Southjointly determine asset prices (p,p*,r,v,v*), the world
distribution of capital stocks (k,k*)
and consumptions
(c,c*);and
the pattern ofassettrade (e,e*,i) as afunction ofthedistribution ofwealth (a,a*)
and
technology(n,7i*,a,a*).
We
use this set ofequations toderive the cross-sectional implications ofthetheory. Then,the budgetconstraints (2)-(3)determine the lawofmotion ofthe
world
economy
asa function ofthe initial distribution ofwealthand
technologyand
the realizations ofthe shocks.
We
usethis additional set ofequationstoderive thetime-series implications ofthe theory.
11.3
Three
Examples
Before
we
embark
ina quantitative analysis ofthe model,we
discuss threeexamples
or special cases that help build intuitionon
the role ofthe differentforcesthatthe theory emphasizes. In these examples,
we
assume
the worldeconomy
startsin normal times
and
then ask:What
is the initial pattern oftrade in assetsand
how
does
it evolve overtime?EXAMPLE
#1: Leta^O
sothatthere isno
sovereign risk. Inthis case, there isno
discounton
international assets, i.e. p=p*=rand
v=v*=1. Since countrieshave
identical
and
homothetic preferences and, effectively, thesame menu
of assets,theychoose
thesame
portfolios.As
a result, there isno
borrowing or lending. Sincetechnologies are identical, both countries invest
50
percent oftheirwealth in domesticcapital
and
the restin foreign equity. Thus, halfoftheworld capital stock is located ineach
countryand
theworld interest rate equalsthe marginal product ofcapital:(10) k =k*
=
-^+ ^^ 2 (11) r=
e^a+a*v^
\ ^ JIf
one
interprets Northand
South as the set of industrialand
developingcountriesin Table 1,
we
have
that =0.8;and
netforeign assetpositions (as aa+
a*
percentage ofwealth) of North
and South
are37.5and
-150 percent, respectively.The
distribution of wealth is constant overtime, since both countrieschoose
thesame
portfolios
and
thereforehave
thesame
growth rate:da
da
(12)
^
=^^
=
(r-p).dt +-(dco
+dco*)a
a*
2 ^ ^An
implication ofthis is that netforeign asset positions are time invariant.The
predictions ofthisexample
are both well-knownand
dead
wrong.The
model
exhibitstwo featuresthat are present inthe data: net foreign asset positionsare positivelyassociated with wealth (Fact 2)
and
very persistent (Fact 3). But themodel
alsopredicts netforeign asset positions thataremuch
largerthan those in thedata (Fact 1). Italso predicts very large foreign equity positions
and no
borrowingand
lending, whilethe data
shows
thatcountries hold little foreign equityand
financemost
oftheirnetforeign asset positions with foreign loans (Fact4).
EXAMPLE
#2
: Leta^O
so thatthe only reasonwhy
capital flowsfrom rich topoor countries is to exploit higherrates ofreturn.
Now
foreign equityand
loans deliverthe
same
return in normaltimes. IfX=0, foreign equityand
loans also deliverthesame
return inthe event ofdefault and, consequently, the composition offoreignassets is indeterminate. IfX is strictly positive,foreign equity
becomes
adominated
asset. In this case, countries
do
not holdforeign equityand
finance theirnetforeignasset positions with foreign loans.
The
world distribution of capital stocksand
theworld interest rate are implicitlydetermined by:
(13) r
=
ek-^+a-k (14) r= ek*"^+a-(15) k+k*=
a +a*
k^ \3'Equations (13)
and
(14) describe thedemand
for Northand
South capital,and
Equation (15) is the market-clearing condition.
These
equationsshow
that sovereignrisk creates a
home
bias inthedemand
forcapital. Also, notethat theworld interestrate
exceeds
the marginal product ofcapital in both countries. This difference istherisk
premium
required tocompensate
lendersforsovereign risk.The
toppanel ofTable 5
computes
the foreign asset position of Northunder
alternativeassumptions
forY
and
a (Remember
the net foreign asset position of South is-A
times that ofNorth). Netforeign assetpositions for North
and South
range from zero (as a^'>=) to37.5
and -150
percent (asa^O).
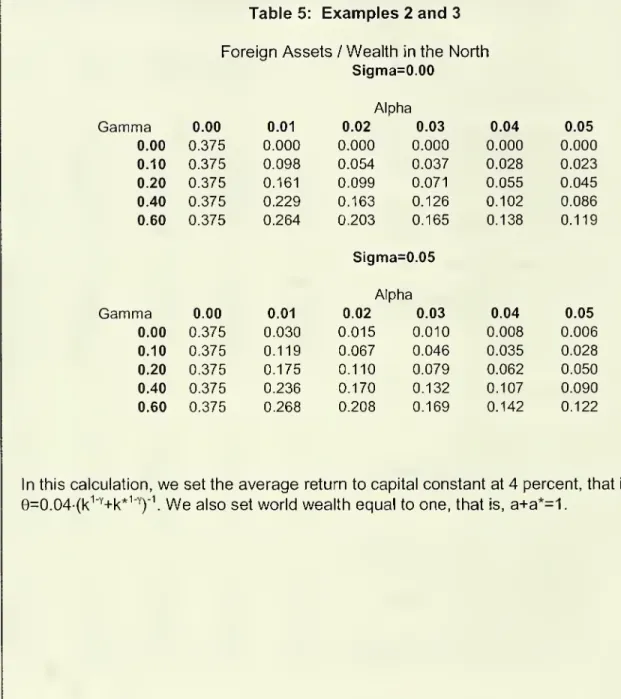
What
are reasonable valuesfora
and
y? Forinstance,
a=0.02
is consistent with the 20'*^ century experience which features twoepisodes of large-scale defaults in the
1930s and
the 1980s. Since the expectedvalue ofaggregate production is 9k^'^, values of yaround 0.6 correspond to the
neoclassical growth model, while values of ynear
one
are close tothe lineargrowthmodel. Table 5
shows
that ifa=0.02 and
y=0.6, the net foreign asset positions ofNorth
and
South are 20.3and
-81.2 percent.These
numbers
are roughly halfofthose


![[PDF] Introduction à l’Assembleur : réglage des paramètres de communication et déboggage | Cours informatique](data:image/gif;base64,R0lGODlhAQABAIAAAP///wAAACH5BAEAAAAALAAAAAABAAEAAAICRAEAOw==)