HAL Id: hal-03058618
https://hal.archives-ouvertes.fr/hal-03058618
Submitted on 10 Mar 2021
HAL is a multi-disciplinary open access
archive for the deposit and dissemination of sci-entific research documents, whether they are pub-lished or not. The documents may come from teaching and research institutions in France or abroad, or from public or private research centers.
L’archive ouverte pluridisciplinaire HAL, est destinée au dépôt et à la diffusion de documents scientifiques de niveau recherche, publiés ou non, émanant des établissements d’enseignement et de recherche français ou étrangers, des laboratoires publics ou privés.
Pouya Rahmati, Ali Tafti, J Westland, César A. Hidalgo
To cite this version:
Pouya Rahmati, Ali Tafti, J Westland, César A. Hidalgo. When All Products Are Digital: Complexity and Intangible Value in the Ecosystem of Digitizing Firms. MIS Quarterly, University of Minnesota, Management Information Systems Research Center, In press, �10.2139/ssrn.3589188�. �hal-03058618�
Value in the Ecosystem of Digitizing Firms
F
ORTHCOMING ATMIS Quarterly
Pouya Rahmati Terry College of Business
University of Georgia
C425 Benson Hall, 630 S. Lumpkin St. Athens, GA 30602
Ali Tafti
College of Business Administration University of Illinois at Chicago 601 S. Morgan St., Chicago, IL 60607
J. Christopher Westland College of Business Administration
University of Illinois at Chicago 601 S. Morgan St., Chicago, IL 60607
Cesar Hidalgo ANITI, University of Toulouse
41 Allée Jules Guesde, 31000 Toulouse, France
Abstract
During the last four decades, digital technologies have disrupted many industries. Car control systems have gone from mechanical to digital. Telephones have changed from sound boxes to portable computers. But have the firms that digitized their products and services become more valuable than firms that didn’t? Here we introduce the construct of digital proximity, which considers the interdependent activities of firms linked in an economic network. We then explore how the digitization of products and services affects a company’s Tobin's q—the ratio of market value over assets—a measure of the intangible value of a firm. Our panel regression methods and robustness tests suggest the positive influence of a firm’s digital proximity on its Tobin’s q. This implies that firms able to come closer to the digital sector have increased their intangible value compared to those that have failed to do so. These findings contribute a new way of measuring digitization and its impact on firm performance that is complementary to traditional measures of information technology (IT) intensity.
Keywords: complexity, intangible value, Tobin’s q, digitization, software industry,
pervasive computing, social networks
Acknowledgments: We thank senior editor Gal Oestreicher-Singer, an anonymous
associate editor, and two anonymous reviewers at MIS Quarterly for helpful comments.
When All Products Become Digital: Complexity and Intangible Value in the Ecosystem of Digitizing Firms
INTRODUCTION
Fifty years ago, our cars were mechanical, our refrigerators electrical, and our buildings were not smart. Now, computing can be found almost everywhere, from the complex control systems of our cars’ engines to the penny-sized computers driving our electric toothbrushes. The local mechanic can no longer repair the latest Toyota models without sophisticated and specialized software, while the 1990 models could be repaired in a home garage. Thisembedding of electronics and communication capabilities in everyday objects, called ubiquitous or pervasive computing, has evolved over four decades from a technical concept to an everyday reality.1,2 Yet,
pervasive computing is not just a technical curiosity; it is an economic phenomenon with implications for the performance and sustainability of firms.
The question we explore here is how does the integration of digital capacities into a firm’s products and services affect its value? We explore this idea by
examining the value of relatedness to digital industries.3 We define relatedness as the
distance between a firm and the digital sector and measure it by constructing a network connecting pairs of industries that firms are likely to participate in. We call this measure of relatedness digital proximity. To quantify digital proximity, we construct a network of industries. We use the sales that firms report in different industries to create a network representation of the industry space from 1990 to 2017.
1Satyanarayanan, M. 2001. "Pervasive Computing: Vision and Challenges," IEEE Personal Communications (8:4), pp. 10-17 (doi: 10.1109/98.943998).
2Weiser, M. 1993. "Some Computer Science Issues in Ubiquitous Computing," Communications of the ACM (36:7), pp. 75-84. Why are these references included here rather than as an in-text citation? I reformatted the reference here to match the style guide from MIS Q.
3 Related measures are often used in the literature on economic complexity and economic geography to gauge the similarity of products (Hidalgo et al. 2007), industries (Neffke et al. 2011), research activities (Guevara et al. 2016), and patents (Boschma et al. 2015), as well as the countries, regions, and firms involved in such economic activities.
We connect two industries when many firms report sales in both of them, suggesting a relationship between the assets and capabilities required for operating in them. We then use this network to measure firms’ proximity to the digital sector and explore whether firms with higher proximities are better valued in the market.
Digital proximity allows us to focus on the digitization of products and services, rather than the use of information technology (IT) for productivity or
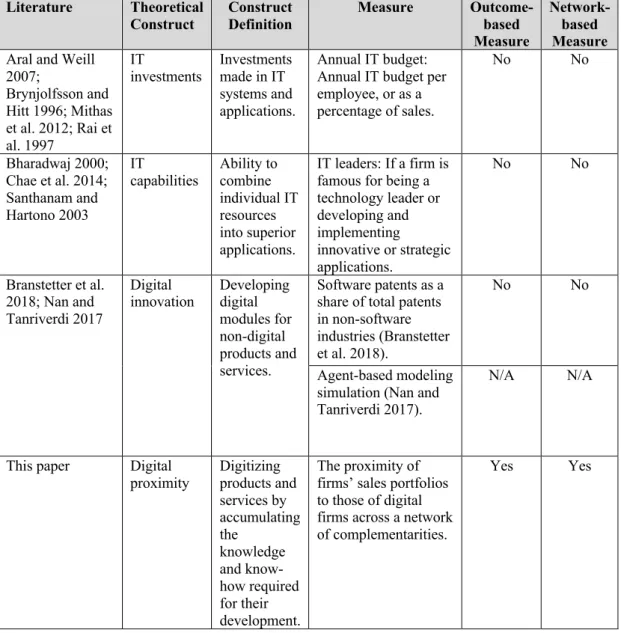
strategic agility. In contrast to traditional constructs (see Table 1 for a summary of the relevant literature), digital proximity has the following characteristics: (1) it is
outcome-based, capturing the combined output of a firm’s IT spending and capabilities, digital innovations, technology partnerships, and other contributing factors and mechanisms, and (2) it is network-based, capturing a firm’s position toward digitization within a network of products and services. In this way, digital proximity helps explore digitization explicitly and complements other existing constructs.
For example, the leap in intensity of digitization for automobiles over the past four decades is an outcome brought about by the totality manufacturers’ efforts toward digitization. Within a network of interdependent firms, the digitization of specific car components has shifted strategic resources from automobile
manufacturers (e.g. Tesla, Toyota) and transportation services (e.g. Lyft) to producers of software and other digital technology (e.g. Google). Here, we point out that the traditional measures of IT intensity may not adequately capture the digital intensity of a firm’s products. In the future, traditional IT intensity measures may become
increasingly inadequate as digital platforms on cloud-computing ecosystems reduce the importance of monetary IT investment and increase the importance of the strategic positioning of digital capabilities. We use digital proximity to explore whether firms
become more valuable as they approach the digital sector. We focus on firms whose primary products are not digital; hence, we are interested in the digital intensity of products developed by non-digital firms. For a definition of digital (i.e. IT-producing) industries, see Table A1 of Appendix A.
We provide evidence that greater digital proximity leads to higher intangible value (higher Tobin’s q) using various models that control for firm fixed-effects and other confounding factors to mitigate the potential for endogeneity. Our results contribute to the information systems (IS) literature in several ways. First, our results answer the recent call for research to explore IT beyond its impact on productivity and establish a link between firms’ actual digitization levels and their performance (Bharadwaj et al. 2013). Second, our novel construct provides a new theoretical lens for exploring digitization as a distributed and generative phenomenon which expands beyond firm boundaries. Third, our proposed measure—while complementary to traditional measures of IT intensity—distinguishes firms that are more successful than others in converting knowledge and know-how into digital products. Accordingly, we will point out examples for which traditional measures of IT intensity fail to
distinguish such firms while our proposed measure succeeds. Finally, digital proximity considers macro-economic trends of digitization in assessing each focal firm’s success, thereby overcoming the data limitation issues that hinder research on the economic impacts of IT.
LITERATURE REVIEW
Digital Proximity and Economic Complexity
Our proposed construct of digital proximity is rooted in the literature on economic complexity. In a stream of recent studies, economic complexity represents the capacity of a nation’s productive structure to develop diverse and distinctive
products (Hartmann et al. 2017; Hausmann et al. 2007; Hidalgo and Hausmann 2009; Hidalgo et al. 2007; Rodrik 2006). That is, to develop diverse and unique products, a country requires a productively functioning network of supporting institutions and norms, logistics and technological infrastructure, and coordinating processes to enable smooth market operations (Hartmann et al. 2017; Hausmann et al. 2007; Hidalgo 2015).
Products and services often require vastly more know-how than can be embodied in a single individual. As products become more sophisticated, they require more extensive social and professional networks to support their development (Chaney 2014; Hartmann et al. 2017; Hausmann and Hidalgo 2011; Hidalgo et al. 2007). A sophisticated economy coordinates the specialized know-how of vast numbers of skilled individuals within firms; in turn, firms are organized as coordinated networks of organizations. In much the same way that the human brain is a network that comprises an information-processing machine, a nation’s economy is an agglomeration of networks forming a machine that processes information of
enormous complexity to create sophisticated products and services (Hidalgo 2015).
Digital Proximity and Digitization
Prior research has studied the firm-value effects of IT (Melville et al. 2004). This literature uses a-priori or input-based notions of IT investment (Aral and Weill 2007; Brynjolfsson and Hitt 1996; Mithas et al. 2012; Rai et al. 1997), or the ability of firms to combine individual IT resources, such as IT infrastructure and human IT resources, into superior IT systems (Chae et al. 2014). In addition, this literature has viewed IT as predominantly back-office technologies that enhance firms’ productivity in achieving strategic goals (Melville et al. 2004; Powell and Dent-Micallef 1997; Wade and Hulland 2004). While this approach has yielded important and significant
results, the commentary by Bharadwaj et al. (2013) calls for new measures that capture the growing complexity of digital innovations. Contemporary phenomena, such as pervasive computing, have transformed IT from back-office technologies to a component embedded in many products and services (Henfridsson and Bygstad 2013; Yoo et al. 2010). More recent IS literature acknowledges the reality of digital
transformation and in turn explores the effect of digital innovations on firms’ performance (Branstetter et al. 2019; Nan and Tanriverdi 2017; Nandkumar et al. 2018). Table 1 provides a summary of the relevant literature.
IS research posits that the digitization of products and services makes them more complex (Novales et al. 2016); specifically, digital products are modular (Yoo et al. 2010), enable product or service ecosystems (Barrett et al. 2015; Gawer 2014; Yoo et al. 2012), and result from generative and distributed innovations (Baldwin and Von Hippel 2011; Maznevski and Chudoba 2000; Parmar et al. 2014). Further, digitizing physical products introduces new challenges, including the management of generated data (Parmar et al. 2014), the complexity of supporting business processes (Mocker et al. 2014), and the economic ecosystem in which the products operate (Porter and Heppelmann 2015). Therefore, digitization enhances the sophistication of products and services—and intensifies the complexity and dynamics of the underlying social structures required for their development.
Digital proximity is an outcome-based socio-technological construct insofar as it is based on the specific position of firms in a network of related industries.4 Firms
develop digital products by coordinating multiple networks of assets, capabilities, systems, and stakeholders. A digitizing firm requires complex and evolving social
4 Our definition of digital proximity is also in-line with the strategy literature showing the effect of geographic proximity on
firms’ innovation (Forman et al. 2016; Klepper 2010). Klepper (2010), in particular, shows that the geographic proximities developed in economic hubs are closely related to the business relatedness between firms in these areas, creating a leap between positioning in geographic networks and complementarity networks.
structures—managerial structures, business processes, and groups of professionals— to accumulate the know-how required for addressing the challenges rooted in the aforementioned complexities of digitization. While economic complexity entails a country’s ability to produce sophisticated products, we posit digital proximity as the measure of a firm’s capacity to: (i) develop digital products and services, (ii) embed digital components into products and services, and (iii) reconfigure and recombine know-how into new classes of products and services. Following prior studies on economic complexity, we develop the digital proximity construct to represent rent-generating digital capabilities embodied in industries that are not traditionally understood to be software-producing. We then hypothesize that firms’ ability to develop such digital capabilities predicts higher levels of intangible value (measured using Tobin’s q).
THEORETICAL FRAMEWORK
Resource-based theory suggests social complexity, path dependence, and environmental complexity as mechanisms that hinder competitors’ ability to imitate firms’ proximity to digital resources within a network of related industries (Barney 1991; Teece et al. 1997; Wade and Hulland 2004). Firms accumulate knowledge and know-how from their resources and capabilities (Amit and Schoemaker 1993; Dyer and Singh 1998; McGrath et al. 1996; Ray et al. 2004). This collective knowledge and know-how is specific to each firm, imperfectly mobile, and not easily imitable
(Barney 1991; Bhatt and Grover 2005). Within a firm, collective knowledge and know-how often accumulate in networks of specialists and organizations; therefore, obtaining high levels of digital proximity entails high levels of social complexity. In addition, complex digital resources and capabilities are hard to imitate as firms’ current level of proximity to digital industries in the industry space is the result of
their specific paths taken in the past (Eisenhardt and Martin 2000; Teece et al. 1997). Firms that grow in digital proximity have created a combination of assets and
capabilities that serve as complements to digital assets and capabilities. Firms can only develop such a combination of capabilities through a transformation process, in the sense that these capabilities cannot simply be purchased (Brynjolfsson and Hitt 2000; Melville et al. 2004); rather, they are co-developed over time (Kohli and Grover 2008). Firms learn through their many attempts to identify and leverage new business opportunities, and their learning processes become embodied in their unique set of resources and capabilities (Teece et al. 1997). Finally, due to the fundamentally unpredictable dynamics of the environment, digital proximity entails a complex competitive environment in which a firm operates (Lee et al. 2010). In recent decades, firms in many industries have experienced unexpected competition from IT or
software firms (Hacklin et al. 2013). Unwittingly, they have found themselves operating in complex environments, in which the factors of success have become more difficult to identify or imitate (Wade and Hulland 2004).
From a design science perspective, digital artifacts follow a layered-modular architecture. This structure dissolves product boundaries and allows components to be loosely coupled and reused while heterogeneous layers can be coupled together (Adomavicius et al. 2008; Yoo et al. 2010). In turn, the characteristics of digital products and services have three main implications for firms: They enable the
creation of digital platforms and ecosystems, allow innovation to expand beyond firm boundaries, and lead to new opportunities for combinatorial innovation (Yoo et al. 2012). For example, different car manufacturers have developed application platforms or have collaborated with software firms and modified their application platforms. These platforms provide access to the digital components of smart cars and
incorporate numerous innovative applications developed by independent software developers. Thus by incorporating digital components into their physical products, car manufacturers have been able to draw from sources of innovation that would have been otherwise unavailable. In another example, ridesharing companies have succeeded in using digital technologies to reconfigure physical resources within transportation industries. In turn, these industries have been able to leverage resources from seemingly unrelated industries, such as the food industry, thereby creating an indirect path through a network that enables the flow of digital resources. Our theoretical arguments suggest that this mechanism creates intangible value, enabling firms to generate revenue and profits from their intangible resources.
H1: Firms’ intangible value increases with the digital proximity of their products and services.
METHODS Industry Space
To measure firm-level digital proximity, we begin with the Compustat Historical Segments dataset to construct an industry-level network of
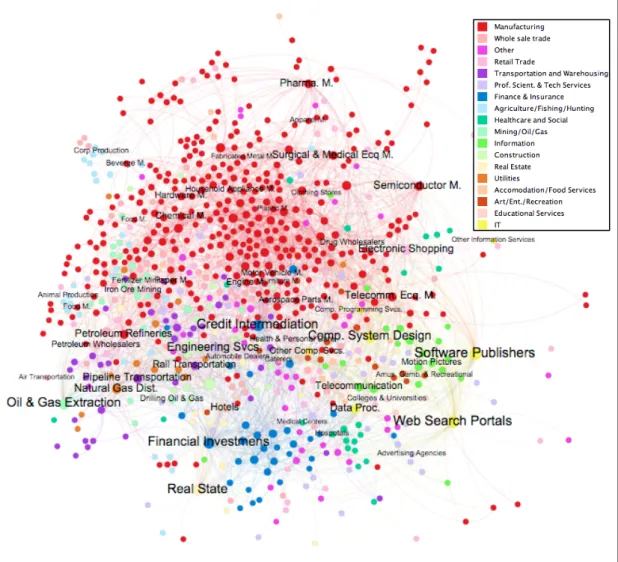
complementarities, the “industry space.” Figure 1 presents a visualization of the industry space. This data contains the amount of sales reported in different industries for public US firms from 1990 to 2017. We use industry classifications, assuming that at their most detailed level they represent the products and services firms offer.5 Table
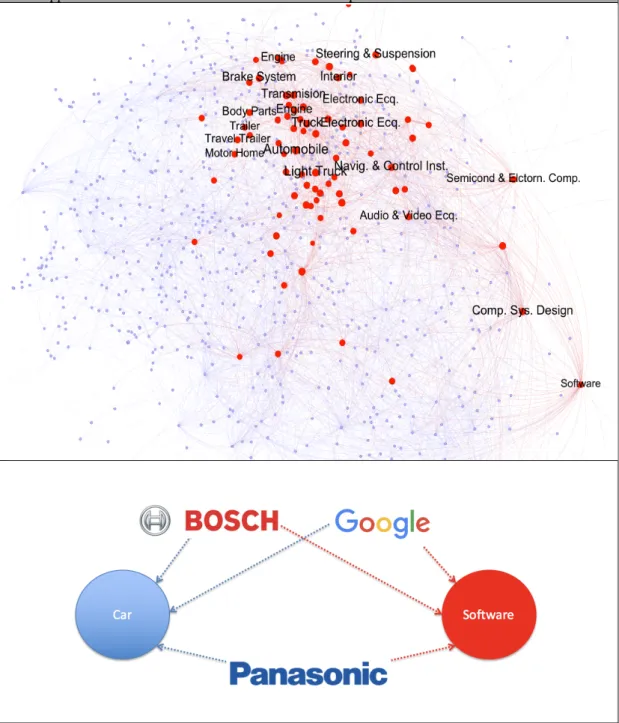
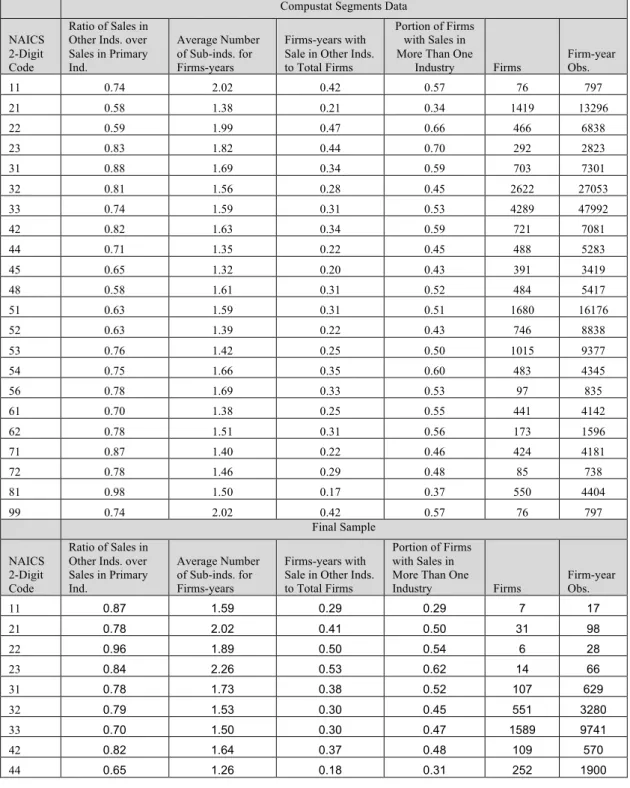
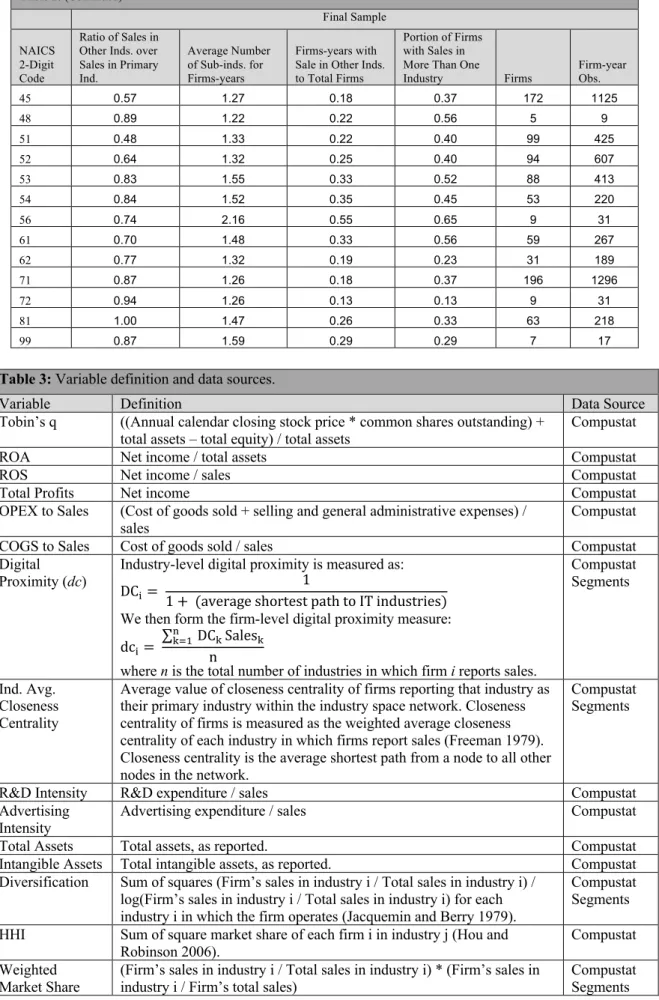
2 provides a closer look at our data, showing that firms generally gain a substantial part of their revenue from industries other than their primary industry. Figure 2 maps the sales reported by automobile manufacturing firms, showing that they participate in
5 The Compustat Historical Segments dataset extends beyond a firm's primary industry classification and shows how each firm's
portfolio of sales revenue is segmented among different secondary industry classifications. We use these secondary industry classifications to construct our network dataset.
a wide spectrum of industries, from engine and brake systems to software. Together, Table 2 and Figure 2 help establish the suitability of our data for analyzing cross-industry complementarities.
The industry space network, wherein there is a link between two industries if there is at least one firm that reports sales in both of them, models the
complementarities between products and services. Links in this network are created as a result of firms selling in more than one industry; hence, their weights change over time. For example, Bosch, an auto part manufacturer that also sells software solutions such as Business Process Management (BPM) or Internet of Things (IoT) suites; Panasonic, primarily a home appliances manufacturer with sales in both automobile and software industries; and, software firms such as Google and Apple, which also sell car infotainment platforms, all contribute to the creation of links between software and automobile industries. We look at firms’ positioning in the industry space to determine their firm-level measures of digital proximity.
Measuring Digital Proximity
The industry space reveals specific paths between firms and digital industries, suggesting opportunities for digitizing products and services. To capture this
positioning, we first measure each industry’s digital proximity by calculating its average shortest path to software-producing industries. Then, we develop a firm-level measure of digital proximity. We construct this firm-level measure as the average digital proximity of industries a firm operates in, weighted by its relative proportion of sales in each of those industries. Digital proximity captures a firm’s diversification into new industries or its change of focus from one group of industries to another. Figure 3 presents a snapshot of our firm-level data. Firms gain high digital proximity scores if they sell directly in digital sectors or sell products with high resource-level
complementarities with digital products. Accordingly, firms with higher digital proximity scores are ahead of their competitors in digitizing their products.
Digital proximity has two unique characteristics, which make it a complement, rather than an alternative, to existing IT investment and innovation measures. First, digital proximity captures the dynamic effects of other firms’ activities on the focal firm’s performance in the industry space network. Consider Figure 4, which provides a comparison of the trends of IT investment and digital proximity between motion pictures and sound recording industries and petroleum industries. While both industries have comparable levels of IT intensity, their digital proximity scores capture the activities of firms—such as Apple, Amazon, AT&T, and Netflix— involved in digitizing the motion pictures and sound recordings industries. Second, digital proximity captures firms’ actual levels of digitization as an outcome-based measure. Figures 4 and 5 reveal how considering only monetary measures of IT investment might be misleading in gauging the extent of firms’ digitization. Using such measures might result in assigning inappropriately high levels of digitization to industries such as petroleum or apparel manufacturing relative to more actually digitized industries such as motion pictures and sound recording and motor vehicle manufacturing. In addition, digital proximity reveals firm-level variations in actual levels of digitization (i.e. for broadcasting and telecommunications, securities and financial investments, and insurance industries), which an input-based measure such as IT intensity would not capture. We provide further details regarding the
construction of the industry space and the firm-level digital proximity measure in Appendix A.
Data and Variables
For this study, we retrieved data from multiple sources. To create the industry space in which we measure digital proximity, we used data from the Compustat North America Historical Segments database from 1990 to 2017. This data provides firm-year financial measures at the industry-segment level. We then used the Compustat North America database, containing panel data of firms’ financial information to construct firm-level and industry-level measures. We then used the Compustat North America Historical Segments data to create weighted averages of measures based on firms’ reported sales in each industry. Our analysis focuses on industries that are not conventionally considered to be IT-producing, and thus we have excluded IT firms (e.g. software) from the sample. Ultimately, our dataset includes 126,630 firm-year observations for 14,286 firms, as well as a smaller set of 20,215 firm-year
observations for 3,625 firms for which we have complete data for all main model variables. In our robustness checks and supplementary analyses, we used various datasets from SDC Platinum, the Bureau of Labor Statistics, the Bureau of Economic Analysis, and the United States Patent and Trademark Office.
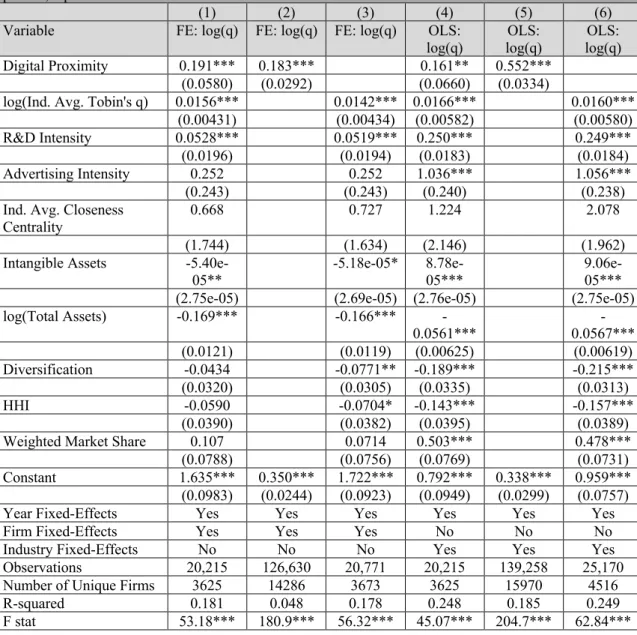
We primarily used Tobin’s q, a market-based measure, to calculate firms’ intangible value (Bharadwaj et al. 1999; Brynjolfsson et al. 2002; DaDalt et al. 2003). Tobin’s q is the ratio of the market value of a company's assets (as measured by the market value of its outstanding stock and debt) divided by the replacement cost of the company's assets (book value). The summary of variables in Table 3 shows the method of calculating Tobin’s q. Table 4 shows summary statistics and correlations.
Empirical Models
We used firm-level fixed-effects models to test the relationship between digital proximity and Tobin’s q. We controlled for potential confounding effects, such
as size, research and development (R&D) intensity, advertising intensity, intangible assets, market share, industry Herfindahl-Hirschman Index (HHI), as well as the industry average of Tobin’s q.
log (&)!,# = )$∗ +,-,./0 1234,5,.6 + 8%)%+ 9 )#:;/2#+ <! + ;!,# Eq. (1)
In the above model, i and t represent each firm and year respectively. 8% represents the aforementioned control variables, <! represents firm fixed-effects, and ;!,# represents errors. The firm fixed-effects model controls for possible differences in relatively stable firm characteristics, including management capabilities and other unobserved characteristics that could introduce confounding effects to the model. In all regression models, we used Huber-White robust standard errors, clustered on the firm identifiers, to account for heteroskedasticity in the errors. The Hausman test— comparing results of fixed-effects and random-effects panel regression estimates—is significant. Hence, the fixed-effects model is preferred for hypothesis testing because, although it is not as efficient, it makes no assumptions about cross-unit correlations between model residuals and regressors. We report the (more consistent) fixed-effects estimates as the main results but also present the (more efficient) random-effects and generalized linear model (GLM)-based estimates. To check for robustness of these estimates, we report ordinary least squares (OLS) regression estimates. Finally, we performed extensive robustness tests to address concerns regarding reverse-causality and unobserved variables.
RESULTS
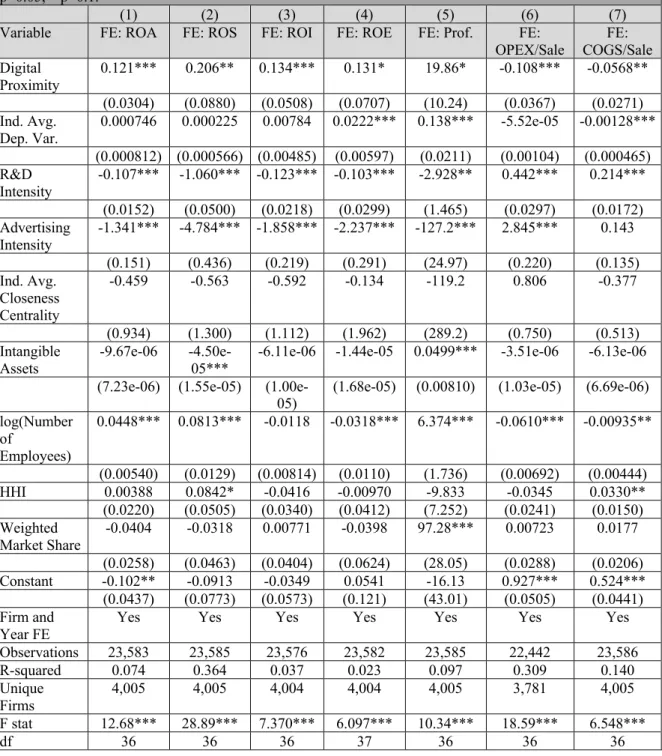
We find strong support for the hypothesized positive effect of digital proximity on firms’ intangible value, as measured by Tobin’s q. Table 5 shows the panel regression estimates for the effect of digital proximity on Tobin’s q (firm intangible value) using fixed-effect and OLS models. Models (1) and (4) show a
positive and significant effect of digital proximity on Tobin’s q when controlling for a set of firm- and industry-level variables. Model (1) shows the positive and significant effect (β = 0.191, p < 0.01) of digital proximity on a firm’s intangible value in a firm fixed-effects model. Model (4) shows a similar effect (β = 0.161, p < 0.05) in an OLS model. Model (2) shows the positive effect (β = 0.183, p < 0.01) of digital proximity on Tobin’s q when including only firm and year fixed-effects. The same effect is tested in Model (5) using an OLS model and is again positive (β = 0.552) and significant (at p < 0.01). Models (3) and (6) show the effect of control variables on Tobin’s q in the absence of the main variable; these estimates are comparable to Models (1) and (4) that included the main variable. We ran various post-estimation analyses to ensure the approximate linearity of the relationship between digital proximity and the logarithm of Tobin’s q, normal distribution of the error terms with respect to model predictions, insensitivity of the results to outliers, and orthogonality between errors and regressors. We further establish the robustness of our results by re-examining our models with a set of alternative dependent variables and over different sub-samples, reporting the results in Tables 6 and 7.
ROBUSTNESS TESTS
We address potential endogeneity concerns and other empirical concerns through multiple robustness tests and additional empirical analyses.
First, we assess the robustness of the identified relationship between digital proximity and firms’ intangible value by constructing a set of instrumental variables, exploiting the network-based nature of the digital proximity measure to do so. We use the average shortest path between the neighbors of a focal industry to every specific digital industry as one group of instrumental variables. These second-order shortest paths from an industry’s neighbors to digital industries should have no direct effect on
the intangible value of firms in the focal industry when controlling for all other model covariates; however, they have a direct effect on firms’ digital proximity, as they influence the shortest path between focal industries and digital industries. This is because neighbor industries can drag a focal industry closer to digital industries. In our context, any indirect influence of the digital proximity of a focal industry’s neighbors on that focal industry’s intangible value would occur through the focal industry’s own digital proximity via this network-path effect. Accordingly, we calculate the average digital proximity for the set of direct neighbors of each focal industry, which we will henceforth refer to as the second-order proximity of the focal industry. Next, we calculate firm-level instrumental variables by constructing the firm-level average of the second-order proximity scores of the industries that firms report sales in, weighted by the amount of sales reported. Table 8 presents the first-stage regression models and Table 9 presents the results of instrumental variable analysis. All models show positive and significant results, providing further support for the main results. In addition, the results of the first-stage regression reported in Table 8 and the various statistical tests reported in Table 9 support the validity of the instruments.
Second, we implement the propensity score matching approach used in prior IS research (Chang and Gurbaxani 2012; Mithas and Krishnan 2009; Oestreicher-Singer and Zalmanson 2013) to further investigate the robustness of our causal identification. We start our analysis by clearly defining the sample, the treatment variable, the outcome variable, and the covariates. We use firm-year observations between 2012 and 2016 for the purpose of matching. In order to form a binary
outcome variable, we use the average Tobin’s q across firms’ industry participation in 2016. We assign a value of 1 for all firms with a Tobin’s q score higher than the
industry average plus one standard deviation in year 2016, and 0 otherwise. With a similar approach, we develop our binary treatment variable using digital proximity scores and industry averages from 2015.
To construct a list of relevant covariates, including various measures of firms’ acquisition and alliancing activities, we use the SDC Platinum database. Strategy and innovation literatures have established mergers, acquisitions, and strategic alliances as important instruments for external innovation (De Man and Duysters 2005;
Hagedoorn and Duysters 2002), especially in high-tech industries (Cloodt et al. 2006). IS literature, as well, has explored how mergers, acquisitions, and strategic alliances can enhance firms’ ability to digitize their business processes (Trantopoulos et al. 2017) and develop innovative digital products and services (Han et al. 2012; Singh et al. 2015). Our list of covariates includes firms’ total number of alliances, joint ventures, software alliances, alliances that include software development,
alliances that include marketing services, acquisitions, and software firm acquisitions, as well as the total number of software firm acquisitions in the firm’s primary
industry between 2011 and 2015.6 We report the result of the logit regression model
predicting the binary form of the treatment variable digital proximity in Table 10. We also perform an additional robustness check with an alternative list of covariates and report these results in Table A2 in Appendix A.7
The propensity score matching results, reported in Table 11, provide further support for our hypothesis. We perform various matching techniques and
specifications to ensure the robustness of our results within parameters for neighbors and calipers stated in Table 11. The results are consistent across different matching
6 We include the industry-level aggregated measures of acquiring software firms in order to include the industry-level spillovers
of other firms’ digitization through acquisitions (Cheng and Nault 2007; Tambe and Hitt 2013).
7 In this robustness test, we repeated the procedure for an alternative group of covariates, such as sales efficiency, R&D intensity,
and intangible assets that are associated with firms’ level of digitization, which we had access to from the Compustat dataset (Chang and Gurbaxani 2012; Im et al. 2001; Kleis et al. 2012).
techniques (Kernel matching in Column (1) and nearest neighbor matching in Columns (2) to (4)).
One strong assumption underlying our matching method is that we can assess firms’ digital proximity using the set of identified covariates; however, identifying the complete set of factors affecting digital proximity and providing an exact prediction of the treatment variable is not feasible. In light of the possibility of biased estimates from unobserved factors (Caliendo and Kopeinig 2008), we assess the sensitivity of our results to the effects of various unobserved factors. Accordingly, we examine the probability of classifying a firm in the treatment group or the control group based on unobserved factors (Rosenbaum and Rubin 1983) and report the results, critical Rosenbaum’s Gamma values, in Table 11.8 These values fall within an acceptable
range (Mithas and Krishnan 2009; Oestreicher-Singer and Zalmanson 2013), between 1.8 to 4.2. Thus, unless we can argue that the unobserved factors can change the odds of having a high level of digital proximity by at least 80 percent, we can rely on the previously generated estimates. Given that we capture an acceptable level of variation for our set of observed factors, we can conclude that our results are robust to
unobserved factors. Table 12 presents the descriptive statistics of covariances before and after matching.
Further, we perform additional falsification tests to ensure the identified effect is not attributed to chance and common industry trends, reporting these results in Table 13. Following recent research (Burtch and Chan 2019; Lee and Hosanagar 2019), we use the shuffling technique in three separate tests to consider whether the
8 Gamma values are calculated based on Rosenbaum bounds sensitivity analysis (Rosenbaum 2002). In our context, this
sensitivity analysis provides an upper bound for the effect of unobserved factors to nullify the effect of digital proximity on firms’ Tobin’s q. We construct the odds ratio Gamma (log odds of differential assignment to treatment due to unobserved factors), which measures the extent to which firms with the same observed attributes differ in their levels of digital proximity. If Gamma equals 1.8 for 2 firms with similar observed characteristics, their propensity to have a high digital proximity score is different by 80 percent, or a factor of 1.8.
identified relationship arises spuriously. First, we randomly assign digital proximity scores without considering the industry and year panel variables. Then, we randomly assign these scores within the same industries and, finally, within the same years in the same industries. For each test, we conduct random shuffling 100 times, re-estimating the coefficient for each permutation and reporting the mean and standard error of these 100 coefficient estimates for digital proximity. Lack of statistical significance in all of these models shows that our results are independent of industrial trends and environmental changes. For further details on this procedure, see Good (2005).
Finally, we assess the face validity of the digital proximity measure by comparing it to three measures: (1) similarity to digital knowledge, (2) knowledge complexity, and (3) digital innovations. We report this analysis in Appendix B. We perform additional tests and discuss the robustness of our results to multicollinearity, unobserved heterogeneities, and reverse causality in Appendix C.
DISCUSSION Research Implications
Inspired by the literature examining the effect of proximity on the innovation output of firms and economies (Green 2018; Hidalgo et al. 2007; Klepper 2010), we introduce the digital proximity construct and its measurement, which captures the closeness of a firm’s products and services to digital industries. We examine the relationship between digital proximity and intangible value over the past several decades by constructing an industry space that shows how firms’ proximity to digital industries evolves over time.
Introducing digital proximity, as a theoretical construct, has two specific theoretical contributions to the field of IS. First, this work explores IT beyond its
being a monetary investment with productivity effects, and keys in on the intangible value of digitization of products and services as a form of strategic positioning within the economic network linking all industries. With digital technologies becoming increasingly pervasive in a growing number of products and services previously considered to be non-digital, our results highlight digital innovation as an inherent driver—rather than an appendage of—firms’ business strategy. This implication aligns with prior literature that recognizes IT as an inherent component of firms’ business strategy (Bharadwaj et al. 2013). It also aligns with the contemporary reality of digital transformation (Yoo et al. 2012). By extending research beyond the factors that help firms establish superior IT capabilities, the current investigation motivates further studies on the question of how firms can gain high levels of digitization. Moving forward, more research is needed to better understand the firm-level and environmental factors that could impact a firm’s ability to translate digitization success into intangible value and a sustainable competitive advantage.
Second, we bring a novel approach to a central and persistent research
question about the role of digital resources and capabilities in generating firm value in a hyper-competitive environment (Lee et al. 2010; Rai and Tang 2013; Tanriverdi et al. 2010). Our study achieves this by introducing a novel network-based construct, which considers a competitive landscape in defining firms’ success in digitizing their products and services. Because the economy has moved into an age of distributed digital innovation, we believe that the IS literature will benefit from a network-based construct such as what we present in this work, defining firms’ success in digitizing their products and services in relation to the dynamic underlying complementarity networks upon which firms operate. Digital proximity entails the enhancement or deterioration of firms’ competitive position, even when this movement is caused by
the activities of other firms. As a network-based construct, digital proximity considers the macro patterns of change in the overall economic landscape in the movement of firms toward digitization. This approach in analyzing digital innovation empowers researchers to explore digital innovations as generative and interconnected, rather than isolated (Yoo et al. 2012; Yoo et al. 2010).
Our novel approach in measuring digitization contributes substantively to the business value of IT literature. First, we measure digital proximity as an outcome-based measure that captures digitization. That is, our measure entails a wide range of factors, such as IT investments and patenting activities, and focuses on how firms translate these factors successfully into digital products and services. In this way, digital proximity reveals another IT capability, one that is not captured by traditional measures. Second, the network-based measure of digital proximity includes firms’ positioning in a competitive landscape when assessing their levels of digitization. Traditional measures of digitization, however, focus only on single firms’ IT
investments; in other words, these measures treat firms as isolated entities. Using our measure, a firm’s positioning can improve if other firms in its industry create new complementarities between industry resources and digital resources. Such inter-firm effects are not captured in traditional IT investment measures. Third, our
measurement procedure overcomes a persistent limitation affecting the business value of IT research, which stems from the field’s reliance on survey data and the
unavailability of many firms’ IT investment data. Our approach in measuring digitization has allowed us to base our findings on 20,215 observations from 3,625 unique firms over a time period of almost three decades.
Our findings have important practical implications, as well. First, our results highlight the importance of considering a wider competitive landscape in today’s digital economy. We show how the activities of firms in other industries might create or undermine firms’ paths to digitization. Therefore, in addition to their immediate competitors and partners, firms need strategic insight into other industries that might emerge to create connecting paths to digital industries over time. We also develop the industry space, which maps firms’ competitive environment, and managers could use this network to analyze the relative digital positioning of their firm against
competitors and identify potential areas from which new competition may arise. In turn, this work could guide managers when choosing among paths of different complementary technologies.
Second, our results introduce a novel practical approach for measuring digitization within a wider economic landscape. In this way, our results provide a response to a call by economics researchers (Greenstein et al. 2013) regarding the need for new measures that capture digitization at a macroeconomic level. Our firm-level and industry-firm-level measures of digital proximity equip policy makers with a new tool to measure overall movement toward digitization. For example, an overall
average industry-level digital proximity score can measure the digitization of an economy, the same way that GDP captures its production.
REFERENCES
Adomavicius, G., Bockstedt, J. C., Gupta, A., and Kauffman, R. J. 2008. "Making Sense of Technology Trends in the Information Technology Landscape: A Design Science Approach," MIS Quarterly (32:4), pp. 779-809 (doi: 10.2307/25148872).
Amit, R., and Schoemaker, P. J. 1993. "Strategic Assets and Organizational Rent," Strategic Management Journal (14:1), pp. 33-46 (doi:
10.1002/smj.4250140105).
Aral, S., and Weill, P. 2007. "IT Assets, Organizational Capabilities, and Firm Performance: How Resource Allocations and Organizational Differences
Explain Performance Variation," Organization Science (18:5), pp. 763-780 (doi: 10.1287/orsc.1070.0306).
Baldwin, C., and Von Hippel, E. 2011. "Modeling a Paradigm Shift: From Producer Innovation to User and Open Collaborative Innovation," Organization Science (22:6), pp. 1399-1417. (doi: 10.1287/orsc.1100.0618).
Barney, J. 1991. "Firm Resources and Sustained Competitive Advantage," Journal of Management (17:1), pp. 99-120.
Barrett, M., Davidson, E., Prabhu, J., and Vargo, S. L. 2015. "Service Innovation in the Digital Age: Key Contributions and Future Directions," MIS Quarterly (39:1), pp. 135-154.
Bharadwaj, A., Bharadwaj, S., and Konsynski, B. 1999. "Information Technology Effects on Firm Performance as Measured by Tobin's q," Management Science (45:7), pp. 1008-1024.
Bharadwaj, A., El Sawy, O. A., Pavlou, P. A., and Venkatraman, N. V. 2013. "Digital Business Strategy: Toward a Next Generation of Insights," MIS Quarterly (37:2), pp. 471-482.
Bhatt, G. D., and Grover, V. 2005. "Types of Information Technology Capabilities and Their Role in Competitive Advantage: An Empirical Study," Journal of Management Information Systems (22:2), pp. 253-277 (doi:
10.1080/07421222.2005.11045844).
Boschma, R., Balland, P.-A., and Kogler, D. F. 2015. "Relatedness and Technological Change in Cities: The Rise and Fall of Technological Knowledge in US Metropolitan Areas from 1981 to 2010," Industrial and Corporate Change (24:1), pp. 223-25 (doi: 10.1093/icc/dtu012).
Branstetter, L. G., Drev, M., and Kwon, N. 2019. "Get with the Program: Software-driven Innovation in Traditional Manufacturing," Management Science (65:2), pp. 541-558).
Brynjolfsson, E., and Hitt, L. 1996. "Paradox Lost? Firm-level Evidence on the Returns to Information Systems Spending," Management Science (42:4), pp. 541-558.
Brynjolfsson, E., and Hitt, L. M. 2000. "Beyond Computation: Information
Technology, Organizational Transformation and Business Performance," The Journal of Economic Perspective (14:4), pp. 23-48.
Brynjolfsson, E., Hitt, L. M., and Yang, S. 2002. "Intangible Assets: Computers and Organizational Capital," Brookings Papers on Economic Activity (2002:1), pp. 137-181.
Burtch, G., and Chan, J. 2019. "Investigating the Relationship Between Medical Crowdfunding and Personal Bankruptcy in the United States: Evidence of a Digital Divide," MIS Quarterly (43:1), pp. 237-262 (doi:
10.25300/MISQ/2019/14569).
Caliendo, M., and Kopeinig, S., 2008. "Some Practical Guidance for the Implementation of Propensity Score Matching," Journal of economic surveys (22:1), pp. 31-72.
Chae, H.-C., Koh, C. E., and Prybutok, V. R. 2014. "Information Technology
Capability and Firm Performance: Contradictory Findings and Their Possible Causes," MIS Quarterly (38:1), pp. 305-326.
Chaney, T. 2014. "The Network Structure of International Trade," American Economic Review (104:11), pp. 3600-3634 (doi: 10.1257/aer.104.11.3600).
Chang, Y. B., and Gurbaxani, V. 2012. "Information Technology Outsourcing, Knowledge Transfer, and Firm Productivity: An Empirical Analysis," MIS Quarterly (36:4), pp. 1043-1063 (doi: 10.2307/41703497).
Cheng, Z., and Nault, B. R. 2007. "Industry Level Supplier-driven IT Spillovers," Management Science (53:8), pp. 1199-1216 (doi: 10.1287/mnsc.1060.0657). Cloodt, M., Hagedoorn, J., and Van Kranenburg, H. 2006. "Mergers and Acquisitions:
Their Effect on the Innovative Performance of Companies in High-tech Industries," Research Policy (35:5), pp. 642-654 (doi:
10.1016/j.respol.2006.02.007).
DaDalt, P. J., Donaldson, J. R., and Garner, J. L. 2003. "Will Any q Do?" Journal of Financial Research (26:4), pp. 535-551 (doi: 10.1111/1475-6803.00073). De Man, A.-P., and Duysters, G. 2005. "Collaboration and Innovation: A Review of
the Effects of Mergers, Acquisitions and Alliances on Innovation," Technovation (25:12), pp. 1377-1387 (doi:
10.1016/j.technovation.2004.07.021).
Dyer, J. H., and Singh, H. 1998. "The Relational View: Cooperative Strategy and Sources of Interorgal Competitive Advantage," The Academy of Management Review (23:4), pp. 660-679 (doi: 10.5465/amr.1998.1255632).
Eisenhardt, K. M., and Martin, J. A. 2000. "Dynamic Capabilities: What Are They?" Strategic Management Journal (21:10/11), pp. 1105-1121.
Forman, C., Goldfarb, A., and Greenstein, S. 2016. "Agglomeration of Invention in the Bay Area: Not Just ICT," American Economic Review (106:5), pp. 146-151.
Gawer, A. 2014. "Bridging Differing Perspectives on Technological Platforms: Toward an Integrative Framework," Research Policy (43:7), pp. 1239-1249 (doi: 10.1016/j.respol.2014.03.006).
Good, P. 2005. Permutation, Parametric, and Bootstrap Tests of Hypotheses, New York, NY: Springer.
Green, D. D. 2018. "Fueling the Gig Economy: A Case Study Evaluation of
Upwork.com," Management and Economics Research Journal (4:2018), pp. 104-112 (doi: 10.18639/MERJ.2018.04.523634).
Greenstein, S., Lerner, J., and Stern, S. 2013. "Digitization, Innovation, and
Copyright: What is the Agenda?" Strategic Organization (11:1), pp. 110-121. Guevara, M. R., Hartmann, D., Aristarán, M., Mendoza, M., and Hidalgo, C. A. 2016.
"The Research Space: Using the Career Paths of Scholars to Predict the Evolution of the Research Output of Individuals, Institutions, and Nations," arXiv preprint arXiv:1602.08409.
Hacklin, F., Battistini, B., and Von Krogh, G. 2013. "Strategic Choices in Converging Industries," MIT Sloan Management Review (55:1), pp. 65-74.
Hagedoorn, J., and Duysters, G. 2002. "External Sources of Innovative Capabilities: The Preferences for Strategic Alliances or Mergers and Acquisitions," Journal of Management Studies (39:2), pp. 167-188.
Han, K., Oh, W., Im, K. S., Chang, R. M., Oh, H., and Pinsonneault, A. 2012. "Value Cocreation and Wealth Spillover in Open Innovation Alliances," MIS
Quarterly (36:1), pp. 291-315.
Hartmann, D., Guevara, M. R., Jara-Figueroa, C., Aristarán, M., and Hidalgo, C. A. 2017. "Linking Economic Complexity, Institutions, and Income Inequality," World Development (93), pp. 75-93 (doi: 10.1016/j.worlddev.2016.12.020).
Hausmann, R., and Hidalgo, C. A. 2011. "The Network Structure of Economic Output," Journal of Economic Growth (16:4), pp. 309-342 (doi:
10.1007/s10997-011-9071-4).
Hausmann, R., Hwang, J., and Rodrik, D. 2007. "What You Export Matters," Journal of Economic Growth (12:1), pp. 1-25 (doi: 10.1007/s10887-006-9009-4). Henfridsson, O., and Bygstad, B. 2013. "The Generative Mechanisms of Digital
Infrastructure Evolution," MIS Quarterly (37:3), pp. 907-931.
Hidalgo, C. 2015. Why Information Grows: The Evolution of Order, from Atoms to Economies, New York, .NY: Basic Books.
Hidalgo, C., and Hausmann, R. 2009. "The Building Blocks of Economic
Complexity," Proceedings of the National Academy of Sciences (106:26), pp. 10570-10575 (doi: 10.1073/pnas.0900943106).
Hidalgo, C. A., Klinger, B., Barabási, A.-L., and Hausmann, R. 2007. "The Product Space Conditions the Development of Nations," Science (317:5837), pp. 482-487 (doi: 10.1126/science.1144581).
Im, K. S., Dow, K. E., and Grover, V. 2001. "Research Report: A Reexamination of IT Investment and the Market Value of the Firm—An Event Study
Methodology," Information Systems Research (12:1), pp. 103-117. Kleis, L., Chwelos, P., Ramirez, R. V., and Cockburn, I. 2012. "Information
Technology and Intangible Output: The Impact of IT Investment on Innovation Productivity," Information Systems Research (23:1), pp. 42-59 (doi: 10.1287/isre.1100.0338)/
Klepper, S. 2010. "The Origin and Growth of Industry Clusters: The Making of Silicon Valley and Detroit," Journal of Urban Economics (67:1), pp. 15-32. Kohli, R., and Grover, V. 2008. "Business Value of IT: An Essay on Expanding
Research Directions to Keep up with the Times," Journal of the Association for Information Systems (9:1), pp. 23-39).
Lee, C. H., Venkatraman, N., Tanriverdi, H., and Iyer, B. 2010. "Complementarity-based Hypercompetition in the Software Industry: Theory and Empirical Test, 1990–2002," Strategic Management Journal (31:13), pp. 1431-1456 (doi: 10.1002/smj.895).
Lee, D., and Hosanagar, K. 2019. "How Do Recommender Systems Affect Sales Diversity? A Cross-Category Investigation via Randomized Field
Experiment," Information Systems Research (30:1), pp. 239-259.
Maznevski, M. L., and Chudoba, K. M. 2000. "Bridging Space over Time: Global Virtual Team Dynamics and Effectiveness," Organization Science (11:5), pp. 473-492.
McGrath, R. G., Tsai, M.-H., Venkataraman, S., and MacMillan, I. C. 1996. "Innovation, Competitive Advantage and Rent: A Model and Test," Management Science (42:3), pp. 389-403.
Melville, N., Kraemer, K., and Gurbaxani, V. 2004. "Review: Information Technology and Organizational Performance: An Integrative Model of IT Business Value," MIS Quarterly (28:2), pp. 283-322 (doi: 10.2307/25148636). Mithas, S., and Krishnan, M. S. 2009. "From Association to Causation via a Potential
Outcomes Approach," Information Systems Research (20:2), pp. 295-313. Mithas, S., Tafti, A., Bardhan, I., and Goh, J. M. 2012. "Information Technology and
Firm Profitability: Mechanisms and Empirical Evidence," MIS Quarterly (36:1), pp. 205-224.
Mocker, M., Weill, P., and Woerner, S. L. 2014. "Revisiting Complexity in the Digital Age," MIT Sloan Management Review (55:4), pp. 73-82.
Nan, N., and Tanriverdi, H. 2017. "Unifying the Role of IT in Hyperturbulence and Competitive Advantage via a Multilevel Perspective of IS Strategy," MIS Quarterly (41:3), pp. 937-958.
Nandkumar, A., Mani, D., and Bharadwaj, A. 2018. "Market Returns to Digital Innovations: A Group Based Trajectory Approach," Academy of Management Proceedings (2018:1) (doi: 10.5465/AMBPP.2018.15241abstract).
Neffke, F., Henning, M., and Boschma, R. 2011. "How Do Regions Diversify over Time? Industry Relatedness and the Development of New Growth Paths in Regions," Economic Geography (87:3), pp. 237-265 (doi: 10.1111/j.1944-8287.2011.01121.x).
Novales, A., Mocker, M., and Simonovich, D. 2016. "IT-enriched "Digitized" Products: Building Blocks and Challenges," Proceedings of the Americas Conference on Information Systems (22:2), pp. 1595-1604.
Oestreicher-Singer, G., and Zalmanson, L. 2013. "Content or Community? A Digital Business Strategy for Content Providers in the Social Age," MIS Quarterly (37:2), pp. 591-616.
Parmar, R., Mackenzie, I., Cohn, D., and Gann, D. 2014. "The New Patterns of Innovation," Harvard Business Review (92:1/2), pp. 86-95.
Porter, M. E., and Heppelmann, J. E. 2015. "How Smart, Connected Products Are Transforming Competition," Harvard Business Review (93:10), pp. 96-116. Powell, T. C., and Dent-Micallef, A. 1997. "Information Technology as Competitive
Advantage: The Role of Human, Business, and Technology Resources," Strategic Management Journal (18:5), pp. 375-405.
Rai, A., Patnayakuni, R., and Patnayakuni, N. 1997. "Technology Investment and Business Performance," Communications of the ACM (40:7), pp. 89-97 (doi: 10.1145/256175.256191).
Rai, A., and Tang, X. 2013. "Research Commentary—Information Technology-enabled Business Models: A Conceptual Framework and a Coevolution Perspective for Future Research," Information Systems Research (25:1), pp. 1-14.
Ray, G., Barney, J. B., and Muhanna, W. A. 2004. "Capabilities, Business Processes, and Competitive Advantage: Choosing the Dependent Variable in Empirical Tests of the Resource-based View," Strategic Management Journal (25:1), pp. 23-37.
Rodrik, D. 2006. "What's So Special about China's Exports?" China & World Economy (14:5), pp. 1-19.
Rosenbaum, P. 2002. "Observational Studies," 2nd ed. Springer, New York. Rosenbaum, P. R., and Rubin, D. B. 1983. "Assessing Sensitivity to an Unobserved
Binary Covariate in an Observational Study with Binary Outcome," Journal of the Royal Statistical Society: Series B (Methodological), (45:2), pp. 212-218. Singh, R., Mathiassen, L., and Mishra, A. 2015. "Organizational Path Constitution in
Technological Innovation: Evidence from Rural Telehealth," MIS Quarterly (39:3), pp. 643-666.
Tambe, P., and Hitt, L. M. 2013. "Measuring Information Technology Spillovers," Information Systems Research (25:1), pp. 53-71.
Tanriverdi, H., Rai, A., and Venkatraman, N. 2010. "Research Commentary—
Reframing the Dominant Quests of Information Systems Strategy Research for Complex Adaptive Business Systems," Information Systems Research (21:4), pp. 822-834.
Teece, D. J., Pisano, G., and Shuen, A. 1997. "Dynamic Capabilities and Strategic Management," Strategic Management Journal (18:7), pp. 509-533.
Trantopoulos, K., von Krogh, G., Wallin, M. W., and Woerter, M. 2017. "External Knowledge and Information Technology: Implications for Process Innovation Performance," MIS Quarterly (41:1), pp. 287-300.
Wade, M., and Hulland, J. 2004. "The Resource-based View and Information Systems Research: Review, Extension, and Suggestions for Future Research," MIS Quarterly (28:1), pp. 107-142 (doi: 10.2307/25148626).
Yoo, Y., Boland Jr, R. J., Lyytinen, K., and Majchrzak, A. 2012. "Organizing for Innovation in the Digitized World." Organization Science (23:5), pp. 1398-1408 (doi: 10.1287/orsc.1120.0771).
Yoo, Y., Henfridsson, O., and Lyytinen, K. 2010. "Research Commentary—The New Organizing Logic of Digital Innovation: An Agenda for Information Systems Research," Information Systems Research (21:4), pp. 724-735.
Figure 1: Industry space for the time period 2010–2014, visualized using a force expansion
algorithm. Nodes represent industry classifications at the 6-digit NAICS level, and they are colored according to the 2-digit NAICS level. Node weights are proportional to their degree, and the weights of the edges are set to be equal. The IT sector is shown in yellow, so the network can reveal the relatedness of various sub-industries. Manufacturing (in red) features a large amount of dispersion with respect to its proximity to IT. Sub-industries such as semiconductor manufacturing, surgical and medical equipment manufacturing, and aerospace equipment manufacturing are relatively close to IT, whereas chemical manufacturing, fabricated metal manufacturing, and hardware
manufacturing are relatively far from IT. The manufacturing cluster is surrounded by information industries (yellow, bottom right); finance and insurance (dark blue); healthcare and social services (dark green); mining, oil and gas; transportation; and, agriculture. In the overall industry space, several information-intensive industries are, as expected, particularly close to IT: electronic shopping; professional, scientific, and technological services; art, entertainment, and recreation; finance; and, high-tech manufacturing industries. Industries such as oil and gas, agriculture, mining, utilities, dairy production, and textiles are located far from IT.
Figure 2: Map of sales reported by all firms in the automobile industries over the industry space
network with selective labels (top). Red in this network represents an industry that a firm originally classified in the motor vehicle manufacturing industries (NAICS 361) reports sales in. Blue nodes are all other industries. This figure shows how firms in automobile industries have sales in a wide spectrum of industries, including engine and brake systems, navigation and control instruments, audio and video equipment, semiconductor and electronic equipment, computer system design, and software industries. Links in the industry space are created as a result of firms selling in more than one industry (bottom). Specifically, Google is a software firm that is developing its own self-driving vehicle, Bosch is an auto part manufacturer that also sells software solutions, and Panasonic is a home appliances manufacturer that also sells automobile parts and cloud solutions.
Figure 3: Snapshot of firms in the wholesale trade industries (red) in 2015 and 2016, sorted by their digital proximity scores (from low at the top to high at the bottom)
and the industries they report sales in (blue), sorted by their digital proximity scores (from low at the top to high at the bottom). Firm node size is proportional to Tobin’s q, and industry node size is proportional to digital proximity scores. Two takeaways enhancing the validity of the digital proximity construct: (1) while communication, finance, and aircraft manufacturing industries have higher levels of digital proximity, book and newspaper wholesalers, trust manufacturers, food, and construction industries have lower digital proximity scores, and (2) firms such as usell.com, an online platform for trading used electronic devices; Bsquare, a provider of industrial internet of things (IoT) suits; and, Inpixon, a provider of indoor positioning analytics security and intelligence products, have the highest digital proximity scores. Meanwhile, firms such as Now Inc, a distributor of supplies, and Boise Cascade, a wood products distributor, have the lowest digital proximity scores.
Figure 4: Comparison of digital proximity and IT investments for motion pictures and sound recording
industries (NAICS 512) and petroleum industries (NAICS 324) over time (top). Digital proximity co-evolves with the activities of other firms in the industry. These variations, while reflected in the digital proximity measure, are not captured by traditional constructs, such as monetary IT investments. IT investment data is extracted from the Bureau of Economic Analysis (BEA) industry-level data on capital investments. The IT investment variable is weighted by industry-level total capital investments. All IT investment and digital proximity values are mean centered and standardized.
Figure 5: Relationship between industry-level (3-digit NAICS) IT investments and digital proximity. Digital
proximity captures firms’ actual levels of digitization. While the two measures are correlated, meaningful variation is not captured by monetary IT investments. For example, apparel manufacturing industries have a higher level of IT investments compared to motion pictures and sound recording industries, while the latter have a higher value of digital proximity. Further, broadcasting and telecommunications, securities and financial investments, and insurance firms have similar levels of IT investment; however, their digital proximity scores clearly show their different levels of digitization. In the below graph, IT-producing (e.g. software) industries are excluded. IT investment data is extracted from the Bureau of Economic Analysis (BEA) industry-level data on capital investments. The IT investment variable is weighted by industry-level total capital investments. All IT investment and digital proximity values are mean centered and
Table 1: Summary of literature on the performance effects of digitization. The below table is not a
comprehensive literature review and lists only a few studies for each theoretical construct.
Literature Theoretical Construct Construct Definition Measure Outcome-based Measure Network-based Measure
Aral and Weill 2007; Brynjolfsson and Hitt 1996; Mithas et al. 2012; Rai et al. 1997 IT
investments Investments made in IT systems and applications.
Annual IT budget: Annual IT budget per employee, or as a percentage of sales. No No Bharadwaj 2000; Chae et al. 2014; Santhanam and Hartono 2003 IT
capabilities Ability to combine individual IT resources into superior applications.
IT leaders: If a firm is famous for being a technology leader or developing and implementing innovative or strategic applications. No No Branstetter et al. 2018; Nan and Tanriverdi 2017 Digital
innovation Developing digital modules for non-digital products and services.
Software patents as a share of total patents in non-software industries (Branstetter et al. 2018).
No No
Agent-based modeling simulation (Nan and Tanriverdi 2017).
N/A N/A
This paper Digital
proximity Digitizing products and services by accumulating the knowledge and know-how required for their development. The proximity of firms’ sales portfolios to those of digital firms across a network of complementarities.
Table 2: Descriptive statistics for the Compustat Segments dataset and our final sample, specifically
(1) portion of sales reported by firm-year observations in industries other than the primary industry, (2) average number of sub-industries that firm-year observations report sales in, (3) ratio of firm-year observations that report sales in more than one industry over the total number of firms in each industry, and (4) portion of firms that report sales in more than one industry. Utility industries (NAICS 22) have the lowest (0.57) average ratio of sales in other industries to sales in the primary industry; food, textile, and apparel manufacturing industries have the highest (0.87). There is a large variation in the average number of sub-industries that firms report sales in. Industries such as agriculture, fishing, and forestry (NAICS 11); utility (NAICS 22); and, construction (NAICS 23) have more diversified firm-year observations, while retail trade industries (NAICS codes 44 and 45) and real estate industries (NAICS 53) have less diversified firm-year observations. Finally, except for oil and gas industries (NAICS 21) and other services industries (NAICS 81), at least 45 percent of the firms in all industry groups report sales in more than one industry.
Compustat Segments Data NAICS
2-Digit Code
Ratio of Sales in Other Inds. over Sales in Primary Ind. Average Number of Sub-inds. for Firms-years Firms-years with Sale in Other Inds. to Total Firms
Portion of Firms with Sales in More Than One
Industry Firms Firm-year Obs. 11 0.74 2.02 0.42 0.57 76 797 21 0.58 1.38 0.21 0.34 1419 13296 22 0.59 1.99 0.47 0.66 466 6838 23 0.83 1.82 0.44 0.70 292 2823 31 0.88 1.69 0.34 0.59 703 7301 32 0.81 1.56 0.28 0.45 2622 27053 33 0.74 1.59 0.31 0.53 4289 47992 42 0.82 1.63 0.34 0.59 721 7081 44 0.71 1.35 0.22 0.45 488 5283 45 0.65 1.32 0.20 0.43 391 3419 48 0.58 1.61 0.31 0.52 484 5417 51 0.63 1.59 0.31 0.51 1680 16176 52 0.63 1.39 0.22 0.43 746 8838 53 0.76 1.42 0.25 0.50 1015 9377 54 0.75 1.66 0.35 0.60 483 4345 56 0.78 1.69 0.33 0.53 97 835 61 0.70 1.38 0.25 0.55 441 4142 62 0.78 1.51 0.31 0.56 173 1596 71 0.87 1.40 0.22 0.46 424 4181 72 0.78 1.46 0.29 0.48 85 738 81 0.98 1.50 0.17 0.37 550 4404 99 0.74 2.02 0.42 0.57 76 797 Final Sample NAICS 2-Digit Code Ratio of Sales in Other Inds. over Sales in Primary Ind. Average Number of Sub-inds. for Firms-years Firms-years with Sale in Other Inds. to Total Firms
Portion of Firms with Sales in More Than One
Industry Firms Firm-year Obs.
11 0.87 1.59 0.29 0.29 7 17 21 0.78 2.02 0.41 0.50 31 98 22 0.96 1.89 0.50 0.54 6 28 23 0.84 2.26 0.53 0.62 14 66 31 0.78 1.73 0.38 0.52 107 629 32 0.79 1.53 0.30 0.45 551 3280 33 0.70 1.50 0.30 0.47 1589 9741 42 0.82 1.64 0.37 0.48 109 570 44 0.65 1.26 0.18 0.31 252 1900
Table 2: (Continued) Final Sample NAICS 2-Digit Code Ratio of Sales in Other Inds. over Sales in Primary Ind. Average Number of Sub-inds. for Firms-years Firms-years with Sale in Other Inds. to Total Firms
Portion of Firms with Sales in More Than One
Industry Firms Firm-year Obs.
45 0.57 1.27 0.18 0.37 172 1125 48 0.89 1.22 0.22 0.56 5 9 51 0.48 1.33 0.22 0.40 99 425 52 0.64 1.32 0.25 0.40 94 607 53 0.83 1.55 0.33 0.52 88 413 54 0.84 1.52 0.35 0.45 53 220 56 0.74 2.16 0.55 0.65 9 31 61 0.70 1.48 0.33 0.56 59 267 62 0.77 1.32 0.19 0.23 31 189 71 0.87 1.26 0.18 0.37 196 1296 72 0.94 1.26 0.13 0.13 9 31 81 1.00 1.47 0.26 0.33 63 218 99 0.87 1.59 0.29 0.29 7 17
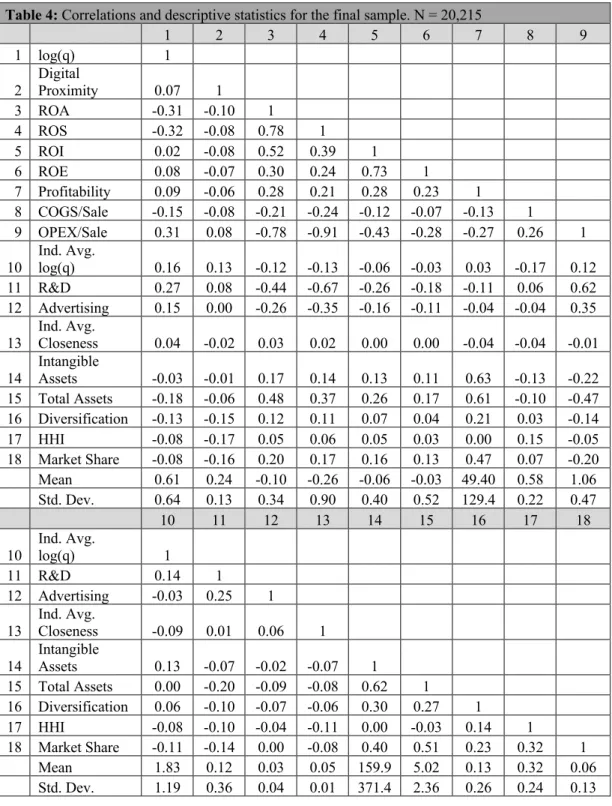
Table 3: Variable definition and data sources.
Variable Definition Data Source
Tobin’s q ((Annual calendar closing stock price * common shares outstanding) + total assets – total equity) / total assets
Compustat
ROA Net income / total assets Compustat
ROS Net income / sales Compustat
Total Profits Net income Compustat
OPEX to Sales (Cost of goods sold + selling and general administrative expenses) /
sales Compustat
COGS to Sales Cost of goods sold / sales Compustat
Digital
Proximity (dc) Industry-level digital proximity is measured as: DC!=
1
1 + (average shortest path to IT industries) We then form the firm-level digital proximity measure: dc!=
∑#"$% DC"Sales" n
where n is the total number of industries in which firm i reports sales.
Compustat Segments
Ind. Avg. Closeness Centrality
Average value of closeness centrality of firms reporting that industry as their primary industry within the industry space network. Closeness centrality of firms is measured as the weighted average closeness centrality of each industry in which firms report sales (Freeman 1979). Closeness centrality is the average shortest path from a node to all other nodes in the network.
Compustat Segments
R&D Intensity R&D expenditure / sales Compustat
Advertising
Intensity Advertising expenditure / sales Compustat
Total Assets Total assets, as reported. Compustat
Intangible Assets Total intangible assets, as reported. Compustat
Diversification Sum of squares (Firm’s sales in industry i / Total sales in industry i) / log(Firm’s sales in industry i / Total sales in industry i) for each industry i in which the firm operates (Jacquemin and Berry 1979).
Compustat Segments HHI Sum of square market share of each firm i in industry j (Hou and
Robinson 2006). Compustat
Weighted