GLOBAL COVERAGE OF MULTI-HOP FREE-SPACE OPTICAL
GROUND-TO-AIRLINER DATA LINKS
Alexander Wirthmüller, Laboratoire Temps-Fréquence, Université de Neuchâtel, Switzerland
Stefan Kalchmair, Laboratory for Nanoscale Optics, Harvard University, Cambridge, MA
Abstract
We present a model scenario in which airports and commercial aircraft are equipped with optical transceivers for high-speed onboard internet access. In a first step, basic line-of-sight calculations for ground station-to-flight and flight-to-flight are performed using timetable data published by major airline alliances. We then choose a set of relevant markets / arenas (both inter-continental and continental) to calculate respective aircraft reachability statistics. Based on this, the feasibility of single-hop and multi-hop data relays is estimated for typical scenarios. As several simplifying assumptions are made, we compare our data to actual historical flight data to judge the model’s accuracy. Finally, we discuss major technical and commercial aspects for an eventual implementation of this dynamic free-space optical network.
Introduction
The wish to provide passengers on intercontinental flights with reliable high-speed internet access calls for the evaluation of concepts which go beyond solutions currently in use. Some airlines offer access to ground-based GSM/3G infrastructure, which however is limited to inhabited regions. Other carriers equip their long-haul fleet with radio frequency (RF) transceivers that connect to a satellite-based system. While the latter offers global coverage, it is hampered by bandwidth shared between many customers, the impracticality of maintenance and risk of eavesdropping due to the use of radio signals with little directionality.
Ever increasing commercial air traffic and recent successful demonstrations of optical free-space ground-to-air data links give rise to the question whether multi-hop optical communication can be a solution for future high-speed internet access on flights over remote areas. We try to answer this question by analyzing recent timetable information from major airline alliances along with historical track points obtained from a commercial service.
This work is based on line-of-sight calculations: atmospheric perturbations (due to weather and temperature gradients) impeding communication are taken into account only in so far as that the line-of-sight distances obtained geometrically are reduced by applying conservative assumptions. The extent to which communication is affected by atmospheric effects is highly dependent on the carrier wavelength used. Due to low absorption and reduced Rayleigh scattering, we think that the mid-infrared spectral region (wavelengths of 8 µm and longer) can be highly interesting from an implementation point of view.
A dedicated software tool, BeamRelay [1], was developed over the course of the project. The necessity for this solution arises from the need to process large amounts of data (GB range), handle many calculations in parallel (cloud computing), and to be able to store intermediate results (database). To avoid overhead on writing code for other things (e.g. database access code, user interface) than problem specific functionality, a model-based approach with automated code generation was chosen. The functionality of BeamRelay is depicted in Figure 1.
Figure 1. BeamRelay Software Tool
Data Model and Algorithms
Our model relies on timetable data only for flight density estimation. The simple calculations
presented below are possible due to the key assumptions that:
• earth is a sphere of radius 6371 km. Actual ground station elevations are added by using NOAA’s global relief model [2]. Terrain impeding line-of-sight connections is not considered specifically, rather a general ground clearance requirement of 2000 m is used
• the set of ground stations comprises all 1446 airports included in the timetables used. They are assumed to have visibility cones based at their elevations above mean sea level (MSL) with a 85° half opening angle. We think this large angle is justified, as in case a ground station would have terrain obstacles (e.g. lie in a valley), for the local implementation an exposed location in proximity would be found • flights pass along great circles at a
constant altitude of 10.5 km with constant velocity. The assumed altitude is a lower bound for typical cruise altitudes of long distance flights. We discuss the impact of climb / descent and of the constant velocity assumption later on
Data Sources
The two primary sources used to obtain flight information include:
• star2011-12: the consolidated StarAlliance timetable, valid December 13, 2011 through February 26, 2012. This period is of interest as it includes low-traffic days around the Christmas and New Year’s holidays. Member airlines include A3, BD, JK, JP, KF, LH, LO, LX, OS, OU, SK, SN, TK and TP in Europe, AC, CO, JJ, PZ, UA and US in the Americas, CA, NH, OZ, SQ and TG in Asia, ET, MS and SA in Africa and NZ in Australia/Oceania • owMar2014: the consolidated oneworld
timetable, valid March 7, 2014 through April 4, 2014. Member airlines include AB, AY, BA, HG, IB and S7 in Europe, 4M, AA, LA and XL in the Americas, CX, EG, JC, JL, KA, MH, NU, QR and RJ in Asia, and QF in Australia/Oceania
As of 2014, StarAlliance does not provide consolidated timetables anymore. To be able to calculate approximate joint StarAlliance/oneworld flight density statistics, we define a timetable star2011-12∆ which is the timetable star2011-12 shifted in time, so that it overlaps with owMar2014 while maintaining a weekday match. It is important to note that the sets of airlines (and thus flight numbers) in the two original timetables are disjoint, as recent alliance changes (JJ and joint AA/US from StarAlliance to oneworld) are not taken into account in owMar2014.
Eventual multi-stop or connecting flights were broken into their constituent nonstop flights. As timetables state local departure / arrival times, manual association of airports with regions (continents / countries / states) at a granularity allowing for the distinct specification of the respective location’s time zone had to be performed.
Finally, aircraft types were classified into wide body / narrow body / regional categories and standard seating configurations were obtained from public internet resources.
Data Validation
Data integrity was assured by a systematic search for implausible average flight velocities (by route), and by comparing the average flight velocities on both directions of each pair of airports.
Basic Geometry Considerations
Table 1. Geometry Symbols Symbol Quantityre earth radius / MSL
af flight path altitude above MSL
eh required horizon clearance above
MSL
eg ground station elevation above
MSL
df-g flight-to-ground station great circle
distance at af
df1-f2 flight-to-flight great circle distance
at af
αg ground station-based cone half
opening angle
α'g αg equivalent cone half opening
angle at af
angle
angular geo-coordinate
normalized cartesian
geo-coordinate
angular coordinate in flight path / communication corridor coordinate system
normalized cartesian coordinate in
flight path coordinate system
Ā rotation matrix such that to transform geo-coordinates into flight path / communication corridor coordinates flight path / communication corridor angular distance
ω flight angular velocity
The key measures for the feasibility of relay connections are the possible flight-to-ground station
df-g and flight-to-flight df1-f2 distances covered, as
depicted in Figure 2.
Figure 2. Basic Line-of-Sight Geometry
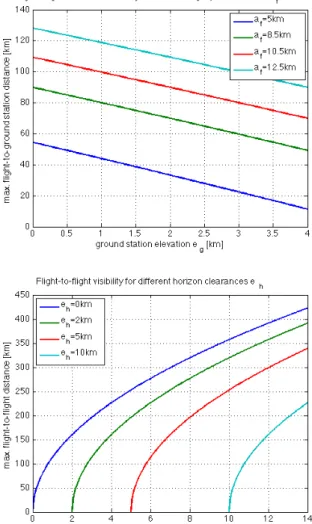
The assumption for df1-f2 is that no connection is
made beyond the horizon, and that above the horizon a margin of eh is maintained. Thus, the distance
theoretically possible for two aircraft cruising at the same af is halved - this is done as a tribute to
atmospheric scattering.
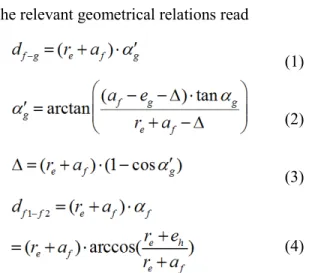
The relevant geometrical relations read
( (1) ( (2) ( (3) ( (4) where the angles αg = 85° and αf = 2.958° are
introduced to define the ground station and flight path visibility cones, respectively. As af and eh are
fixed, αf is valid universally. The solution for (1)-(3)
needs to be found numerically.
For many calculations in BeamRelay, it is useful to determine a flight path specific coordinate system with rotation matrix Ā in which the flight path between begin location rb and end location re lies in
the equatorial plane as
( (5)
( (6) where is the flight path angular distance.
Mutual Visibility Calculation
The computation effort for mutual visibilities is reduced significantly by first considering the static constellation of flight paths and ground stations with respect to one another. Based on this data, time-dependent calculations (i.e. the flights taking place on the flight paths) are performed only when needed for a specific connection limited in time.
Resulting line-of-sight distances are shown in Figure 3.
Figure 3. Theoretical Line-of-Sight Distances Flight Path-to-Ground Station
For a pair flight path / ground station, the ground station location is rotated into flight path coordinates , and the equivalent cone half opening angle α'g is
calculated. In case of mutual visibility, two intersections of the flight path with the equivalent cone can be found analytically:
( (7)
( (8) These intersections define the visibility interval as depicted in Figure 4.
Figure 4. Flight Path / Ground Station Geometry
Figure 5 shows the area which can be covered by ground stations / single-hop connections only.
Figure 5. Ground Station Line-of-Sight Coverage for 𝜶𝒈 = 85° and 𝒂𝒇 = 10.5 km
Flight Path-to-Flight Path
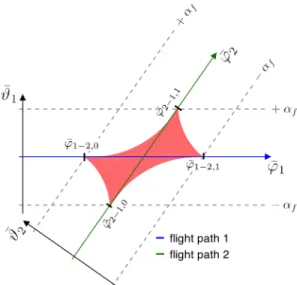
The geometry of two crossing flight paths (indices 1, 2) is shown in Figure 6 as the intersection of the and planes. While all possible lines-of-sight between flights are contained within the region marked in red, the calculation is limited to determining the points at which the origin flight 2 enters and leaves the destination flight’s 1 visibility cones (and vice versa). For this purpose, the origin flight, parameterized by , is rotated into
coordinates. This is followed by the numerical solution of
(9) (10) for and representing begin and end positions of the visibility in coordinates.
Figure 6. Mutual flight path visibility Communication Corridors
For practical reasons, the determination of relay opportunities is limited to a band around the connection’s great circle. The implementation is in terms of communication corridors which are handled in a similar fashion as flight paths, in particular by defining visibility cones. Continental connections consider a band 400 km in width (corresponding to a cone half opening angle of αc = 1.799° while for
inter-continental connections 800 km are taken into consideration (αc = 3.597°).
Flight-to-Ground Station
Due to the linear relation
between flight path angle and time, the calculation of flight-to-ground station visibility is straightforward, based on flight path-to-ground station visibility data.
Flight-to-Flight
The flight-to-flight calculation is more involved: pre-filtering of flights to be matched includes the evaluation of static mutual flight path visibilities, and the analysis of the time spans during which the flights are airborne. The actual duration for which two flights can have line-of-sight contact can then be determined by solving the dot product
(11) numerically for t0 and t1, representing start and stop
times of mutual visibility.
Relay Calculation
Equipment Line-Up
In order to calculate a relay connection that follows a specific direction (backward / forward) along the communication corridor, it is necessary to establish a linear equipment order ei, or line-up, for
the connection duration . Equipment comprises both ground stations and flights ; the time-dependent position i is defined by the respective equipment’s coordinate within the communication corridor. Instead of calculating snapshots at defined intervals during the connection time span, a list with insert, remove, before and to-after operators is generated.
At first, all equipment available for the connection is obtained from mutual visibility data and an initial line-up at t0 is determined. Time stamp
calculation for insert and remove operators is straightforward. For the to-before and to-after operators, the time stamps at which equipment switches position within the line-up need to be determined. A simple toggle operator can not be used due to the time t granularity of one second which can yield multiple simultaneous operations involving the same equipment. Mathematically, the problem
(12) (13) needs to be solved numerically for t, for flight-flight position switches ; the index c denotes the communication corridor and its coordinate system. Flight-ground station position switches are calculated in a similar fashion, with one of the angles invariant in time.
Relaying
The relaying algorithm combines the equipment line-up and the ground station / flight-to-flight visibility information. For a connection with an (airborne) flight as the target, an attempt is made to establish relays to one ground station ahead and one ground station behind, within the equipment line-up, at any time. The algorithm ensures that if a forward
(backward) relay is possible, it is found. If no ground station can be reached, a tree structure with all reachable (flight) equipment is determined.
Forward (backward) relays are strictly forward (backward) as far as flights are concerned. However, to make a direct connection to a ground station, a change in direction (forward / backward) is permissible. At the time at which a forward relay is
established, the corresponding ground station end point is located ahead of the target flight. As the target flight advances, it is possible that it passes the ground station that initially was the end point of the forward relay. Although this effectively establishes a second backward relay, it is maintained until connectivity is lost. An exemplary relay situation is shown in Figure 7.
Figure 7. One-Hop Backward Relay and Two-Hop Forward Relay for Flight LH401 (JFK-FRA) Close to Nova Scotia on January 15, 2012 (star2011-12)
It has to be noted that for an actual implementation the number of hops (the fewer the better) and the relay duration (no need to re-connect for long periods desirable) should be optimized.
A first step towards statistical analysis is taken by determining the time evolution of the reachability
for each flight, independent of the specific relays established. For selected flights, this is shown in Figure 8: distinguished are one way (light green) and both ways (green) connectivity to ground, connectivity to at least one other airplane (yellow), and no connection (red).
Figure 8. Reachability for Some Long Distance Flights on January 15, 2012 (star2011-12)
Statistical Analysis
Arenas
Table 2 lists the world regions / arenas investigated. They were chosen in order to achieve geographical diversity and to take into account the respective market shares of the concerned airline alliances.
Table 2. Arena Definitions for Statistical Analysis trans-oceanic arenas (“to”)
to1 North Atlantic arena: Europe vs. North America
to2 South Atlantic arena: Europe vs. {Argentina, Brazil, Chile, Uruguay} to3 North Pacific arena: North America vs.
{East Asia, South East Asia} to4 Continental U.S. vs. Hawaii arena
other inter-continental arenas (“ico”)
ico1 Trans African arena: Europe vs. South Africa
ico2 Trans Siberian arena: Europe vs. East Asia
ico3 Pan American arena: North America vs. South America
continental arenas (“co”)
co1 European arena co2 Contiguous U.S. arena co3 China arena
Metrics
The local passenger densities and connectivity success rates are defined as
(14) (15) in which the respective passenger counts are derived from aircraft type seating capacities. For an entire arena, the corresponding densities are integrated over the element areas Ael, to obtain the lumped
passenger-hour densities and connectivity success rates, denoted as D and P, respectively.
Initial Observations
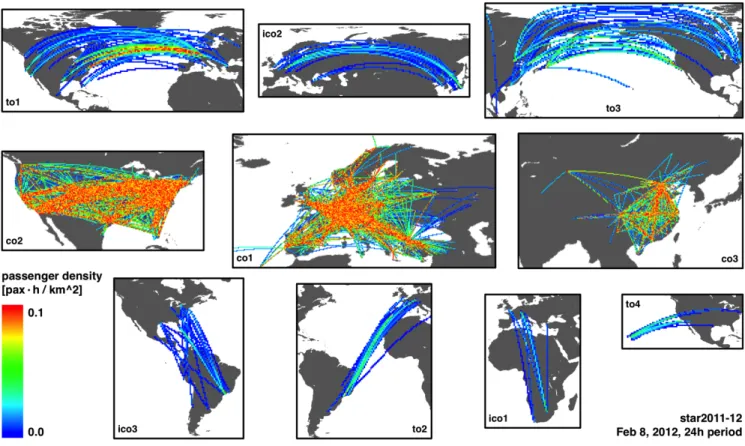
For visualization, results were superimposed with continent maps [3] in Mercator projection. The approximate passenger densities in the various arenas can be identified immediately as shown in Figure 9. Striking features include the very high passenger density above the North Atlantic and the simple identification of airline hubs.
Figure 9. Passenger Density by Arena
Furthermore, in Figure 10, the bundled daytime / overnight operation of long-haul flights in major east-west (to1, to3 – east-westbound in blue) and north-south (ico1, ico3 – southbound in blue) markets is clearly visible. It also becomes evident that most long-distance routes are not overly weekday dependent.
Reachability by Arena
In both timetables, an average Wednesday was chosen for analysis: February 8, 2012 for star2011-12 and March 12, 2014 for owMar2014. For initial calculations, represented in the first and third result columns of Table 3, all aircraft of the respective alliance were assumed to be equipped with optical transceivers. From the non-continental arenas, to1 stands out with the highest connectivity success rate.
The continental arenas feature almost full coverage – comparison with Figure 5 shows that this is not only due to coverage with many ground stations but due to many possibilities of multi-hop relays.
It should be noted that throughout all arenas, the timetable with the higher D (star2011-12 in all cases but ico3) also achieves the higher P.
Figure 11. Local Connectivity Success Rates Table 3. Lumped Connectivity Success Rates by Arena
Widebody Aircraft Only
With few exceptions, long-distance flights are performed by widebody aircraft which constitute a <10% subfleet of all commercial aircraft. Equipping only them with optical transceivers was thus investigated as shown in the result columns 2, 4 and 6 of Table 3. Figure 12 additionally reveals that the added connectivity resulting when all aircraft are equipped is provided close to land, where typical short-haul flights take place.
Figure 12. Connectivity Success Rate All Aircraft
vs. Widebody Only (owMar2014) Joint Staralliance / Oneworld Timetable
Motivated by the trend that a higher D results in a higher P, we used a time-shifted version of star2011-12 and superimposed it with owMar2014, such that StarAlliance flights actually taking place on February 8, 2012 take place on March 12, 2014. The results can be found in columns 5 and 6 of Table 3. Indeed, all arenas yield connectivity success rates higher than both individual timetable’s P’s. A notable exception is ico1 in which the combined P is higher than the P of owMar2014 but lower than the P of star2011-12. This can be attributed to routings which are geographically separated in most parts.
Figure 13. Connectivity Success Rate owMar2014
vs. Joint Timetables
Model Improvements
There are two shortfalls of the model used. First, flights on short sectors tend to be overrepresented when assuming scheduled flight time. Second, actual flight routing is affected by weather and air traffic control constraints. The impact of both effects was studied by using historical track points obtained from [4] for owMar2014 flights in the week March 9, 2014 to March 15, 2014. The coverage of this data is incomplete. While complete data sets exist for flights above North America, Europe and Japan, some flights are listed with their actual departure and arrival times only ; for other flights, no detail information could be obtained at all. A full analysis using historical data only was thus not feasible, also due to glitches in flight routing present in the data.
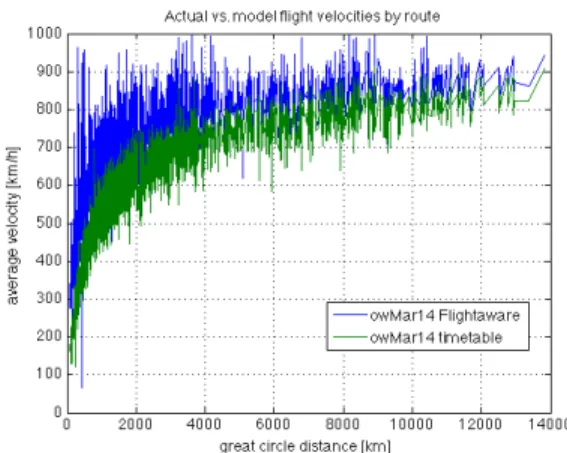
Velocity
The velocity discrepancy is a result of time margins which are added in timetables to ensure reliable operation. They take into account ground operations and eventual delays. The time margin-to-timetable time ratio is higher for short flights which is nicely evidenced in Figure 14. It can be seen that even actual flight velocities are reduced for flights shorter than 2000 km, this can be attributed to reduced speed in flights’ climb and approach phases.
Figure 14. Velocity Discrepancy Between Actual and Timetable Data
Altitude
The availability of flights for relay connections is overestimated when assuming them to be present at 10.5 km even during climb and descent (cf. Figure 3, lower part). Again, this effect is more pronounced for short flights. An improved model could work with altitude profiles as depicted in Figure 15: during climb and descent, the flight has connectivity to its origin and destination ground stations only and is not available for additional relay connections. As short flights may not reach af, a requirement is set up that a
flight path needs to be at cruise altitude for at least 1/3 of the great circle distance. The corresponding calculations read:
(17) (18) in which is the resulting cruise altitude. For our data, 1075 out of 10979 flight paths would have to be reduced from 10.5 km altitude accordingly.
Figure 15. Improved Flight Altitude Profile Routing
Finally, the historical waypoint data was used to qualitatively compare great circle (model) routing to actual routing. This analysis is of interest, as for high connectivity success rates not only bundled operation in time (cf. Figure 10) but also in space is advantageous. Generally, traffic guided by ATC waypoints and weather should thus improve the model results. A comparison of flight densities is shown in Figure 16. Non-great circle contributions can be clearly identified.
Figure 16. Great Circle vs. Actual Routing (owMar2014, 24h Period)
Implementation Aspects
In the following we argue for the implementation of the proposed network by means of optical free-space communication using the mid-infrared spectral range. Before a commercial realization could take place, numerous technical (and
political) challenges would need to be overcome, some of which are mentioned here.
Transceiver Hardware
Reliable communication between aircraft is challenging, but can be achieved with existing technology. Most systems available rely on RF links, since the technology is well established. However, they cannot provide sufficient data transmission capacity for modern internet services.
Free-space optical communication offers various advantages compared to RF solutions [5], mainly higher data rates (1-40 Gbps vs. 200-800 Mbps) and high directionality. Good directionality is desirable to prevent interference and to increase communication security. In addition, unwanted reflections from foreign airborne objects are greatly reduced.
A common figure of merit for the performance of free-space communication systems is the maximum link distance at a given data rate and emitter power. RF systems allow communication over several hundred kilometers, however, at low data rates only. While existing free-space optical data links allow much higher data rates, distances are limited to tens of kilometers [5]. The reason is absorption and scattering of visible light in the atmosphere. Furthermore, reasonable link quality is achieved in good weather conditions only.
The dominant causes for atmospheric perturbations of optical signals are absorption by water vapor and Rayleigh scattering on dust particles. Fortunately, at around 8 µm wavelength water vapor is not absorbing, hence this region is called an atmospheric transmission window. In addition, Rayleigh scattering decreases with increasing wavelength and becomes almost negligible around 8 µm wavelength. In this region the atmosphere is highly transparent, making it perfectly suited for free-space optical communication. Figure 17 compares measured attenuation values for near-infrared and mid-infrared data links in a real-world scenario for various weather conditions [6].
1 10 0 2 4 6 8 10 12 Rain Near-IR (1.345 um) Near-IR (1.55 um) Mid-IR (8.1 um) A ttenuat ion ( dB /k m ) Visibility (km) Fog
Figure 17. Attenuation of Near-IR and Mid-IR Light for Different Weather Conditions [6]
The essential components to implement a free-space optical data link are a stable high power laser, a fast detector and a precise tracking system.
Visible wavelengths are not well suited for free-space communication, even though light sources and detectors are highly efficient in this wavelength range. Visible light is strongly scattered in the atmosphere and already small laser powers can cause severe damage to the human eye.
For near-infrared wavelengths (1.3 µm and 1.55 µm), technology is well-established and has been pushed by the development of fiber integrated communication networks. Erbium doped fiber lasers provide high powers, stable emission and fast modulation speed. Various photo-detector technologies are available providing excellent detectivity and detector response times. However, due to atmospheric scattering, high data rates over long distances can only be achieved using very high laser powers [5].
The mid-infrared technology platform (8 µm wavelength) on the other hand is less established, but has matured sufficiently to be implemented in commercial products. Quantum cascade lasers (QCL’s) provide high power, good modulation speed and are available for any wavelength from 3 µm to 20 µm. The most common photo-detectors for the mid-infrared wavelength range are Mercury Cadmium Telluride (MCT) detectors. Generally, these detectors are slightly less efficient than their near-infrared counterparts, but this is more than compensated by the improved atmospheric transmission over long distances [6]. Furthermore, mid-infrared light cannot
penetrate aircraft windows and is eye-safe to potential bystanders.
Tracking systems for the finding and dynamic reconnection of partner aircraft certainly is a challenge (moving origin and target). However, it is done in military target tracking and should be technologically feasible. Recently, a ground-to-air tracking system has been demonstrated, which is capable of streaming high-resolution video at 1 Gbps from a flying Tornado jet aircraft moving at 800 km/h over a distance of 60 km [7].
Commercial Aspects
For the scenario presented here to work, all aircraft involved would need to be equipped with corresponding transceivers, which is a considerable cost factor. In addition, the decision to implement the proposed network would require the teaming up of multiple leading airlines or even airline alliances. However, the approach to equip widebody aircraft only with transceivers may alleviate the initial financial burden. As the widebody aircraft market is held by the Airbus-Boeing duopoly, a strategic alliance between those two companies might help establishing our proposed technology as well.
It should be noted that the implementation cost is to be compared to that of launching and operating a network of satellites (with their known drawbacks), so that we see our solution as a competitive alternative.
Possible Extensions
With current air traffic densities, our calculations (e.g. ico1, ico2) show little coverage above sparsely populated areas. While little can be done about lacking coverage above deep-sea areas, connectivity e.g. above Siberia or close to a shoreline could be enhanced by adding a set of captive balloons at altitudes up to 4 km. No significant interference with air traffic is to be expected as – with no airport in proximity – flight paths lie much higher in altitude. Comparable systems have been put to use before [8]. In contrast to solar-powered airborne systems [9], [10] which are unable to navigate against the wind and have a limited power budget for optical transceivers, a system of captive balloons could operate autonomously by tapping into the solar or geo-thermal power of a large surrounding area on the ground.
Using our model, a communication corridor with captive balloons could be established as shown in Figure 18. Its width varies between wmin and 2 x df1-f2
at cruise altitude. The corresponding formulas read (19)
(20)
Figure 18. Balloon Placement Along a
Communication Corridor
To give an example, for a balloon spacing of 160 km (altitude ab = 4 km) along the corridor, its
width varies between 576 km and 659 km, assuming a cruise altitude of 10.5 km.
Conclusion and Outlook
In summary, we have presented an in-detail study of global aircraft reachability above remote areas by means of multi-hop free-space optical communication. The software tool BeamRelay, which was developed along the way allows for the fine-grained specification of model parameters and is easily extensible for advanced models or other data sets.
It could be shown that already today, high density markets such as the North Atlantic exist in which success rates higher than 70% can be achieved. Currently underway is the implementation of model improvements which take into account more realistic flight paths for short-haul flights. In addition, the strategic placement of captive balloons above remote (land) areas is studied in order to improve the results for markets such as the Trans African or Trans Siberian arenas.
We think that multi-hop free-space optical communication is a promising solution for the future, considering advancements in underlying technology and ever-increasing air traffic. Mid-infrared lasers
and detectors might turn out to be the key technology, due to advantageous atmospheric transmission and eye-safe operation.
References
[1] A. Wirthmüller, BeamRelay: http://www.epsitechnologies.com/preview/styled/styl
ed-2/index.html, retrieved on March 29, 2014
[2] NOAA, ETOPO1 global relief model: http://www.ngdc.noaa.gov/mgg/global/global.html, retrieved on March 29, 2014
[3] NASA Goddard institute, Panoply: http://www.giss.nasa.gov/tools/panoply/overlays/,
retrieved on March 29, 2014
[4] Flightaware, FlightXML service: http://flightaware.com/commercial/flightxml/,
retrieved on March 29, 2014
[5] Y. Koishi et al., International Conference on Space Optical Systems and Applications (ICSOS), May 2011
[6] Paul Corrigan et al., Optics Express Vol. 17, Issue 6, pp. 4355-4359 (2009)
[7] ViaLight Communications GmbH VLC: http://www.vialight.de/index.php?id=180, retrieved on April 15, 2014
[8] Wikipedia article on Tethered Aerostat Radar System:
http://en.wikipedia.org/wiki/Tethered_Aerostat_Rada r_System, retrieved on April 20, 2014
[9] Google, Loon project: http://www.google.com/loon/, retrieved on April 20,
2014
[10] BBC, Google’s acquisition of Titan Aerospace: http://www.bbc.com/news/business-27029443, retrieved on April 20, 2014
Acknowledgements
The authors would like to thank Lubos Hvozdara, Cornel Stücheli, Ophir Gaathon and Martin Hoffmann for useful discussions.


![Figure 17. Attenuation of Near-IR and Mid-IR Light for Different Weather Conditions [6]](https://thumb-eu.123doks.com/thumbv2/123doknet/15019574.682669/12.918.495.811.84.320/figure-attenuation-near-mid-light-different-weather-conditions.webp)