DOI: 10.1126/science.1185581
327
, 993 (2010);
Science
et al.
Felix G. Marx,
of the Evolution of Modern Whales
This copy is for your personal, non-commercial use only.
.
clicking here
colleagues, clients, or customers by
, you can order high-quality copies for your
If you wish to distribute this article to others
.
here
following the guidelines
can be obtained by
Permission to republish or repurpose articles or portions of articles
(this information is current as of February 22, 2010 ):
The following resources related to this article are available online at www.sciencemag.org
http://www.sciencemag.org/cgi/content/full/327/5968/993
version of this article at:
including high-resolution figures, can be found in the online
Updated information and services,
http://www.sciencemag.org/cgi/content/full/327/5968/993/DC1
can be found at:
Supporting Online Material
found at:
related to this article
can be
A list of selected additional articles on the Science Web sites
http://www.sciencemag.org/cgi/content/full/327/5968/993#related-content
http://www.sciencemag.org/cgi/content/full/327/5968/993#otherarticles
cites 21 articles
, 7 of which can be accessed for free:
This article
http://www.sciencemag.org/cgi/content/full/327/5968/993#otherarticles
cited by
1 articles hosted by HighWire Press; see:
This article has been
http://www.sciencemag.org/cgi/collection/paleo
Paleontology
subject collections
:
This article appears in the following
is a
Science
2010 by the American Association for the Advancement of Science; all rights reserved. The title
Copyright
American Association for the Advancement of Science, 1200 New York Avenue NW, Washington, DC 20005.
(print ISSN 0036-8075; online ISSN 1095-9203) is published weekly, except the last week in December, by the
Science
on February 22, 2010
www.sciencemag.org
The discovery of early Middle Jurassic and Late Cretaceous †pachycormids with anatomical features that are consistent with suspension feeding (4) alters the picture of the evolution of this ecological guild in the Mesozoic and afterward. Oceans during much of this interval have been viewed as devoid of large-bodied suspension feeders (25), but we now recognize that †pachycormids occupied this ecological role for much of the Mesozoic (Fig. 3). Marine reptiles diversified prolifically during this geo-logical interval, attaining massive sizes and evolving specializations attributed to suction and ram feeding (26), but there is no clear evi-dence that they ever adopted planktivory. This observation, coupled with the perceived absence of large-bodied planktivores during most of the Mesozoic, led to suggestions that anatomical constraints prevented these otherwise diverse marine amniote clades from exploiting suspen-sion feeding (25). Our findings suggest that marine reptiles might have been excluded from this trophic strategy by incumbent †pachycormids.
The first fossil occurrences of modern large-bodied suspension feeders are confined to the Cenozoic: manta rays and whale sharks in the late Paleocene (1), basking sharks in the mid-Eocene (2), and plankton-feeding whales near the Eocene-Oligocene boundary (3). The only example with a possible Mesozoic record is the megamouth shark Megachasma, but there is a 75-million-year interval between a few isolated Late Cretaceous teeth and the next oldest occurrence, which dates to the late Oligocene–early Miocene (27). The radiation of large-bodied suspension-feeding chondrichthyans and whales in the Paleo-gene follows the disappearance of †Bonnerichthys and many other large-bodied marine teleosts (28, 29) during the end-Cretaceous extinction, suggesting that familiar modern groups of plank-tivores diversified into the ecospace vacated by giant †pachycormids.
References and Notes
1. H. Cappetta, C. Duffin, J. Zidek, in The Fossil Record 2, M. Benton, Ed. (Chapman & Hall, London, 1993), pp. 593–609. 2. A. L. Cione, M. A. Reguero, Antarct. Sci. 10, 83 (1998). 3. E. M. G. Fitzgerald, Proc. Biol. Sci. 273, 2955 (2006). 4. S. L. Sanderson, R. Wassersug, in The Skull, vol. 3,
J. Hanken, B. K. Hall, Eds. (Univ. of Chicago Press, Chicago, IL, 1993), pp. 37–112.
5. S. N. Jarman, Biol. J. Linn. Soc. Lond. 73, 199 (2001). 6. P. G. Falkowski et al., Science 305, 354 (2004). 7. A. Bartholomai, Mem. Queensl. Mus. 49, 521 (2004). 8. L. Cavin, P. L. Forey, in Mesozoic Fishes 4—Homology
and Phylogeny, G. Arratia, H.-P. Schultze, M. V. H. Wilson, Eds. (Verlag Dr. Friedrich Pfeil, München, 2008), pp. 199–216.
9. D. M. Martill, N. Jahrb, Geol. Palaeontol. 1988, 670 (1988).
10. P. Lambers, thesis, Rijksuniversiteit Groningen, Groningen, Netherlands (1992).
11. J. Liston, in Mesozoic Fishes 3—Systematics, Paleoenvironments and Biodiversity, G. Arratia, A. Tintori, Eds. (Verlag Dr. Friedrich Pfeil, München, 2004), pp. 379–390.
12. J. Liston, in Mesozoic Fishes 4—Homology and Phylogeny, G. Arratia, H.-P. Schultze, M. V. H. Wilson, Eds. (Verlag Dr. Friedrich Pfeil, München, 2008), pp. 181–198.
13. J. J. Liston, L. F.Noè, Arch. Nat. Hist. 31, 236 (2004). 14. Etymology: The generic name is a homophone of an
unpublished name by G. Mantell (“Rhynchonichthys”) and evokes the whale shark Rhincodon. The specific name honors H. W. Taylor, collector of the type. Systematics: Osteichthyes Huxley, 1880; Actinopterygii Woodward, 1891; Teleostei Müller, 1846 (sensu de Pinna 1996); †Pachycormidae Woodward, 1895; and †Rhinconichthys taylori gen. et sp. nov. Holotype: BMNH (The Natural History Museum, London) 219, nearly complete three-dimensional skull lacking anterior skull roof and posterior portions of lower jaws. Diagnosis of genus and species: Edentulous †pachycormid differing from other members of that group in having exceptionally elongated posterior processes of the dermopterotics and a proximal head of hyomandibula rounded rather than laterally compressed. Locality and age: Lower Chalk (Late Cretaceous, Cenomanian), Burham, Kent, UK. 15. Materials and methods are available as supporting
material on Science Online.
16. Etymology: The generic name honors the Bonner family, Scott City, Kansas, which has made many important discoveries in the Niobrara Formation, including KUVP (University of Kansas Natural History Museum, Lawrence, Kansas) 60692. Systematics: Osteichthyes Huxley, 1880; Actinopterygii Woodward, 1891; Teleostei Müller, 1846 (sensu de Pinna 1996); †Pachycormidae Woodward, 1895; †Bonnerichthys nov. gen.; and †Bonnerichthys gladius (Cope, 1874), comb. nov. Holotype: AMNH (American Museum of Natural History, New York) FF 1849, incomplete pectoral fin. Diagnosis of genus and species: Edentulous †pachycormid differing from other members of that group in having a rostrodermethmoid with ventrolateral processes, basioccipital with deep aortic groove, dermal bones of skull unsutured, and anterior margins of pectoral fins irregularly crenellated. Locality and age: Type from Niobrara Formation (Late Cretaceous, Coniacian-Campanian), Kansas, USA.
17. J. D. Stewart, in Geology, Paleontology and
Biostratigraphy of Western Kansas, M. E. Nelson Ed. (Fort Hays State Univ., Hays, KS, 1988), pp. 80–94.
18. D. C. Parris, B. S. Grandstaff, W. B. Gallagher, Spec. Pap. Geol. Soc. Am. 427, 99 (2007).
19. A. J. Mainwaring, thesis, Westfield College, University of London, London, UK (1978).
20. A. S. Woodward, The Fossil Fishes of the English Chalk (Palaeontographical Society, London, UK, 1902). 21. H. L. Jessen, Fossils Strata 1, 1 (1972).
22. J. S. Nelson, Fishes of the World (Wiley, Hoboken, NJ, 2006).
23. J. A. Freedman, D. L. G. Noakes, Rev. Fish Biol. Fish. 12, 403 (2002).
24. L. M. Page, B. M. Burr, A Field Guide to Freshwater Fishes of North America and North of Mexico (Houghton Mifflin, Boston, 1991).
25. R. Colin, C. M. Janis, in Ancient Marine Reptiles, J. M. Callaway, E. L. Nicholls, Eds. (Academic Press, San Diego, CA, 1997), pp. 451–466.
26. E. M. Nicholls, M. Manabe, J. Vertebr. Paleontol. 24, 838 (2004).
27. K. Shimada, J. Vertebr. Paleontol. 27, 512 (2007). 28. L. Cavin, in Geological and Biological Effects of Impact
Events, E. Buffetaut, C. Koeberl, Eds. (Springer Verlag, Berlin, 2001), pp. 141–158.
29. M. Friedman, Proc. Natl. Acad. Sci. U.S.A. 106, 5218 (2009).
30. M.F. was funded by an Environmental Protection Agency Science to Achieve Results Fellowship (award FP916730). We thank T. Uyeno and M. Manabe for provenance data for the Japanese pachycormid, S. Moore-Fay for exacting specimen preparation, R. Nicholls for his reconstruction of †Bonnerichthys, and M. Brazeau, L. Sallan, and three anonymous reviewers for their constructive comments.
Supporting Online Material
www.sciencemag.org/cgi/content/full/327/5968/990/DC1 SOM Text
Figs. S1 to S15 References
16 November 2009; accepted 25 January 2010 10.1126/science.1184743
Climate, Critters, and Cetaceans:
Cenozoic Drivers of the Evolution
of Modern Whales
Felix G. Marx1,2* and Mark D. Uhen3
Modern cetaceans, a poster child of evolution, play an important role in the ocean ecosystem as apex predators and nutrient distributors, as well as evolutionary “stepping stones” for the deep sea biota. Recent discussions on the impact of climate change and marine exploitation on current cetacean populations may benefit from insights into what factors have influenced cetacean diversity in the past. Previous studies suggested that the rise of diatoms as dominant marine primary producers and global temperature change were key factors in the evolution of modern whales. Based on a comprehensive diversity data set, we show that much of observed cetacean paleodiversity can indeed be explained by diatom diversity in conjunction with variations in climate as indicated by oxygen stable isotope records (d18O).
M
odern cetaceans (Neoceti), the mysti-cetes and odontomysti-cetes, show a number of mass-feeding adaptations beyond the immediate demands of an aquatic existence (1). Whereas mysticetes have become edentu-lous and rely on baleen to filter food from the water, odontocetes have evolved the ability to search for prey by means of echolocation. What unites these two different adaptive strategies is their effectiveness in terms of mass feeding:Whereas mysticetes obtain enormous amounts of small prey by filtering vast quantities of water, odontocetes may be able to use their biosonar to locate the vertically migrating layers of plank-ton with their associated grazers and predators known as deep scattering layers (1). To support such large and abundant apex predators, the eco-systems exploited by cetaceans must be extremely productive, and the energy captured by primary producers must be transmitted very efficiently
on February 22, 2010
www.sciencemag.org
through the food web (2). Compared with photo-synthetic bacteria and nannoplankton, diatoms, the dominant marine producers of today, are rela-tively large organisms (3) and are thus likely to be at the base of a food web with relatively fewer intermediate consumers (1, 2). This shortening of the food web reduces the amount of trophic frac-tionation between the original photosynthetic event and the final consumption by apex predators, such as cetaceans, thus allowing the latter to forage more efficiently and grow larger, more abundant, and more diverse as a result (1).
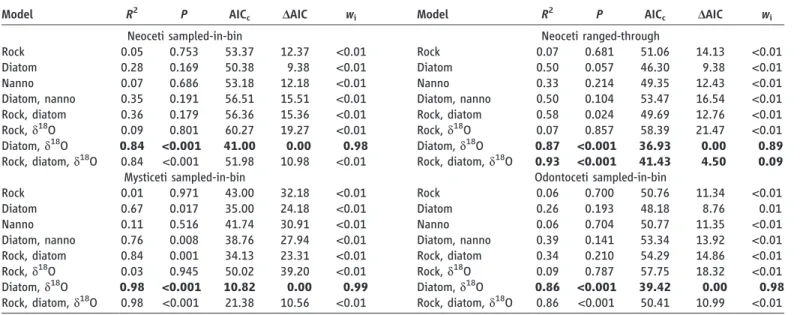
We investigated whether the rise of diatoms to dominance may have triggered the radiation of neocetes (1) by fitting a set of a priori models (Table 1) to a comprehensive genus-level cetacean diversity data set (n = 204) downloaded from the Paleobiology Database (4), as well as by assessing the explanatory power of the different models using the second-order Akaike’s Information Cri-terion (AICc) and Akaike weights (wi) (5, 6).
Apart from diatom and nannoplankton species diversity, which we downloaded from the Nep-tune database (7) (comparable dinoflagellate data were unavailable), our set of potential predictors also comprised oxygen isotope records (expressed as d18O values), a proxy reflecting both
temper-ature and global ice volume (8). These records allowed us to test for the effect of primary pro-duction (1) and climate change (9), respectively.
In addition, we included two measures of global marine rock abundance to account for the poten-tially biasing effect of the variable amount of pre-served sedimentary rock on our cetacean diversity data (10). Our first estimate consisted of the total number of fossiliferous marine formations; our second estimate was a subset of the former and included only those formations that have produced any vertebrate fossils, to account for potential pre-servational biases. Both were downloaded from the Paleobiology Database (4).
In addition to the sampled-in-bin cetacean diversity data, we also included a biologically ad-justed diversity estimate in our analysis to investi-gate whether this would result in a strengthening of any observed relationships between the di-versity and environmental data. For this adjusted estimate, taxa were ranged through time bins in which they had not actually been sampled, pro-vided that the taxon in question had already been recorded in at least one earlier and one later bin. We accounted for variations in stage length by in-cluding stage duration as a nonoptional predictor in all our models. Furthermore, we accounted for non-normality and nonconstant variances, which are often associated with count data like ours, by square-root-transforming cetacean diversity in all analyses, and for temporal autocorrelation by fitting autoregressive models to our original data and using generalized least squares where appro-priate (4). We ran two sets of models based on our two estimates of rock abundance. However, because the results of both sets were similar, we decided to focus on the total number of marine formations [see (4) for further details].
Out of our models, the combination of dia-tom species diversity and d18O values was most
strongly associated with cetacean diversity (Fig.
1 and Table 1). This was true for the sampled-in-bin data both for the whole of Neoceti and for mysticetes and odontocetes viewed separately, with mysticete diversity being particularly well predicted by this model (Tables 1 and 2). By contrast, we could not clearly distinguish between the model including diatom diversity and d18O
only and the model including diatom diversity, d18O, and rock abundance as far as the
ranged-through data were concerned, the latter model having an Akaike weight of nearly 0.1. Because the diatom and d18O model is nested within the
latter, we were able to test whether the more parameter-rich model explained our data signifi-cantly better by using a likelihood ratio test. This test showed a significant improvement of the mod-el also including rock abundance over the modmod-el including just diatom diversity and d18O for the
neocete ranged-through data (Χ2 = 6.50, P =
0.011) but not for the sampled-in-bin data (Χ2= 0.02, P = 0.879). Interestingly, in all of the fav-ored models the link between phytoplankton and cetacean diversity was restricted to diatoms only, as nannoplankton failed to explain much of the variance in the cetacean data both on its own and in combination with diatoms.
The link between diatom diversity and ob-served cetacean diversity supports the hypothesis that diatom-based primary production has been an important driver of neocete evolution (1). Sim-ilarly, the observation that climate change also has a role to play is not surprising in light of recent research that has demonstrated substantial temperature-dependent variations in the diversity of extant cetaceans (9). Finally, the observation that the model including diatom diversity and d18O
seems to explain mysticete diversity relatively bet-ter than odontocete diversity is reasonable, consid-Table 1. Comparison of a number of a priori models attempting to explain
cetacean paleodiversity based on the PaleoDB diversity data as sampled per bin. d18O, oxygen isotope records used as proxy for climate change (8);
diatom, diatom species diversity (Neptune database) (7); nanno, nannoplank-ton species diversity (Neptune database) (7); rock, total number of
fos-siliferous marine formations as downloaded from the PaleoDB (4). All models also included geologic stage duration as a nonoptional predictor to account for the potentially biasing effect of unequal Cenozoic stage durations. The R2
shown is the generalized R2proposed by (26) and (27). The preferred models
are shown in bold.
Model R2 P AIC
c DAIC wi Model R2 P AICc DAIC wi
Neoceti sampled-in-bin Neoceti ranged-through
Rock 0.05 0.753 53.37 12.37 <0.01 Rock 0.07 0.681 51.06 14.13 <0.01 Diatom 0.28 0.169 50.38 9.38 <0.01 Diatom 0.50 0.057 46.30 9.38 <0.01 Nanno 0.07 0.686 53.18 12.18 <0.01 Nanno 0.33 0.214 49.35 12.43 <0.01 Diatom, nanno 0.35 0.191 56.51 15.51 <0.01 Diatom, nanno 0.50 0.104 53.47 16.54 <0.01 Rock, diatom 0.36 0.179 56.36 15.36 <0.01 Rock, diatom 0.58 0.024 49.69 12.76 <0.01 Rock, d18O 0.09 0.801 60.27 19.27 <0.01 Rock, d18O 0.07 0.857 58.39 21.47 <0.01 Diatom, d18O 0.84 <0.001 41.00 0.00 0.98 Diatom, d18O 0.87 <0.001 36.93 0.00 0.89 Rock, diatom, d18O 0.84 <0.001 51.98 10.98 <0.01 Rock, diatom, d18O 0.93 <0.001 41.43 4.50 0.09
Mysticeti sampled-in-bin Odontoceti sampled-in-bin
Rock 0.01 0.971 43.00 32.18 <0.01 Rock 0.06 0.700 50.76 11.34 <0.01 Diatom 0.67 0.017 35.00 24.18 <0.01 Diatom 0.26 0.193 48.18 8.76 0.01 Nanno 0.11 0.516 41.74 30.91 <0.01 Nanno 0.06 0.704 50.77 11.35 <0.01 Diatom, nanno 0.76 0.008 38.76 27.94 <0.01 Diatom, nanno 0.39 0.141 53.34 13.92 <0.01 Rock, diatom 0.84 0.001 34.13 23.31 <0.01 Rock, diatom 0.34 0.210 54.29 14.86 <0.01 Rock, d18O 0.03 0.945 50.02 39.20 <0.01 Rock, d18O 0.09 0.787 57.75 18.32 <0.01 Diatom, d18O 0.98 <0.001 10.82 0.00 0.99 Diatom, d18O 0.86 <0.001 39.42 0.00 0.98 Rock, diatom, d18O 0.98 <0.001 21.38 10.56 <0.01 Rock, diatom, d18O 0.86 <0.001 50.41 10.99 <0.01
1Department of Geology, University of Otago, 360 Leith Walk,
Post Office Box 56, Dunedin, Otago 9016, New Zealand.
2Department of Earth Sciences, University of Bristol, Wills
Memorial Building, Queen’s Road, Bristol BS8 1RJ, UK.3
De-partment of Atmospheric, Oceanic, and Earth Sciences, George Mason University, MS 5F1, Fairfax, VA 22030, USA. *To whom correspondence should be addressed. E-mail: [email protected]
on February 22, 2010
www.sciencemag.org
ering the relatively lower trophic levels (copepods, krill, and small fish) that many mysticetes feed on (11). Because these results depend on our choice of environmental and biological variables used as predictors here, they could substantially change if other or additional variables were used. None-theless, our study offers an entirely biological explanation of cetacean diversity, which, if cor-rect, would seem to imply that the abundance of fossiliferous rock, previously proposed to affect or even overwhelm any biological signal in paleo-diversity data sets (10, 12–14), does not exert a major bias on cetacean paleodiversity.
One peculiar observation is the curious in-crease in explanatory power of rock abundance in combination with diatom diversity and d18O
when the ranged-through data were used. Aside from the possibility of this being a coincidence, such an increase in fit in the face of a crude (fig. S1) but inherently biologically motivated correc-tion of paleodiversity seems counterintuitive. One potential explanation might be found in the way the effects of rock abundance are commonly in-terpreted. Although often treated as a simple bias (10, 12), it has also been proposed that both rock abundance and diversity may be influenced by a common third factor, such as sea-level change (15), thus potentially making rock abundance a covariate, rather than a determinant of observed cetacean diversity. Assuming that enough rock has been preserved per stage to overcome an initial and inevitable small-scale link between rock abundance and the number of fossil cetacean taxa preserved, it might thus be expected that in the presence of presumably genuine drivers of diversity, such as plankton abundance or climate change, rock abun-dance should explain none or hardly any of the diversity patterns observed. However, the amount
of preserved sedimentary rock may be influenced by a complex interplay of factors, such as changes in sea-level or climate, influencing both deposi-tion and erosion, all of which may also have an effect on cetacean diversity to various degrees. As-suming the ranged-through estimate to be a better reflection of actual cetacean paleodiversity than the data as sampled per bin, it might thus be pos-sible that the increase in the explanatory power of rock abundance might reflect the effects of one or more genuine common-cause drivers of both ceta-cean evolution and rock abundance not repre-sented in our models. This view may be supported by the negative coefficient for rock abundance in our ranged-through model (Table 2), which im-plies that an increase in rock abundance is linked with a decrease in neocete diversity—an observa-tion clearly inconsistent with the interpretaobserva-tion of the latter as a simple bias, at least in the case of cetacean paleodiversity.
One prominent hypothesis regarding the evo-lution of neocetes is that the onset of the Antarctic
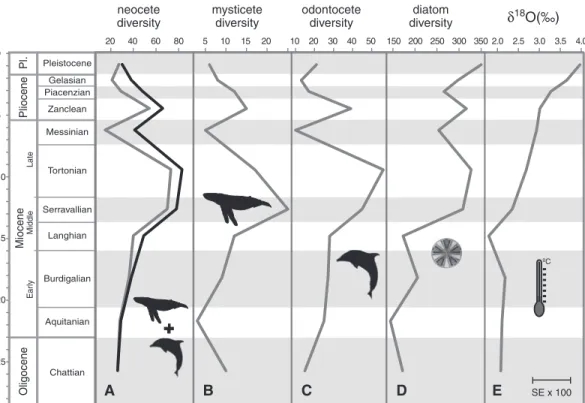
Circumpolar Current (ACC) may have triggered the radiation of modern whales by greatly increas-ing the availability of nutrients in the upper layers of the sea through deep mixing in the Southern Ocean (1, 16–19). Indeed, the effects of the ACC provide the Southern Ocean with one of the highest surface concentrations of silica, the major component of diatom frustules, anywhere in the world (20, 21). Although most of this silica is used up by local diatom growth, the water leaving the area in the form of Subantarctic Mode Water still supplies high concentrations of other nutrients, such as nitrate, to the world’s oceans, supporting as much as 75% of global export production north of 30°S in the process (20). Together with local sources of silica, particularly in the North Pacific (20), the ACC thus seems to offer a credible mechanism supporting the high rates of biological production needed to sustain large apex predators such as cetaceans. Although paleonto-logical evidence suggests that neocetes appeared and possibly started to radiate in the latest Eocene Fig. 1. Comparison of neocete (A),
mysticete (B), and odontocete (C) paleodiversity with diatom paleo-diversity (D) and global d18O
val-ues (E). Cetacean diversity is shown as sampled-in-bin data as down-loaded from the Paleobiology Data-base (gray) and as a ranged-through estimate (black). Error for the d18O
curve is shown as mean standard error (SE) multiplied by 100. The picture of a diatom is after Haeckel (28). Pliocene Miocene Oligocene Pl. Ear ly Late Middle Pleistocene Gelasian Piacenzian Zanclean Messinian Tortonian Serravallian Langhian Burdigalian Aquitanian Chattian 0 5 10 15 20 25 20 40 60 80 5 10 15 20 10 20 30 40 50 150 200 250 300 350 2.0 2.5 3.0 3.5 4.0 SE x 100 ºC
+
neocetediversity mysticetediversity odontocetediversity diversitydiatom δ18O(‰)
A B C D E
Table 2. Estimated best-fit model parameters for the neocete, mysticete, and odontocete data sets. d18O,
oxygen isotope records used as proxy for climate change (8); diatom, diatom species diversity (Neptune database) (7); rock, total number of fossiliferous marine formations as downloaded from the Paleobiology Database (4); st. dur., geologic stage duration; the latter was included as a nonoptional predictor in all models to account for the potentially biasing effects of unequal Cenozoic stage durations.
Neoceti
sampled-in-bin ranged-throughNeoceti sampled-in-binMysticeti sampled-in-binOdontoceti Estimate SE Estimate SE Estimate SE Estimate SE Intercept 6.694 1.465 6.649 1.111 2.214 0.179 5.566 1.179 St. dur. –0.047 0.189 –0.068 0.167 0.096 0.023 0.049 0.166 Diatom 0.029 0.005 0.028 0.003 0.015 <0.001 0.020 0.003 d18O –2.881 0.577 –2.253 0.422 –1.077 0.081 –2.147 0.351 Rock – – –0.013 0.006 – – – –
on February 22, 2010
www.sciencemag.org
Downloaded from
close to the Eocene-Oligocene boundary (22, 23), the time of the actual establishment of the ACC is still a matter of debate (24, 25), and thus no firm conclusion can be drawn. However, our results imply that, if the onset of the ACC indeed trig-gered the evolution and diversification of neo-cetes, it likely must have done so through a great increase in diatom-based productivity, possibly by increasing the bioavailability of silica and other nutrients in the Southern Ocean and coastal up-welling zones around the world through deep-mixing occurring around Antarctica (1).
References and Notes
1. W. H. Berger, Deep Sea Res. Part II Top. Stud. Oceanogr. 54, 2399 (2007).
2. J. H. Ryther, Science 166, 72 (1969).
3. C. Le Quéré et al., Glob. Change Biol. 11, 2016 (2005). 4. Materials and methods are available as supporting
material on Science Online.
5. N. Sugiura, Comm. Statist. Theory Methods 7, 13 (1978). 6. K. P. Burnham, D. R. Anderson, Model Selection and
Multimodel Inference: A Practical Information-Theoretic Approach (Springer, New York, 2001).
7. C. Spencer-Cervato, Palaeontol. Electronica 2, 1 (1999).
8. J. C. Zachos, G. R. Dickens, R. E. Zeebe, Nature 451, 279 (2008).
9. H. Whitehead, B. McGill, B. Worm, Ecol. Lett. 11, 1198 (2008).
10. A. B. Smith, A. J. McGowan, Paleontology 50, 765 (2007). 11. J. L. Bannister, in Encyclopedia of Marine Mammals
2nd ed., W. F. Perrin, B. Würsig, J. G. M. Thewissen, Eds. (Academic Press, Burlington, MA, 2008), pp. 80–89. 12. P. M. Barrett, A. J. McGowan, V. Page, P. R. Soc. B 276,
2667 (2009).
13. S. E. Peters, M. Foote, Paleobiology 27, 583 (2001). 14. J. S. Crampton et al., Science 301, 358 (2003). 15. S. E. Peters, Proc. Natl. Acad. Sci. U.S.A. 102, 12326
(2005).
16. J. H. Lipps, E. D. Mitchell, Paleobiology 2, 147 (1976). 17. R. E. Fordyce, Palaeogeogr. Palaeocl. 21, 265 (1977). 18. R. E. Fordyce, Palaeogeogr. Palaeocl. 31, 319 (1980). 19. R. E. Fordyce, in From Greenhouse to Icehouse: The
Marine Eocene-Oligocene Transition, D. R. Prothero, L. C. Ivany, E. A. Nesbitt, Eds. (Columbia Univ. Press, New York, 2003), 154–170.
20. J. L. Sarmiento, N. Gruber, M. A. Brzezinski, J. P. Dunne, Nature 427, 56 (2004).
21. P. Pondaven, D. Ruiz-Pino, J. N. Druon, C. Fravalo, P. Tréguer, Deep Sea Res. Part I Oceanogr. Res. Pap. 46, 1923 (1999).
22. E. D. Mitchell, Can. J. Fish. Aquat. Sci. 46, 2219 (1989). 23. R. E. Fordyce. J. Vertebr. Paleontol. 23 (Suppl. 3), 50A
(2003).
24. P. F. Barker, E. Thomas, Earth Sci. Rev. 66, 143 (2004). 25. P. F. Barker, G. M. Filippelli, F. Florindo, E. E. Martin,
H. D. Scher, Deep Sea Res. Part II Top. Stud. Oceanogr. 54, 2388 (2007).
26. G. S. Maddala, Limited-Dependent and Qualitative Variables in Econometrics. (Cambridge Univ. Press, 1983). 27. N. J. D. Nagelkerke, Biometrika 78, 691 (1991). 28. E. Haeckel, Kunstformen der Natur (Bibliographisches
Institut, Leipzig, 1899–1904).
29. We thank three referees for their comments, as well as G. Hunt for advice and help with R programming and M. Katz for the provision of data. L. Kavalieris, I. Jolliffe, M. Carrano, D. Thomas, M. Benton, and the participants of the August 2009 Encyclopedia of Life synthesis meeting on marine tetrapod evolution at the Field Museum, Chicago, provided advice and helpful discussions about earlier versions of this work and related topics. F.M. was supported by a University of Otago Postgraduate Scholarship. This is Paleobiology Database publication 108.
Supporting Online Material
www.sciencemag.org/cgi/content/full/327/5968/993/DC1 Materials and Methods
Fig. S1 Tables S1 to S3 References
7 December 2009; accepted 25 January 2010 10.1126/science.1185581
Regulation of Alternative Splicing
by Histone Modifications
Reini F. Luco,1Qun Pan,2Kaoru Tominaga,3Benjamin J. Blencowe,2
Olivia M. Pereira-Smith,3Tom Misteli1*
Alternative splicing of pre-mRNA is a prominent mechanism to generate protein diversity, yet its regulation is poorly understood. We demonstrated a direct role for histone modifications in alternative splicing. We found distinctive histone modification signatures that correlate with the splicing outcome in a set of human genes, and modulation of histone modifications causes splice site switching. Histone marks affect splicing outcome by influencing the recruitment of splicing regulators via a chromatin-binding protein. These results outline an adaptor system for the reading of histone marks by the pre-mRNA splicing machinery.
M
ost human genes are alternatively spliced in a cell type– and tissue-specific manner, and defects in alternative splic-ing (AS) contribute to disease (1–4). Pre-mRNA splicing occurs largely cotranscriptionally, and alternative splice site choice is influenced by RNA polymerase II elongation rate, chromatin remodelers, and histone deacetylase inhibitors (5–14). Genome-wide mapping of histone mod-ifications has revealed nonrandom distributions of nucleosomes and several histone modifica-tions across exons (15–19). Given these observa-tions, we probed the role of histone modifications in AS.The human fibroblast growth factor receptor 2 (FGFR2) gene is an established AS model, in which exons IIIb and IIIc undergo mutually ex-clusive and tissue-specific AS (Fig. 1A) (20, 21). In human prostate normal epithelium cells (PNT2s), exon IIIb is predominantly included, whereas in human mesenchymal stem cells (hMSCs), it is re-pressed and exon IIIc is exclusively used (Fig. 1, A and B). The differential inclusion of these two exons is regulated by the polypyrimidine tract–binding protein (PTB) which binds to silencing elements around exon IIIb, resulting in its repression (20, 22). We comparatively mapped by quantitative chro-matin immunoprecipitation a set of histone mod-ifications across the alternatively spliced region in PNT2 cells and hMSCs (Fig. 1, C to H, and fig. S1, A to F). No differences in the levels of H3-K4me2, H3-K9ac, H3-K27ac, and pan-H4ac histone mod-ifications were detected (Fig. 1H and fig. S1, D to F). In contrast, H3-K36me3 and H3-K4me1 were enriched over the FGFR2 gene in hMSCs, where exon IIIb is repressed, whereas K27me3, H3-K4me3, and H3-K9me1 were reduced as com-pared to PNT2 cells, where the exon is included
(Fig. 1, C to G, and fig. S1, A to C). Histone mark enrichments were not limited to the alternatively spliced exons but extended along the locus with the highest differences around the alternatively spliced region (Fig. 1 and fig. S1).
Several other PTB-dependent alternatively spliced exons (23), including tropomyosin 2 (TPM2) exon 7 and TPM1 exon 3 in hMSCs and pyruvate kinase type M2 (PKM2) exon 9 in PNT2 cells, exhibited similar splicing-specific histone modification patterns (fig. S2), whereas PTB-independent alternative exons or constitutively spliced genes did not (figs. S3 and S4). Chro-matin signatures correlated with the inclusion pattern of the PTB-dependent exon regardless of cell type or steady-state transcription levels of the alternatively spliced genes (Fig. 1 and figs. S2 and S3). These observations reveal a correlation be-tween histone mark signatures and PTB-dependent repression of alternatively spliced exons.
To investigate whether histone modifications have a causal role in alternative splice site selec-tion, we modulated the levels of H3-K36me3, which is the most prominently enriched modifi-cation on FGFR2. Overexpression of the H3-K36 methyltransferase SET2 led to a significant in-crease in H3-K36me3 globally and along FGFR2 in both PNT2 and hMSC cells (Fig. 2A and fig. S5, A and B) and, consistent with a role of H3-K36me3 in alternative splice site selection, re-duced the inclusion of PTB-dependent exons in FGFR2, TPM2, TPM1, and PKM2 mRNA (Fig. 2B and figs. S6, A to D, and S7, A to C). Usage of PTB-independent alternatively spliced exons and constitutive splicing were unaffected (Fig. 2, C and D, and fig. S8, A and B). Overexpression of SET2 also significantly reduced the inclusion of FGFR2 IIIb in HEK 293 cells, where both isoforms are included to a similar extent, demon-strating that H3-K36me3–mediated modulation of
1National Cancer Institute, National Institutes of Health,
Bethesda, MD 20892, USA.2Banting and Best Department
of Medical Research, Terrence Donnelly Centre for Cellular and Biomolecular Research, University of Toronto, Toronto,
Ontario M5S 3E1, Canada.3The Barshop Institute for Longevity
and Aging Studies, Department of Cellular and Structural Biology, University of Texas Health Science Center, San Antonio, TX 78245-3207, USA.
*To whom correspondence should be addressed. E-mail: [email protected]