Learner Models in Online
Personalized Educational
Experiences: an infrastructure
and some experiments
Luca Mazzola
Institute of Communication Technologies - Faculty of Communication Sciences
USI - Universit`
a della Svizzera italiana
A thesis submitted for the degree of
PhilosophiæDoctor (PhD) in Communication Sciences
major in Technologies
PhD defense jury:
1. Supervisor: prof. Marco Colombetti
2. Co-Supervisor: dr. Riccardo Mazza
3. Reviewer: prof. Daniel Burgos
4. Reviewer: prof. Marina Ribaudo
Day of the defense: April 2014
Signature from head of PhD committee: Prof. Marco Colombetti
Technologies are changing the world around us, and education is not immune from its influence: the field of teaching and learning supported by the use of Informa-tion and CommunicaInforma-tion Technologies (ICTs), also known as Technology Enhanced Learning (TEL), has witnessed a huge expansion in recent years. This wide adop-tion happened thanks to the massive diffusion of broadband connecadop-tions and to the pervasive needs for education, highly connected to the evolution in sciences and technologies. Therefore, it has pushed up the usage of online education (distance and blended methodologies for educational experiences) to, even in lately years, unexpected rates.
Alongside with the well known potentialities, digital-based educational tools come with a number of downsides, such as possible disengagement on the part of the learner, absence of the social pressures that normally exist in a classroom environ-ment, difficulty or even inability from the learners to self-regulate and, last but not least, depletion of the stimulus to actively participate and cooperate with lectures and peers. These difficulties impact the teaching process and the outcomes of the educational experience (i.e. learning process), being a serious limit and questioning the broader applicability of TEL solutions. To overcome these issues, there is a need of tools to support the learning process.
In the literature, one of the known approach to improve the situation is to rely on a user profile, that collects data during the use of the eLearning platforms or tool. The created profile can be used to adapt the behaviour and the contents proposed to the learner. On top of this model, some researches stressed the positive effects stimulated by the disclosure of the model itself for inspection purposes by the learner. This disclosed model is known as Open Learner Model (OLM). The idea of opening learners’ profile and eventually integrate them with external on-line resources is not new and it has the ultimate goal of creating global and long-run
indicators of the learner’s profile. Also the representation aspect of the learner model plays a role, moving from the more traditional approach based on the textual and analytic/extensive representation to the graphical indicators that are able to summarise and to present one or more of the model characteristics in a way that is considered more effective and natural for the user consumption.
Relying on the same learner models, and stressing the different aggregation and rep-resentation capabilities, it is possible to either support self-reflection of the learner or to foster the tutoring process to allow proper supervision by the tutor/teacher. Both the objectives can be reached through the graphical representation of the rel-evant information, presented in different ways. Furthermore, with such an open approach for the learner model, the concepts of personalisation and adaptation ac-quire a central role in the TEL experience, overcoming the previous limits related to the impossibility to observe and explain to the learner the reasons for such an intervention from the tool itself. As a consequence, the introduction of different tools, platforms, widgets and devices in the learning process, together with the adaptation process based on the learner profiles, can create a personal space for a potential fruitful usage of the rich and widespread amount of resources available to the learner.
This work aimed at analysing the way a learner model could be represented in visual presentation to the system users, exploring the effects and performances for learners and teachers. Subsequently, it concentrated in investigating how the adoption of adaptive and social visualisations of OLM could affect the student experience within a TEL context. The motivation was twofold. On one side was to show that the approach of mixing data from heterogeneous and not already related data sources could have a meaningful didactic interpretations, whether on the other one was to measure the perceived impact of the introduction on online experiences of the adaptivity (and of social aspects) in the graphical visualisations produced by such a tool.
In order to achieve these objectives, the present work analysed and addressed them through an approach that merged user data in learning platforms, implementing a learner profile. This was accomplished by means of the creation of a tool, named
tool as the provider to extract, to aggregate and to represent the data for the learn-ers’ model. The GVIS tool impact was then estimated with self-evaluation question-naires, with the analysis of log files and with knowledge quiz results. Dimensions such as the perceived usefulness, the impact on motivation and commitment, the cognitive overload generated, and the impact of social data disclosure were taken into account.
The main result found by the application of the developed tool in TEL experiences was to have an impact on the behaviour of online learners when used to provide them with indicators around their activities, especially when enhanced with social capabilities. The effects appear to be amplifies in those cases where the widget usage is as simplified as possible. From the learner side, the results suggested that the learners seem to appreciate the tool and recognise its value. For them the introduction as part of the online learning experience could act as a positive pressure factor, enhanced by the peer comparison functionality. This functionality could also be used to reinforce the student engagement and positive commitment to the educational experience, by transmitting a sense of community and stimulating healthy competition between learners.
From the teacher/tutor side, they seemed to be better supported by the presen-tation of compact, intuitive and just-in-time information (i.e. actions that have an educational interpretation or impact) about the monitored user or group. This gave them a clearer picture of how the class is currently performing and enabled them to address performance issues by adapting the resources and the teaching (and learning) approach accordingly.
Although a drawback was identified regarding the cognitive overload, the data col-lected showed that users generally considered this kind of support useful. There is also indications that further analyses can be interesting to explore the effects introduced in the teaching practices by the availability and usage of such a tool.
Declaration
Most of the work contained in this thesis is a slightly modification of papers pub-lished in conferences proceedings.
As it is usual in academic community, they are the result of cooperations with different research groups. In this work the two main groups other than my colleague Riccardo Mazza – with whom I worked closer in a day-by-day manner – are the partners in the EU FP7 funded project GRAPPLE directed by prof. Paul De Bra at Tu/E – Technical University of Eindhoven – Netherlands, and the team of prof. Peter Brusilovsky at University of Pittsburgh – Pennsylvania – USA.
The parts included in the present thesis represents mainly original or revised con-tributions of the author as elaborated for the following published papers.
The publications produced in the context of this study are fully listed here:
• Falakmasir M., Hsiao I., Mazzola L., Grant N., Brusilovsky P. (2012). The Impact of Social Performance Visualization on Students. Proceedings of the 12th IEEE International Conference on Advanced Learning Technologies and Technology-enhanced Learning, pp. 565- 569, Rome, Italy, July 4-6, 2012. • Mazzola L., Mazza R. (2011). Visualizing Learner Models through data
ag-gregation: a test case. Red-conference, rethinking education in the knowledge society, Monte Verita, Switzerland, March 7-10, pp. 372- 380, ISBN 978-88-6101-010-9.
• Mazzola L., Mazza R. (2010). An infrastructure for creating graphical indica-tors of the learner profile by mashing up different sources. In Proceedings of the International Conference on Advanced Visual Interfaces (AVI ’10), Giuseppe Santucci (Ed.). ACM, New York, NY, USA, 329-332.
Learning and Practice” Lecture Notes in Computer Science, Volume 6383/2010, pp. 554-559, Proceedings of EC-TEL 2010, DOI: 10.1007/978-3-642-16020-2 53.
• Mazzola L., Eynard D., Mazza R. (2010). GVIS: a framework for graphical mashups of heterogeneous sources to support data interpretation. 3rd Con-ference on Human System Interactions, 2010. HSI ’10. GVIS: A framework for graphical mashups of heterogeneous sources to support data interpretation. 3rd Conference on Human System Interactions (HSI) 2010, pp.578-584, 13-15 May 2010 DOI: 10.1109/HSI.2010.5514511
URL: http://ieeexplore.ieee.org/stamp/stamp.jsp?arnumber=5514511
• Mazzola L., Mazza R. (2010). GVIS: An Integrating Infrastructure for Adap-tively Mashing up User Data from Different Sources. Information Visualiza-tion (IV), 2010, 14th InternaVisualiza-tional Conference, pp.68-72, 26-29 July 2010 DOI: 10.1109/IV.2010.19
URL: http://ieeexplore.ieee.org/stamp/stamp.jsp?arnumber=5571358
• GRAPPLE Deliverable 4.5b : Implementation of interactive visualization of models and students data.
Public deliverable, available online at http://grapple.project.org
• GRAPPLE Deliverable 4.5c : Evaluation and refinement of interactive visual-isation of models and students data.
Public deliverable, available online at http://grapple.project.org
• Mazzola L., Mazza R. (2009). Supporting Learners in Adaptive Learning Envi-ronments through the Enhancement of the Student Model. Human-Computer Interaction. Interacting in Various Application Domains, 13th International Conference, HCI International 2009, San Diego, CA, USA, July 19-24, 2009, Proceedings, Part IV. Lecture Notes in Computer Science 5613 Springer 2009, ISBN 978-3-642-02582-2: pp. 166-175.
• Mazzola L., Mazza R. (2009). Toward Adaptive Presentations of Student Mod-els in eLearning Environments.. 14th International Conference on Artificial In-telligence in Education, AIED 2009, July 6-10, 2009, Brighton, UK. Frontiers
in Artificial Intelligence and Applications 200 IOS Press 2009, pp. 761-762, ISBN 978-1-60750-028-5.
• Mazzola L. (2009). Towards Adaptive representations of Open Learner Models. Doctoral Consortium of UMAP2009.
URL: http://umap09.fbk.eu/sites/umap09.fbk.eu/files/paper 168.pdf
• Mazza, R., Bettoni, M., Fare, M., Mazzola, L. (2012). MOCLog: Monitoring Online Courses with log data. In: Retalis, S., and Dougiamas, M. (Eds.). 1st Moodle Research Conference Proceedings, Heraklion, Greece, Sept. 14-15, 2012. ISBN: 978-960-98516-2-6
The work in the GRAPPLE project was partially supported by EU FP7 funds under the grant #215434: the author would like to thank all the project partners for the fruitful and interesting cooperation.
The work done with Pittsburgh University was partially supported by the Intelligent System Program of the School of Arts & Sciences at University of Pittsburgh. This work was also partially supported by USA National Science Foundation grant DUE-0840597.
I would like to thanks prof. Lorenzo Cantoni for letting us use the Moodle course example as one of the testbed. A special mention goes to Luca Marchesi for having provided me with so valuable ideas and for the help in the implementation of the infrastructure.
Dedication For accomplish this job, I have to thanks a lot of people:
• First of all, my parents Egidio and Maria Rosa that supported me in every choice I did, even thou sometimes they did not agree with me. A big thanks goes also to my sister Lara that was every time I needed available and happy to pay attention to my problems and ready to give a helpful suggestion. • From the academic and personal point of view, I want really to thanks my
supervisor, prof. Marco Colombetti and my co-supervisor Dr. Riccardo Mazza, for providing me with so valuable indications and helping me to look over after the momentaneous failure, once received a bad review or in front of an obstacle.
• Without the love and support of my wife-to-be Liselotti, I would have for sure not consider to finish my PhD, for these reason (and uncountable others) I would to express my love and gratitude to her.
• For our friendly discussions and for all the support showed, I want to deeply thanks the colleagues at ITC - Institute of Communication Technolo-gies, dr. Nicoletta Fornara and dr. Davide Eynard, with whom I also have had the pleasure to write some scientific work and who taught me to apply a scientific methodology.
• To my friend Federico for all the experiences that our long-run friendship gave us, for being always enthusiastic at innovative proposals and ready to provide alternative and intriguing ideas, for being the one that opened my mind about opportunity outside Italy and, last but not least, for being the one who reviewed the full thesis and corrected my English mistakes.
• For the other PhD students in the Red-Ink doctoral school at USI (Emanuele, Silvia, Andreas and Chrysa), for the useful - and sometimes strong - dis-cussions we had: they are one of the seeds for the current work. A big thanks also for the reciprocal support we expressed in front of all the - also personal - issues that a PhD force you to face.
• To the staff at Universit´a della Svizzera italiana, prof. Lorenzo Cantoni, dr. Luca Botturi and dr. Isabella Rega and all the staff from University of Sankt Gallen and EPFL - Ecole Politecnique Federale de Lausanne involved in the Red-Ink school, for the support and indications provided in the development of the PhD research.
• A big thanks to all my friends that supported me and was open to share their thought with me, especially when I needed more their support.
• For the beautiful experience of teaching and the very exciting and useful ex-perience in research, my gratitude goes to my colleagues at Politecnico di Milano, prof. Francesco Pinciroli, dr. Stefano Bonacina, dr. Sara Marceglia and dr. Simona Ferrante.
• To all my colleagues at eLab, NewMine, and WebAtelier at USI, that shared the physical place in the offices and some projects in this long-run experience that was my PhD; for all the objectives reached together - even if sometimes with difficult and different point of view - thanks to all of you.
some of which is my fault not having realized.
This list is not exhaustive; in fact this work was possible thanks to a lot of people that I met along the last four years, and that I want to publicly thanks for all the comments they provided to me. For sure, I let out someone who I deserve gratitude and for this I want to ask sorry in advance.
Contents
List of Figures ix
List of Tables xi
1 Introduction & Aims of the work 1
1.1 Introduction . . . 1
1.2 Context of the work . . . 7
1.2.1 Ideas . . . 7
1.2.2 Aims . . . 8
1.2.3 Research Questions and Methodology . . . 10
2 Background / State of the Art 13 2.1 Information Visualization (IV) . . . 13
2.2 Technology Enhanced Learning (TEL) . . . 17
2.3 Open Learner Model (OLM) . . . 20
2.4 Educational Data Mining (EDM) and Learning Analytics (LA) . . . 22
2.5 Possible impacts of learner model externalization . . . 26
2.5.1 Adaptivity . . . 27
2.5.2 Social aspects . . . 28
2.5.3 Big, Heterogeneous and Distribute data sources . . . 28
2.6 GRAPPLE: context of the work . . . 30
3 GVIS: the tool 35 3.1 The Infrastructure . . . 35
3.1.1 Concepts . . . 35
3.1.2 Requirements and Design . . . 36
3.1.4 The Extractor . . . 41
3.1.4.1 The Adapter . . . 44
3.1.5 The Aggregator . . . 44
3.1.5.1 Didactic models . . . 45
3.1.6 The Builder module . . . 46
3.1.6.1 The Dashboard and the Widget generator . . . 47
3.1.7 Adaptivity . . . 49
3.2 Development . . . 53
4 GVIS: evaluation in GRAPPLE 69 4.1 GVIS in the context of GRAPPLE . . . 69
4.1.1 GRAPPLE User requirements . . . 69
4.1.1.1 Information descriptors . . . 71
4.1.1.1.1 Descriptors for compact indicators . . . 72
4.1.1.1.2 Descriptors for Dashboards views . . . 72
4.1.1.2 Data input . . . 72
4.1.1.2.1 Expected input data . . . 76
4.1.2 Evaluation on mock-ups . . . 76 4.1.2.1 Knowledge . . . 79 4.1.2.1.1 Views . . . 79 4.1.2.2 Activities . . . 84 4.1.2.2.1 Learner Views . . . 84 4.1.2.2.2 Instructor/Tutor Views . . . 85 4.1.2.3 Goals . . . 86 4.1.2.3.1 Instructor/Tutor Views . . . 88 4.1.2.3.2 Learner Views . . . 88
4.2 Evaluation of the Visualisation Mock-Ups . . . 88
4.2.1 Introduction . . . 88 4.2.2 Method . . . 90 4.2.2.1 Participants . . . 90 4.2.2.2 Material . . . 91 4.2.2.2.1 Visualisations . . . 91 4.2.2.3 Procedure . . . 93 4.2.3 Results . . . 94
CONTENTS
4.2.3.1 Results for student visualisations . . . 94
4.2.3.2 Results for Instructor Visualisations . . . 99
4.2.4 Discussion on the evaluation of mock-ups . . . 102
5 GVIS: experiments outside GRAPPLE 107 5.1 GVIS connected to LMS/ITS . . . 107
5.1.1 An Experiment with the Moodle LMS . . . 107
5.1.1.1 The ”grade” widget . . . 110
5.1.1.2 Evaluation . . . 111
5.1.2 An Experiment with Adapt2 . . . 113
5.1.2.1 The problem of engaging the students . . . 114
5.1.2.2 The Proposed Solution . . . 114
5.1.2.3 The Approach . . . 115
5.1.2.4 Result: Basic Statistics . . . 116
5.1.2.5 Result: Deeper Analysis . . . 118
5.1.2.6 Evaluation . . . 120
5.2 Other application of GVIS outside LMS/ITS . . . 123
5.2.1 Ideas for another test case . . . 123
5.2.2 The approach . . . 124 5.2.3 System Infrastructure . . . 125 5.2.3.1 Data Aggregation . . . 126 5.2.3.2 Visualization . . . 127 5.2.4 Some examples . . . 128 5.2.4.1 Websites . . . 128 5.2.4.2 Browsing history . . . 130
5.2.4.3 The ”reverse profile” of a domain name . . . 132
5.2.5 System Evaluation . . . 132
5.2.5.1 System Performances . . . 133
5.2.5.2 Visualisations . . . 134
6 Conclusion 139 6.1 Discussion . . . 139 6.2 Recap . . . 144 6.3 Future Possible Enhancements . . . 146
A XML Schema 149
B JSON messages 161
List of Figures
2.1 The GRAPPLE General Architecture . . . 30
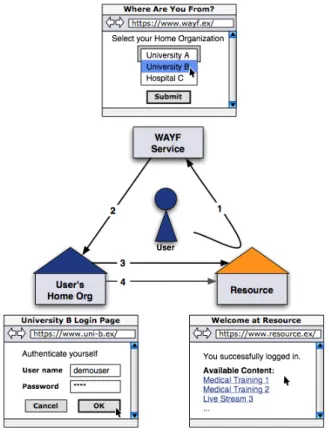
2.2 How Shibboleth works. Images from http://www.switch.ch . . . 31
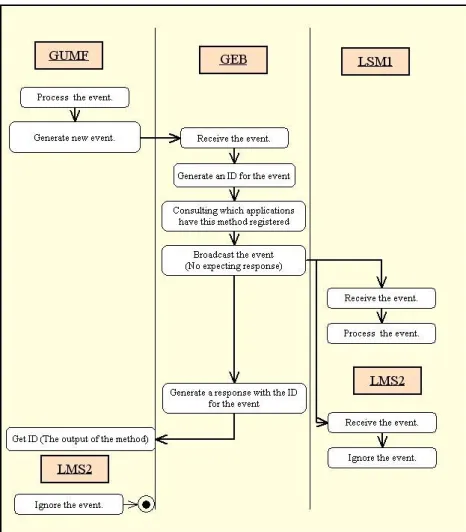
2.3 The mechanism of notification adopted in GRAPPLE. GUMF generates a new event either based on information received directly or by deriving new knowledge through a reasoning rule; GEB receives an event and broadcasts it to all the subscribed component, which can decide to ignore it (such as LMS2 in this case) or process it (LMS1). Hidden in the image are also the Grapple Listener and Broker. . . 33
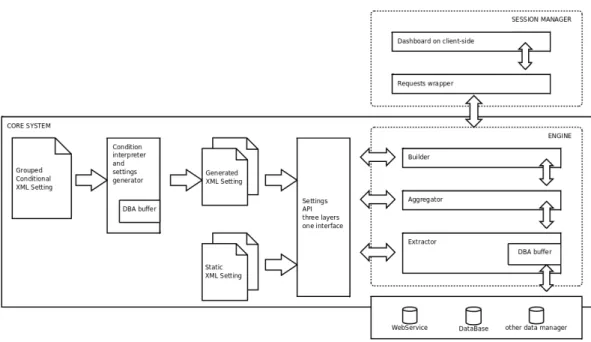
3.1 The GVIS architecture with the three levels highlighted inside the Engine block: Extractor, Aggregator and Builder. . . 36
3.2 The GVIS requirements for the general user. . . 38
3.3 The GVIS requirements for the server-related part. . . 38
3.4 The GVIS requirements for the browser-related part. . . 39
3.5 Data flow in the widget generation. . . 40
3.6 Actions involved in the Extraction execution step. . . 42
3.7 Actions involved in the Aggregation execution step. . . 45
3.8 Actions involved in the Building execution step. . . 48
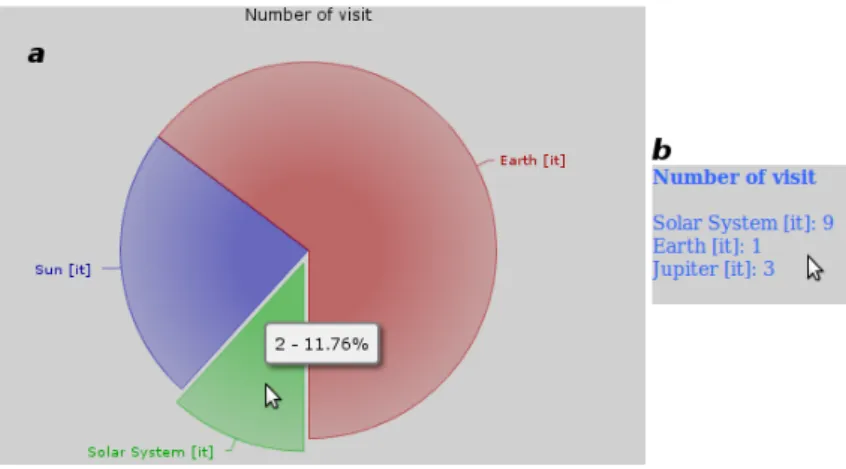
3.9 Example of the produced widgets: different aggregation level of the same data. . 51
3.10 Example of the produced widgets: different graphical representation of the same base data, aggregated in different ways. . . 51
3.11 Example of the produced widgets: graphical versus textual representation. . . 52
3.12 Examples of the produced widgets: differential versus absolute representation. . . 52
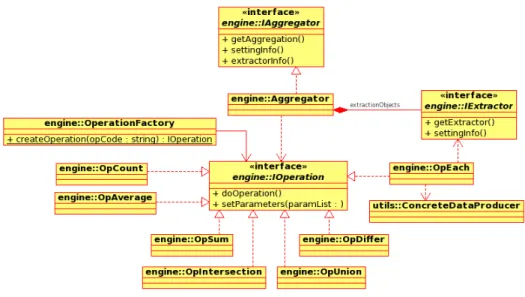
3.13 The class diagram for the Engine package (with some classes from other packages that have strong dependencies here). . . 53
3.14 The class diagram for the Engine::Builder package. . . 54
3.15 The class diagram for the Engine::Aggregator package. . . 57
3.16 The class diagram for the utils package. . . 58
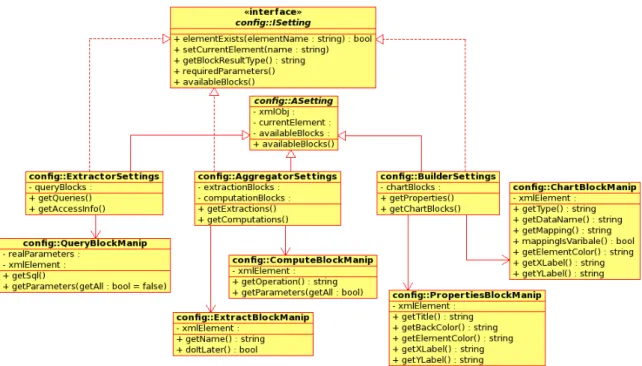
3.17 The class diagram for the config package. . . 61
3.18 The sequence diagram for the widget creation (as seen internally: Dashboard). . 65
3.19 The sequence diagram for the complete widget creation (as seen externally: user). 66 3.20 The dashboard as seen in the original conception of the GVIS infrastructure. . . 67
3.21 Another view of the original conception of the GVIS infrastructure. . . 67
4.1 The overall knowledge level in textual view. . . 80
4.2 The overall knowledge level in graphical view (learners’ version). . . 80
4.3 Knowledge level for a learner and class, as well expected knowledge level, in expanded form. . . 82
4.4 Knowledge level for a learner and class (with expected knowledge level) with history: the situation at a previous point in time and, at the bottom, at the present one. . . 82
4.5 Knowledge level representation as matrix (learners - concepts). . . 83
4.6 Another knowledge level representation as matrix (learners - concepts): here some average data is also reported for reference purposes. . . 83
4.7 Number of activities visited by a learner in textual form. . . 84
4.8 Number of activities visited by a learner in graphic form. The green bar repre-sents the student data and the yellow bar reprerepre-sents the class data. . . 84
4.9 Analytic view of the resource viewed by a learner. . . 85
4.10 Alternative analytic view of the resource viewed by a learner. . . 86
4.11 Details of resources visited by students. . . 87
4.12 Goals achieved by learners. . . 87
4.13 Goals achieved by the current learner. On the left: the representation of the compact indicator. On the center and on the right: two possible representations of the detailed views for the dashboard. . . 89
5.1 The output of the GVIS module when plugged into a Moodle course (the bottom block on the right-hand side column). . . 108
LIST OF FIGURES
5.3 The GVIS module for instructor. A classification of the posts based on the submission date - Early, OnTime, Late and Uncompleted - is presented (on the left), accompanied by the related evaluation (on the right). . . 109 5.4 The graph of the grades for two different students from two distinct classes. . . . 110 5.5 Initial mockup of the Student View for the implementation of KnowVis interface.
The feedback received induced us to simplify and reduce the amount of informa-tion shown on the page and provide, instead, some navigainforma-tional capabilities on the data. . . 114 5.6 Student View of KnowVis. . . 117 5.7 TreeMap Visualization of Attempts. . . 119 5.8 Weekly Distribution of Activities (Top with Visualization and Bottom without
Visualization). . . 121 5.9 The operation pipelines applied to the actual examples: C1 is the part which is
common to all the applications developed for this test case. . . 125 5.10 The operation pipelines applied to the first examples: C2 represents the logical
operations to produce the browser history navigation chart (the starting point is the browsing history provided by the user; here the USER in input represents his identification). . . 126 5.11 An analysis on a website: the case of http://corsi.elearninglab.org (the eLearning
platform of the university of Lugano). . . 127 5.12 An analysis on a website: the case of http://www.ieee.org (the IEEE organisation
institutional website): the issue of the overabundance of data to represent is clearly evident. . . 128 5.13 The ENTER2010 conference website (http://www.enter2010.org) analysed in
three different moments: (from left to right) an early one, just after the con-ference announcement, after a month and two months from creation. . . 129 5.14 The browsing history for one user: a person with interest in economy and trekking
(later recognized to be associated with an adult investing and that likes mountains).130 5.15 The browsing history of another user: an individual mainly watching movies
on streaming (probably a young person, as it was later confirmed through user self-disclosure). . . 131 5.16 The operations pipeline applied to the actual examples: C3 encodes logical
5.17 The www.italia.org website (http://www.italia.org) analysed in respect of the most frequent labels associated in the del.icio.us service by the users: the synon-ims, languages translations or variations present in the tags set are evident . . . 136 6.1 The xAPI (former TinCanAPI) working schema: all the Activity streams flows
to the Learning Record Store (LRS) that then can be used to feed any reporting system. . . 142
List of Tables
2.1 Possible application of EDM and LA, distinguished by the objectives, the optimal
time-frame and the role interested in . . . 24
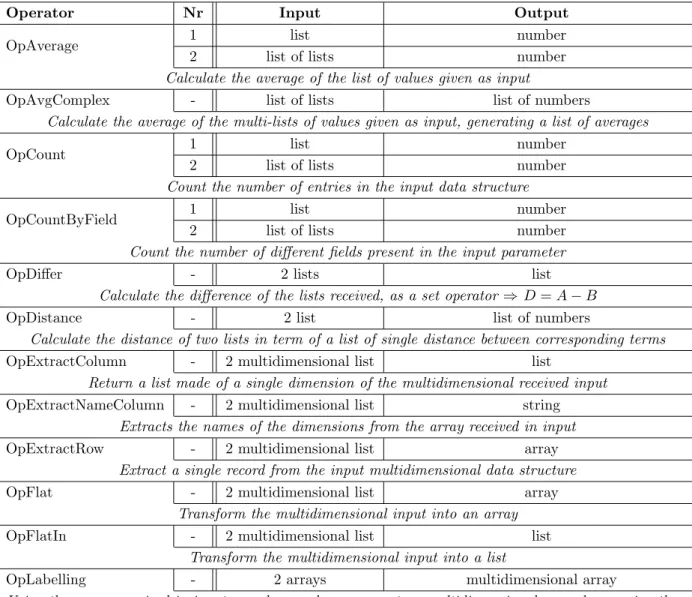
3.1 The list of operators implemented in GVIS at the Aggregation level: part A. . . 55
3.2 The list of operators implemented in GVIS at the Aggregation level: part B. . . 56
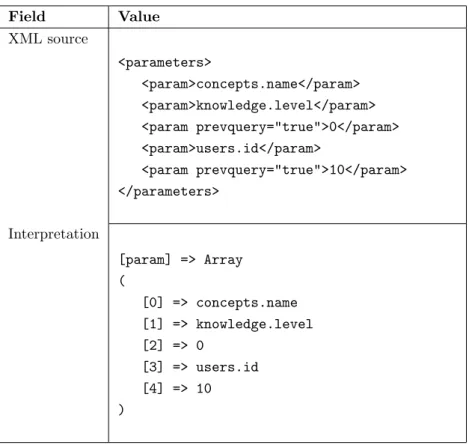
3.3 Positional interpretation of the XML parameters encoding. . . 60
4.1 Descriptors for GRAPPLE compact indicators . . . 73
4.2 Descriptors for GRAPPLE dashboard’s views - part 1 . . . 74
4.3 Descriptors for GRAPPLE dashboard’s views - part 2 . . . 75
4.4 Data providers for GVIS . . . 76
4.5 List of source data for GVIS - part 1 . . . 77
4.6 List of source data for GVIS - part 2 . . . 78
4.7 Sample of the participants at the visualisation evaluation . . . 90
4.8 Variants of the student visualisations. . . 91
4.9 Results of the evaluation for the VisST1 widget. . . 95
4.10 Qualitative feedback concerning VisST1. . . 96
4.11 Results of the evaluation for the VisST2 widget. . . 97
4.12 Qualitative feedback concerning VisST2. . . 98
4.13 Results of the evaluation for the VisST3 widget. . . 99
4.14 Qualitative feedback concerning VisST3. . . 100
4.15 Comparison of the results of the evaluation amongst the widgets VisST1, VisST2, and VisST3. . . 101
4.16 Results of the evaluation for the VisI1 widget. . . 101
4.18 Results of the evaluation for the VisI2 widget. . . 103 4.19 Qualitative feedback concerning VisI2. . . 103 5.1 The results of the survey about the OLM visualisation implemented in
GRAP-PLE: statistical analysis. . . 112 5.2 Overall statistics of application usage - part I . . . 118 5.3 Daily usage record (whole semester) . . . 120 5.4 Daily usage record (before midterm) . . . 120 5.5 Overall statistics of application usage - Part II . . . 122 5.6 Performance Evaluation of the Tag-retrieval component. . . 134
Chapter 1
Introduction & Aims of the work
This chapter offers an introduction to the field in which the present thesis is concerned with. After a general overview of the impact that the adoption of Information and Communication Technologies (ICT) has on the educational field, the context of the work is explored. As well as presenting the main ideas and the aims of the thesis, the research topics that represented the basis for the development of the experiments are also described.
1.1
Introduction
Technologies are changing the world around us, and education is not immune from its influence. The diffusion of digital instruments and tools in classrooms, as well as in every kind of teaching and learning experience for that matter, is quite evident to practitioners. Most teachers and students use PCs, tablets and smartphones on a daily basis to search for news or educational contents and more in general use the capabilities of ICT to manage information and produce documents. Because of the above it is no longer possible to consider an educational experience as such without taking into account the digital context in which it is taking place. This is certainly true even when the teacher is promoting a very traditional, paper-and pencil driven approach, as it has been observed that learners still rely and use everyday digital tools to support and enhance their learning.
Another crucial aspect that has to be considered is the wide adoption of distance and blended methodologies for educational experiences, which are enabled and supported by the diffusion of digital tools and media. Unfortunately, besides these positive aspects, the broader diffusion of digital-based educational tools comes with a number of downsides, such as possible disengagement on the part of the learner, absence of the social pressures that normally exist in
a classroom environment, difficulty or even inability from the learners to self-regulate and last but not least depletion of the stimulus to actively participate and cooperate with lecturers and peers, i.e. to engage in 1-to-1’s and teamwork activities.
For all of the above, the requirement for such tools to be able to effectively support the learning process is a well known, outstanding issue in the field of Technology Enhanced Learning (TEL). The latter is aggravated by the limitations existing on communication channels that are related to the mediation by technologies and the contextual removal of physical co-presence (Kehrwald 2012). Two different ways of improving this situation can be explored which are based on the pedagogical model - to either proactively support reflection in a more self-regulated learning context, or to foster the tutoring processes in a way that allows for the learners’ activities to be properly supervised. Both could be effectively enabled through the creation of graphical representation of relevant information, i.e. data collected around the teaching and learning process - number of interactions, quiz results, access to resources etc. The aggregated information can then be presented to the users in different fashions based on their profile and role.
The user profiles are normally created using the data collected during the use of the eLearn-ing platform - the methodologies to gather information regardeLearn-ing the users and their interaction with the software have in fact reached a significant level of maturity and reliability in the field of computer science (Fischer 2001). These procedures were originally designed to support de-velopers in discovering bugs or to analyse the user interaction with the system in order to improve the overall quality of the application. Procedures range from collecting explicit user information to gathering user behaviors which is then stored in log files. The latter has become less common due the diffusion of the personal computers, which make it harder to collect and distribute user data from personal devices.
Nowadays though, thanks the massive diffusion of broadband Internet connections and thus the ability to develop programs as web application, collecting user data in the form of interac-tion logs is back in fashion and is in fact considered as a very valid approach for profiling users. Because of the above, taking advantage of those Web Server functionalities that collect users’ navigation footprints (Hoppe, Ogata, and Soller 2007) or including explicit mechanisms that collect user interactions – even at a higher level of aggregation – is finding new interest, par-ticularly in field of Education Data Mining whose purpose is to parse data-intensive fields and identify the patterns and rules which are implicitly contained in the data itself. The ultimate
1.1 Introduction
aim of such an operation is to generate forecasts or extrapolate and identify recurring patterns (Ferguson 2012) and (Bienkowski, Feng and Means 2012).
The above is particularly important in relation to the fact that most part of Learning Management Systems (LMS) are web-based (Mazza, Botturi, and Tardini 2006). In fact, in this context tracking user behavior in the form of data log from Web applications is crucial to provide support to both learners and teachers, and can with reason be considered one of the most important data sources to feed monitoring tools with (Mazzola and Mazza 2009a).
A monitoring tool is the system component designated to provide relevant information on a particular activity. An example is the set of led lamps on a computer case - it is designed to give the user an indication of the state of specific hardware components (e.g. hard disk activity, network activity, etc). Logs, on the other end, are normally used to track users’ activities. Log-based applications work through a process of specific events aggregation which allows to recognise a complex human activity - or task - within one or more predefined ordered sequences of elementary activities. Each single entry in a web log refers to an individual event. It doesn’t contain a great deal of information in itself, but when linked to others logs it makes for a very powerful way to identify the user context. Example of this can be found in (Courtin and Talbot 2006) and (Mazza, Bettoni, Fare, and Mazzola 2012).
Through the aggregation of information into a single log, based on a model developed by experts, a user model is created. These models are normally stored internally within the application without the possibility for the user to scrutinise their personal information. The existing literature suggest that opening profiles to user inspection, with the so called “Open Learner Model” approach (OLM), means the possibility of being able to provide information to the learner about his personal status as derived by the single application, as well as how his/her actions and interactions are interpreted by the system itself (Dimitrova 2008), (Tanimoto, 2005), and (Bull and Nghiem, 2002). Other critical issues could also be address by opening personal profiles. For example, it would be easier to identify problems or assess a lacks of precision in the profile itself, simply by allowing user inspection (Bull and Kay 2007) and (Shahror and Bull 2008).
The idea of opening learners’ profile and eventually integrate them with external on-line resources is not new and has the ultimate goal of creating global and long-run indicators on the lerners’ profiles. There are different possible approaches to make the profile scrutable by learners, in fact in the literature are well known the approaches based on textual presentation but many researchers moved towards graphical indicators, considering it as more effective and
natural for the learner and the actual devices where the courses are offered. The generated objects, called smart widgets by some researchers (Glahn, Specht, and Koper 2008) – are simple graphical objects that aims at exposing valuable information to the user. This will take into account internal and external user data in order to have a more complete and comprehensive view of the user’s behaviors in the eLearning tools used.
On top of the above it has to be considered that another element plays a major role in this scenario: the paradigm of Web 2.0. This has in fact changed not only the way we explore and search in the Internet sea, but also how users expect to interact with online resources. Posting comments about news in a blog, refining an article in a collaborative wiki, or aggregating information from heterogeneous sources are features that also affect the eLearning field.
The sum of all these types of activities widely changed the concept of the Computer Mediated Education, forming the basic bricks for, and enabling a wider definition of Technology Enhanced Learning (TEL) as the evolving virtual place for formal, semi-formal, and informal learning. The shift in the model enforced by these interactive tools impacted heavily on the organizational aspect as well.
Despite some initial attempts to accurately reproduce the face-to-face experience in an online environment, a new approach has recently emerged. This relies more on the peculiar characteristics of the electronic medium than the traditional non-digital tools and pushes the capabilities that the technologies can offer. This shift allowed to reach the objective of providing a better educational experience (in the sense of better informed, more available and flexible) while giving the possibility to target and tailor the interactions and educational experience to the learner needs.
As a consequence, the introduction of different tools, platforms, widgets and devices in the learning process creates a personal space for a potential fruitful usage of the rich and widespread amount of resources available to the learner (Klebl, Kramer, Zobel, Hupfer, and Lukaschik 2010), (Ebner, Holzinger, Scerbakov, and Tsang 2011), and (Conole 2012). In fact, the availability of many contents and activities not specifically designed to be part of a single pre-structured and inflexible didactic flow enriches the learning experience, offers teachers the possibility to prepare additional and alternative paths and also opens up to the introduction of some Informal Learning activities, thus demonstrating its potential full impact.
Furthermore, with such an open approach, the concepts of personalisation and adaptation acquire a central role. On the personalisation side, the possibility to choose amongst different options such as the type of media used (text, audio or video) or the approach adopted in the
1.1 Introduction
subject presentation (inductive or deductive) allows learners to enjoy an experience which is better-suited to their stated preferences. On the adaptation side, the students are – either fully or semi-automatically – provided with the content that is more appropriate to their profile. The integration between dynamically added sources, heterogeneous tools, devices to support differ-ent situations, combined with the two processes of personalisation and adaptation, evdiffer-entually can create an ideal working space for adaptive learning systems.
Researches in this context have demonstrated that it is useful to consider the richness of the experiences adopting a holistic approach (McCalla 2004), as it it usually the case with complex system e.g. a natural ecosystem in ecological analysis. On the adaptive features’ side one of the most important components is the student model, which is also in charge of keeping track of the learner’s knowledge and skills acquired during the learning process. As already discovered (Bull and Kay 2008), in order to increase the level of engagement of learners, to support their consciousness of the current status and to encourage reflection as learning (Bull 1997), the student model could be opened to the inspection of learners and instructors. Student models are usually made available as visual representations, because it simplifies the data interpretation by human beings (Scaife and Rogers 1996) and (Ferreira de Oliveira and Levkowitz 2003). Since the user information is not only stored into a specific student model system but also in this new complex ecosystem, it is often distributed in a number of platforms used for different purposes (e.g. LMS data, intranet usage data, resources access and so on) and therefore data must be aggregated from different tools and provided consistently to the interested users, preferably in visual formats (Dror, Nadine, and Mike 2008).
In the literature, other approaches to the problem of creating Open Student Models in TEL are “educational mashup” (Esposito, Licchelli, and Semeraro 2004) and “ubiquitous and decen-tralized user model” (Van Der Sluijs and Houben 2006) and (Heckmann, Schwartz, Brandherm, and Krner 2005).
Some issues however arise from the adoption of these approaches. In fact, from the user point of view we have to consider that a high quantity of mashed-up data might cause an overload problem (Chen 2009) which may become problematic if it ends up distracting from the learning activity and confuses the learner about the represented data (Ahmad, Basir, and Hassanein 2004) and (Costabile, De Marsico, Lanzilotti, Plantamura, and Roselli 2005).
A possible mitigation of this issue could be implemented using a minimal impact policy i.e. presenting a compact, general and summarising indicator in the eLearning tool interface that works as the access point to a specialised dashboard. The dashboard collects a set of
visualizations provided to the users for an autonomous exploration on and in-depth analysis. This approach also allows to stress the message that learners can use this additional tool for better understanding the personal situation, but that this information is only for self-assistance and does not represent the subject or the main objective of the educational experience.
On the other side, in order to mitigate the overload issue, the visual representations can be made adaptive to the role, to the context and to the activities performed by the learner. With this kind of approach, the adaptation helps creating easier and more understandable indicators. For example the adaptive dashboards, widely spread in the field of Business Intelligence, (Schutz 2009) are used to represent the most useful and relevant subset of the all information available for an ongoing task, without restricting the users for enjoying a more in-depth view on specific data, based on their personal interest or other criteria.
The next section will describe the context of the work, including the aims of the research and the research questions. Methodology adopted will also be explained.
1.2 Context of the work
1.2
Context of the work
The present section explores the scope of the work and is divided in two parts. The first presents the basics ideas and underlying concepts while the second focuses on the research questions as well as the methodologies used to investigate them. The starting point of this research are some of the requirements identified in an EU FP7 funded project called GRAPPLE, which will be explained more in detail later on1.
In this context, the collection of interaction data from learners about activities, prefer-ences and characteristics is a central as well as mandatory task for providing students with a personalised experience based on adapted contents. The possibility to disclose these data for supporting users is well known in the literature (Dimitrova, Self, and Brna 2001), (Bull and Nghiem 2002), and (Bull and Kay 2007) and seems to have effects on self-reflective processes (Tanimoto 2005) and (Gama 2004).
1.2.1
Ideas
In the TEL context, the creation of a user profile is fundamental for fulfilling some didactic tasks, such as measuring the degree of participation to a course, the performance around quizzes and assignments or the degree of commitment to a discussion forum / blog. The procedure involved with the profile generation is based on the collection of information usually stored as a number of log files generated by software applications. The tasks dedicated to user profiling are normally already managed by LMSes, which also provides a way for exploring the collected information. There is however no way, at present, to target the data usage and presentation or personalise it based on “semantic” data interpretation. The purpose of this work is therefore to shape and adapt the visual presentation of the data based on one or more of the different characteristics defining the learning experience (i.e: the user role, the context, and the device used).
With such an approach, it also becomes possible to think about integration of data com-ing from different systems. This possibility assumes a higher relevance if we consider the Life Long Learning (LLL) context, which is the process of personal continuous enhancement and empowerment that takes place on an on-going basis from our daily interactions with people and environments. One of its peculiar characteristics is the use of different systems in different institutions across the whole learning process and the generation of ’isles’ of data that need to be connected in order to create a unique and possibly valuable learner’s profile. To overcome
the limitations that these ’isles’ imply, studies are being devoted to the enhancement of the procedures related to users’ profile creation, both in term of data source to be used and mean-ingful integration of heterogeneous sources (Abel, Herder, Houben, Henze, and Krause 2010), (Abel, Henze, Herder, and Krause 2010), and (Leonardi, Abel, Heckmann, Herder, Hidders, and Houben 2010).
The idea of opening learners’ profiles, maybe also for integrating them with external on-line resources, has the ultimate goal of creating graphical indicators for the profiles themselves. The generated smart widgets (Glahn 2009) and (Glahn, Specht, and Koper 2008) – simple graphical objects that aim at exposing valuable information to the user – will take into account the highest possible amount of user data, in order to have a more complete and comprehensive view of user behaviors in Learning Management Systems. This data can come from the LMS itself (internal) but can also be collected from other sources (external).
At the same time, this data can be used to create a dashboard for monitoring the status of a course: in this way teachers and tutors could be supported in achieving a better understanding of the current status of the class and, possibly, in adapting the resources and the pedagogical approach accordingly with this information.
Additionally, the Instructional Designers (IDs) (i.e. the pedagogical experts, who are in charge of specifying the didactic interpretation of the stored data in a specific educational environment), can be supported by the awareness of the effective usage of resources and the understanding of which kind of activities are widely adopted, in order to better target their teaching.
Platform administrators can be also supported by a different use of the same information. In fact, a compact representation of some users behaviors in the system, e.g. the login frequency, the preferred time of usage and the kind of resources/activities mainly used on the platform, is valuable information to correctly set up the hardware and software requirements and to monitor the correct platform behavior at run-time. Furthermore, manually extracting this type of data in a just-in-time fashion is normally a difficult, time-consuming, and error-prone task. An automated approach would therefore reduce risk while increasing performance and accuracy.
1.2.2
Aims
This work aims at investigating how the adoption of a tool for offering adaptive visualisations of Open Learner Model to the student could affect the user experience in an educational system. Both the learner’s and the teacher’s sides were investigated in order to achieve a global vision
1.2 Context of the work
on what sort of impact would be generated by its introduction. Part of the job was also devoted to exploring how the introduction of adaptivity – in the amount of data presented as well as the information encoding paradigm and the interface – affects its perception.
The analysis was mainly based on two different levels: the possible effects reported by users after the analysis of the mock–ups and the interaction with the system itself (self–evaluations), but also on run-time evaluations when feasible, as would be the case for the learner’s side. Nevertheless, when this was not possible, we relied on feedbacks, provided by final users, and their opinion about the possible impact they expect.
After the requirements were identified, the research in the GRAPPLE project continued with the development of a general and configurable tool, called GVIS (GRAPPLE VISualization tool), to extract, aggregate and provide information to users of online educational experiences. The development was carried out – for the sake of portability and applicability – using a very generic approach, i.e. decoupling the technical infrastructure from the data semantics, stored into configuration files. This approach allows the software to be completely independent from a specific source or a system using the elaborated information (and in this way to work smoothly with different Learning Management Systems or environments), but also support it to be easily portable between different platforms.
Furthermore, the IDs can rely on these configurations to speed up the development of their own aggregation models without the need of programming skills. The aggregation is the model that drives the creation of indicators based on the data interpretation.
While specifying a new aggregation template is a task that requires some capabilities and attention, it also allows for full customisation. This can empower the ID in defining new cases for data usage through indicators that better fit in with the designed didactic experiences. The collaboration with experts in the field of pedagogy was fundamental for developing such an approach. In fact, it allowed to create new general configurations to be used with the tool based on different pedagogical models. It was also crucial in the interpretation of the quantitative information that was collected in order to validate the application of the GVIS tool.
The work had two main contributions. The first was aimed at showing that the approach of mixing data from heterogeneous and not related data sources can have a meaningful didactic interpretation. This can be achieved through an explicit declaration of the data semantic for the educational experience.
The second contribution was more related to the perceived impact on online experiences of the introduction of the adaptivity in the graphical visualisations produced by such a tool,
especially applied to a LLL approach.
An optional objective was the explicit identification of good practices and criteria, if such things even exist, to develop templates for the implemention of services for learner models, which could also be empowered by adaptive functionalities. Unfortunately, this was not fully achieved due to the difficulties in finding teachers with different didactic approaches keen to take part in the experimentation.
For the first contribution, a number of test cases were created to demonstrate the portability of the tool among different systems – mainly educational tools – and the possibility to offer valuable information from heterogeneous and distributed sources.
The second contribution was analysed through a measurement of the impact of OLM adap-tive representations on the learner’s online educational experiences and through the perceived impact on teacher. The plan was to also measure it through the level of self-confidence (Ban-dura 1997) and (Tschannen-Moran and Wolfolk Hoy 2001) provided by the adoption of such a tool but, as already mentioned, the difficulty in finding enough teachers willing to participate in the experiments made this non-achievable.
The third potential contribution was directed towards the identification and classification of the criteria for developing an adaptive learner model. This could have been a more theoretical contribution to the field. Creating such a taxonomy could speed up the adoption of this kind of services, by showing the possibility to seamlessly integrate some adaptive behaviors in already existing externalised models. This was also expected to justify the previous objective and to propose this open problem to the community for further investigation and research.
1.2.3
Research Questions and Methodology
After demonstrating the generality of the tool and the applicability of the semantic data descrip-tion approach, the main quesdescrip-tion driving this research was how an adaptive visual representa-tion of the Open Learner Model could improve the user involvement in eLearning experiences without overloading the cognitive aspect.
In order to find an answer, it was first of all necessary to understand how a learner model could be represented in term of visual presentation to the system users (A). Subsequently, its effects and performances for learners (B.1) and teachers (B.2) could be analysed. Throughout the research process to investigate the above, an additional issue was raised which had to be solved: could general criteria for building adaptive model in the visualisation of OLM be defined (C)? Most of the Open Source (OSS) eLearning systems that are currently available
1.2 Context of the work
do not internally provide a comprehensive and life-long learner’s model based on the definition given above.
Thus, as a prerequisite for the experiments, aggregation templates had to be defined to support the creation of a user model in the learning environment, starting from heterogeneous sources among which a primary role was once again played by the logs collected from the learning management platforms in adoption.
This could be achieved – in each tool that has to be connected – through the semantic inter-pretation, inside GVIS, of logs representing users’ events recorded in the educational platform and integrated with data coming from other tools used in the educational experiences. This means the ability to give a meaningful didactic interpretation to the actions performed or the status achieved by users.
Point A (about possibilities to visually encode the learner model for presentations purposes) is based on the collection of educational templates that are a good fit for the online experiences used for runtime testing. The educational templates are sets of instructions codified in a formal language that describe the data transformation and the information aggregation that make sense for the didactic approach adopted by the ID. This set was created by reusing the templates already developed in GRAPPLE1 or through the identification of fresh ones for
each individual case. The set of templates chosen for GRAPPLE by researchers – based on stakeholder interviews – was instantiated in the GVIS tool and adapted to run the experiments. In this phase a fundamental contribution from pedagogues/teachers of the university offering the course of interest has assured the adherence of the aggregation templates to the didactic approach used in the online course.
A positive side effect was the extension of the set of pre-defined configurations that was developed inside GRAPPLE. These configurations will be released and a part of them are attached to the current thesis, as examples, in the appendix.
For the objective B (effects and performances analysis), a quantitative analysis was chosen as the most suitable option. Point B.1 (for learners) was analysed referring to Kirkpatrick model (Watkins, Leigh, Foshay, and Kaufman 1998) and exploring the first two levels defined in the stacked model presented which refer, respectively, to the reactions to the introduction of
1GRAPPLE stands for ”Generic Responsive Adaptive Personalized Learning Environment”. The GRAPPLE
project aims at delivering to the learners a technology-enhanced learning (TEL) environment that guides them through a life-long learning experience, automatically adapting to personal preferences, prior knowledge, skills and competences, learning goals and the personal or social context in which the learning takes place. The same TEL environment can be used/accessed at home, school, work or on the move (using mobile/hand-held devices).
the tool and to the effects on knowledge produced by its usage. The methodology applied was based on online questionnaires (an effort was made to try and keep them compatible with the ones used in the initial evaluation of the GRAPPLE project, in order to allow for comparison) and analysis of the performances of the courses in term of pre/post test (or, when not available, of self-evaluation one) and grades received by student, if available for the inspection.
For objective B.2 (effects and performances for teachers), the original plan was to apply a sub-part of the Teacher Self-Efficacy (Bandura 1997) and (Tschannen-Moran and Wolfolk Hoy 2001) questionnaire, in order to allow the emergence of the possible empowerment offered by the usage of the GVIS tool in the teaching practice of eLearning experiences. Even though the small amount and insufficient heterogeneity of the teacher participating in these experiments has not provided us with statistically relevant analysis, we offer some initial considerations based on the self-evaluation and perception of impact from teachers and tutors involved, collected through online questionnaires.
Finally, point C – related to the idea of shared processes able to support the design of templates for creating adaptive visualisation of OLM – was not analysed separately but rather viewed as a milestone for running the experiments. No general criteria emerged from the work that was carried out. To tackle this point we had to rely solely on the professional ability and discretion of the Instructional Designers as the adoption of an explicit external design was not a doable option.
This work continues as follows. Chapter two explores the state of the art in the field, analysing the areas of IV, TEL, OLM, and EDM (with some additional consideration about the possible impact of externalisation). Here the position of this work is also presented in relation to other researches. In chapter three, the context in which the framework for the creation of user indicators (called GVIS) initially took shape is presented. Chapter four deals with the technical implementation of the software tool. Chapter five is around experiments that were performed using the tool both inside different LMS and Intelligent Tutoring Systems (ITS) as well as stressing data source coming from different context of activity. In this chapter we also offer some initial evaluations of the tool, in terms of adherence of the designed functionalities to the perceived needs on the one side and in terms of the effects generated when applied in study cases on the other one. Chapter six is composed of three sections: the first one discusses objectives that were achieved as well as problematic areas or aspects, the second one draws the overall conclusions, and possible next steps and references are presented in the final section.
Chapter 2
Background / State of the Art
The background of the current work can be identified as a set of basics thematic areas which provide, as an overall, the bricks for meaningfully contextualise the experiments done using the tool developed based on the user requirements. In the section dedicated to Information Visualization, the usage of techniques and approaches for representing a rich and complex set of information in a compact and effective ways is explored. In the Technology Enhanced Learning section the broader context is presented and further expanded – primarily around the main subject – in the paragraph about Open Learner Models. The reasoning as well as the association of the data to the semantics is discussed in the area of Educational Data Mining, where concepts around Learning Analytics (LA) are also described. A description of the possible effects of the externalisation of the learner model is then presented. Finally, in an additional section of the chapter, a short introduction to the objectives of the Grapple project is included as well as the specific context in which the GVIS tool was originally conceived, planned and developed.
2.1
Information Visualization (IV)
Information Visualization is the field of Computer Science that examines techniques for repre-senting a vast amount of abstract data in a visual format, so that the data can be comprehended and interpreted by human beings. It is also defined (Card, Mackinlay, and Schneiderman 1999) as the art of putting together small data fragments, that taken alone have no real value or usage, to create a graphical representation that can enhance the reader visual system for the knowledge processing and acquisition. Binding on this premise, the main goals of visualisations
as reported in the literature can be divided into three categories: exploration (researching rela-tionships, trends, and interesting phenomena); confirmation (validating or refuting hypotheses); and presentation (conveying information to others) (Spence 2007).
In the educational context, several researchers use visualisation techniques to provide tools to support more effective learning and instructions (Duval 2011). However, while these visuali-sation tools could be valuable for both instructors and learners, the majority of research in that field targets instructors and educational institutions (Dawson 2010), (Dawson, Bakharia, and Heathcote 2010), (Graf, Ives, Rahman, and Ferri 2011), (Vatrapu, Teplovs, Fujita, and Bull 2011), and (Zhang and Almeroth 2010).
Dawson (2010) proposed a model for capturing and analysing the changes in students behav-iors and their learning network composition for the purposes of proving educators with visual information to support their intervention, especially to the ones identified as being “at risk”. The availability of such a tool – through the usage of the SNA1applied to engagement data – allows instructors to make more reasoned and informed choices about their didactic plan and its evolution.
In the work of Dawson, Bakharia, and Heathcote (2010) a model that tries to recover the multiple learning hints lost in the online educational experiences in respect of the face–to– face ones was instantiated in a tool called SNAPP (acronym for Social Network Adapting Pedagogical Practices). The authors demonstrated that, by stressing the new computational and storage capacity of the recent IT infrastructures available, the implementation of learner model became affordable in real–time, this being one of the condition that was previously preventing the adoption of this kind of approach. The visualisation of this real-time evaluative data – such as indicators of social network structure and centrality, social interactions and communication flows representations, connection degrees of learners (nodes), and hub structure inside the eLearning community – was then able to support the activity of educators both in intervening for supporting the learners and in better planning didactic activities.
Graf, Ives, Rahman, and Ferri (2011) concentrated their attention on the design of a DSS2
that would overcome the availability of reports based on the very general and limited information normally provided by the learning management systems adopted by educational institutions.
1SNA is an acronym for Social Network Analysis and is an approach consisting in extracting information
about the relationship that exists in one environment relying on the links that connect its elements.
2DSS stands for Decision Support System which is a typology of software devoted to the aid of the human
decision process, through the offer of additional information, its aggregation at a higher level or the extrapolation of cubes inside the data.
2.1 Information Visualization (IV)
They relied on the extracted information about the learning process to support teachers and course designers in identifying difficulties or inappropriate learning materials. The main contri-bution they expected to provide was related to the design of improved educational resources and supporting activities based on the students behaviors during their usage and delivered through visual hints.
Vatrapu, Teplovs, Fujita, and Bull (2011), on the other end, focussed on the teacher’s dynamic diagnostic process, as they consider this skill of primarily importance in the teaching profession. They developed a triadic model of the “teaching analytics” – called TMTA – which is based on the collaboration of a Teaching Expert (TE ), a Visual Analytic Expert (VAE ) and a Design–Based Research Expert (DBRE ). The model can be used for planning and evaluating an instance of the classroom activity. With regards to the application of this model they proposed a strong coordinated action of these three experts to analyse, interpret and act upon the real-time visual information (info–graphics) extracted from the learners’ interaction with the educational platform. Their work does not offer actual visualisations, but rather proposes a model that has to be instantiated –together with the visualisations – during the planning of the classroom.
Zhang and Almeroth (2010) analysed the cases in which Information Visualisation is used to create indicators of the learning activities in conjunction with a well known LMS that provides only a very limited and fixed set of information about the students’ activities, not fully exploiting the richness of the collected log. The tool is tailored to instructors and educational researchers to help them evaluate the contribution of the LCMS1to the learning, through the assessment of the learners’ behaviors and progresses. The present work tries to extend this approach, making the data extraction and aggregation process independent from a single specific LMS.
Only a minor fraction of projects focus on providing visualisation to students (Arnold and Pistilli 2012), (Arroyo, Ferguson, Johns, Dragon, Mehranian, Fisher, Barto, Mahadevan, and Woolf 2007), and (Long and Aleven 2011).
Arnold and Pistilli (2012) concentrated their attention on the development of an early intervention solution to provide real-time feedback to students. The tool – called Course Signals – relies on multiple typologies of data about students e.g. grades, demographic characteristics, past academic history and current effort (as measured by the interaction with the educational platform). It creates an indicator based on color, adopting the metaphor of the traffic light
1LCMS stands for Learning Content Management System which is usually adopted as an alternative
defini-tion for LMS, based on the fact that historically its main usage was – completely or extensively – just to deliver educational contents, without the addition of any specific educational activity.
signal, and delivers it to each student by means of the institutional email to indicate them how they are doing in respect of the objectives settled by their tutors. Additionally, faculty members receive a personalised report comprising the status of their students: in this way, the adoption of the tool has also the effect of sharing the perception of the situation amongst the different stakeholders in the educational experience.
Arroyo, Ferguson, Johns, Dragon, Mehranian, Fisher, Barto, Mahadevan, and Woolf (2007) reported the effect of disclosure, in the form of graphical indicators, of the interventions put in place by an automated tutor to support the learning experience, such as the progress charts that disclose the evolution of their responses accuracy to the learner. They noticed that students tend to be disengaged after using a tutorised system for a certain amount of time, but directly providing them with self-monitoring functionalities could induce a re-engagement, based on the self-reflection and self-monitoring processes that they will trigger. They stressed this evidence by implementing an Open Learner Model enhanced with explicit suggestions and encouragements, based on the specific real–time situation of each learner.
Finally, in the work of Long and Aleven (2011) they explored the perceived impact and the behaviors induced by the usage of information about the learner profile by the student itself through surveys and interviews with the learners. They offered simple visualisations, based on bar-charts, to represent the level of skill mastered by the learner. The teachers’ point of view, obtained through interviews in the analysis phase, is also taken into account and used as a reference point. The authors discovered that the possibility to witness the evolution of this very simple OLM encourages the learning process. Another interesting finding was related to the discrepancy between the model as calculated and stored inside the system and as self-perceived by the learner, which ingenerates in the learners a sentiment of mistrust in the system. What they discovered is that this is reported to happen quite frequently, demanding an intervention to solve this situation.
This second aspect justifies all the researches on interactive open learner models, in which the learner can interact and modify the model itself, sometimes simply by indicating a perceived variation of his/her needs and some other times by proving their competency with question or supporting evidence.
Finally, they observed that the possibility to inspect these models is not automatically accompanied by a self-reflective process, but needs to be specifically supported and induced. This is made possible, for example, by providing a compact visual cue about the current status
2.2 Technology Enhanced Learning (TEL)
of the student model and allowing further explorations of the model, through interactions and the reflection on the specifically provided at a higher level.
2.2
Technology Enhanced Learning (TEL)
The field of Technology Enhanced Learning is related to the usage of digital technologies in the practice of education. Its main focus is the alignment between the technologies applied and the different aspects of the learning experience – resources, actions, and objectives – in order to provide socio-technical innovations in education, independently from time, place and pace constraints.
Unfortunately some negative side effects are well known, like a higher rate of dropouts (Levy 2007) a feeling of loneliness, isolation and low motivation to learn (Rovai 2002).
Levy (2007) – after a more formal definition of what can be considered a dropout in eLearning field, which was previously not well defined – explored the possible reasons connected with its increase in online experiences compared to the on-campus presential ones. The main finding was that amongst the key–factors considered –namely the academic locus of control and the student’s satisfaction– only the second one showed to be a reliable indicator, whereas the locus of control seemed to play no role in the student’s dropout rate. As expected, the author found a negative correlation between the students’ satisfaction and their dropout rate.
Rovai (2002) on the other end explored the impact of learning communities in educational experiences, comparing the cases of presential ones to the eLearning ones and positively corre-lating the sense of being part of a community with a higher level of fulfilment and satisfaction. This work reached the conclusion that fostering the creation of learning communities in online courses can facilitate the dialog and decrease the psychological distances amongst the partici-pants. In the present work this point supports the idea of extending the presented information to social aspects.
Other authors have also reported that these issues could be reduced by increasing the level of engagement among students, such as in (Laurillard, Oliver, Wasson, and Ulrich 2009). They reported the capacity of the new digital media to connect innovation and practices, generating a natural sense of engagement and curiosity towards the messages encoded on that medium. In fact, the authors stressed the fact that the adoption of the new digital media can be a way to improve the students’ capabilities to express themselves, thus allowing them to enhance