3D imaging of volcano gravitational deformation by
computerized X-ray micro-tomography
M. Kervyn
1*, M.N. Boone
2, B. van Wyk de Vries
3, E. Lebas
3,4, V. Cnudde
1,2, K. Fontijn
1, and P. Jacobs
11
Department of Geology and Soil Science, Ghent University, Krijgslaan 281/S8, 9000 Gent, Belgium
2
Ghent University Centre for Tomography (UGCT), Department of Physics and Astronomy, Ghent University, Proeftuinstraat 86,
9000 Gent, Belgium
3
Laboratoire Magma et Volcans, Université Blaise Pascal, 5 Rue Kessler, 63038 Clermont-Ferrand, France
4Institut de Physique du Globe de Paris, 4 Place Jussieu, 75252 Paris, France
Geosphere; October 2010; v. 6; no. 5; p. 482–498; doi: 10.1130/GES00564.1; 11 fi gures; 1 table.
*Corresponding author: [email protected].
ABSTRACT
Analogue models are commonly used to gain insights into large-scale volcano- tectonic processes. Documenting model surface topog-raphy and the three-dimensional (3D) aspect of deformation structures remains the great-est challenge in understanding the simulated processes. Here we present the results of vol-cano analogue models imaged with an X-ray computerized micro-tomography (µCT) sys-tem developed at the Ghent University Cen-tre for Tomography (UGCT). Experiments simulate volcano deformation due to gravita-tional loading over a ductile layer, a process affecting many natural volcanoes built over a sedimentary substratum. Results show that µCT is able to provide a 3D reconstruction of the model topography with unprecedented resolution. Virtual cross sections through reconstructed models enable us to map the main structures at depth and to document the deformation of the brittle-ductile inter-face due to contrasting X-ray attenuation. Results for lateral spreading and vertical sagging into thin and thick ductile layers, respectively, are illustrated for circular cones and elongated ridges. Results highlight struc-tural patterns not seen in previous models, such as: 1) the 3D form of a polygonal brec-ciated zone at the center of spreading cones; 2) the complete lack of such a zone in sagging cones; and 3) relay structures between gra-ben-bounding faults in spreading cones. In addition, detailed imaging of tension gashes and of the fl exure surface below sagging cones enables the 3D strain distribution to be explored. Experiments with non-cohesive and low cohesion granular materials present striking differences in surface topography
and fault characteristics. Despite limita-tions associated with the scan duration, µCT reconstruction of analogue models appears a powerful tool for better understanding the complex 3D deformation associated with volcano-tectonic processes.
INTRODUCTION
Analogue modeling has been used for over a century to simulate large scale geological pro-cesses. Laboratory models enable researchers to understand the mechanisms controlling the kinematics of large scale deformation processes and the geometry of the resulting structures. In volcanology in particular, physical models enable the investigation of processes such as volcano-scale deformation under gravitational loading (e.g., Merle and Borgia, 1996), volcano fl ank collapse (e.g., Donnadieu and Merle, 1998; Acocella, 2005; Andrade and van Wyk de Vries 2010), volcanic debris avalanche (Shea and de Vries, 2008), interactions of volcanic and tectonic structures (e.g., Lagmay et al., 2000; Merle et al., 2001), as well as intrusive processes (e.g., Mathieu et al., 2008; Kervyn et al., 2009) and caldera formation (e.g., Marti et al., 1994; Roche et al., 2000) on a time frame and at a scale unobtainable by other means. The main objective of analogue models is to create a quantitatively scaled analogue of a natural process in order to analyze the relationships between the imposed boundary conditions and the resulting structures.
This study focuses on analogue models simu-lating volcano deformation due to gravitational loading over a ductile substratum. This process was fi rst proposed by van Bemmelen (1949) and followed by Borgia et al. (1992) to explain structures observed at natural volcanoes. Later,
factors controlling the type of deformation were studied with analogue experiments, using sili-cone to simulate the viscous material deforming under the volcano load (e.g., Merle and Borgia, 1996; Delcamp et al., 2008; Le Corvec and Walter, 2009) and numerical models (e.g., van Wyk de Vries and Matela, 1998; Morgan and McGovern, 2005). Gravitational loading over a ductile layer is associated with radial spread-ing of the volcanic cone due to lateral fl ow of the underlying viscous material, such as clayey sediments. If the viscous substratum is thicker, such as asthenospheric mantle material, thick sedimentary basins, or the crusts over long time spans, the cone tends to sag vertically into the substratum (see van Wyk de Vries and Matela, 1998). Evidence for deformation due to gravi-tational loading has now been recognized at many volcanoes, from strato-volcanoes (e.g., Borgia and van Wyk de Vries, 2003) to large ter-restrial and planetary shields (e.g., Morgan and McGovern, 2005; Byrne et al., 2009; Le Corvec and Walter, 2009).
Detailed documentation of the surface topog-raphy, vertical and horizontal surface deforma-tions, and structures accommodating this defor-mation within the analogue model is essential for exploring the ongoing deformation processes and for enabling comparison with natural volca-noes. Previously, analogue model deformations have been analyzed based on plan view pictures acquired at regular intervals during experiments. Analysis is often restricted to the extraction of horizontal deformation, based on displace-ment of discrete point markers (e.g., Kervyn et al., 2009). More advanced techniques for topographic reconstruction of analogue models, based on multiple images (Cecchi et al., 2003) or stereoscopic image acquisition (Donnadieu et al., 2003; Delcamp et al., 2008), enabled the
μCT imaging of volcano gravitational deformation
characterization of vertical and horizontal defor-mation, as well as the resulting model topogra-phy with mm-scale accuracy when suffi cient surface texture is available.
Dip and kinematics of structures accommo-dating the deformation are either extrapolated from surface traces of these structures and the observed surface deformation, or directly observed from serial cross-sections. Cross-sections require that the model be physically cut, after having been impregnated with water to consolidate the model. Structures are then analyzed based on relative movement of colored layers originally built into the model. This pro-cedure has certain limitations: tension gashes are closed by impregnation and compaction, structures with limited surface displacement might be undetected, and the model is partially or totally destroyed, limiting the number of ori-entations analyzed. Cross-sections are further complicated by the presence of viscous material in the model that cannot be consolidated (e.g., silicone, golden syrup). Experiments were also carried out in two-dimensional (2D) confi gura-tions against a transparent glass wall, enabling detailed characterization of the development of structures at depth during deformation using advanced image correlation techniques (e.g., Burchardt and Walter, 2009; Le Corvec and Walter, 2009). The 2D confi guration and the potential boundary effects, however, limit the capability to extrapolate these observations to 3D systems.
Their conical shape causes volcanoes to deform in all directions under the effect of grav-ity, resulting in a complex network of structures with changing orientations that link and interact with each other. Computerized X-ray tomogra-phy (CT), as a non-destructive imaging system, has the capability to enable the 3D reconstruc-tion of analogue models, permitting virtual cross-sections and the documentation of the 3D complexity of structures. This technique has been used to document analogue models simu-lating 2D tectonic deformation in compressive (e.g., Colletta et al., 1991; Schreurs et al., 2001), transcurrent (e.g., Schreurs, 1994; Ueta et al.,
2000) and extensional (e.g., Mandl, 1988; Sch-reurs et al., 2003) regimes. These applications used a medical X-ray scanner, providing paral-lel X-ray cross-sections through the model, at intervals of a millimeter to several centimeters. These studies highlighted the capabilities of CT imaging for analysis of the 3D geometry and the kinematic evolution of internal structures. The structure identifi cation is based on the fact that fault planes forming in granular material corre-spond to dilatant zones along which the normal arrangement of grains is disturbed, resulting in lower density and thus lower X-ray attenuation, irrespective of the type of fault (i.e., normal, strike-slip, or reverse).
The objective of this contribution is to test and highlight the added value and limitations of computerized X-ray micro-tomography (µCT) to image volcanic analogue models. Volcano gravitational deformation is used as an example of complex 3D topography and deformation. Preliminary results from end-member experi-ments with contrasted deformation styles, i.e., volcano spreading or sagging, and with con-trasted volcano shape, i.e., circular cone or elon-gated ridges, are presented and analyzed. Spe-cifi cally, the 3D results are used to highlight the impact of gravitational deformation on the inter-nal volcano structure, including the formation of a brecciated central zone in spreading volcanoes and the lack of it in sagging volcanoes. The documentation of interactions at depth between faults observed at the surface and relationships between the surface and the silicone deforma-tion are other original contribudeforma-tions of this study. METHODOLOGY
Experimental Material, Setup, and Scaling The experiment setup and materials used were similar to previous analogue modeling of gravitational deformation of volcanic cones (e.g., Merle and Borgia, 1996; Walter et al., 2006; Delcamp et al., 2008). Analogue mod-els were built in cylindrical plastic containers, 15 cm in diameter and 5 cm in height, open in
their upper part. The small size of the setup was dictated by the relationship between setup size and the resolution of the µCT images. The duc-tile sediment layer was simulated using a 4.5 or 11 mm thick layer of Polydimethylsiloxane (PDMS; Dow Corning SGM 36), a Newtonian fl uid of 4 × 10⁴ Pa s viscosity. A horizontal layer
of granular material (i.e., analogue for the brittle crust), half the thickness of the ductile layer, was sifted over the PDMS layer, before emplacing a 2–2.5 cm high circular or elongated cone in the center of the model.
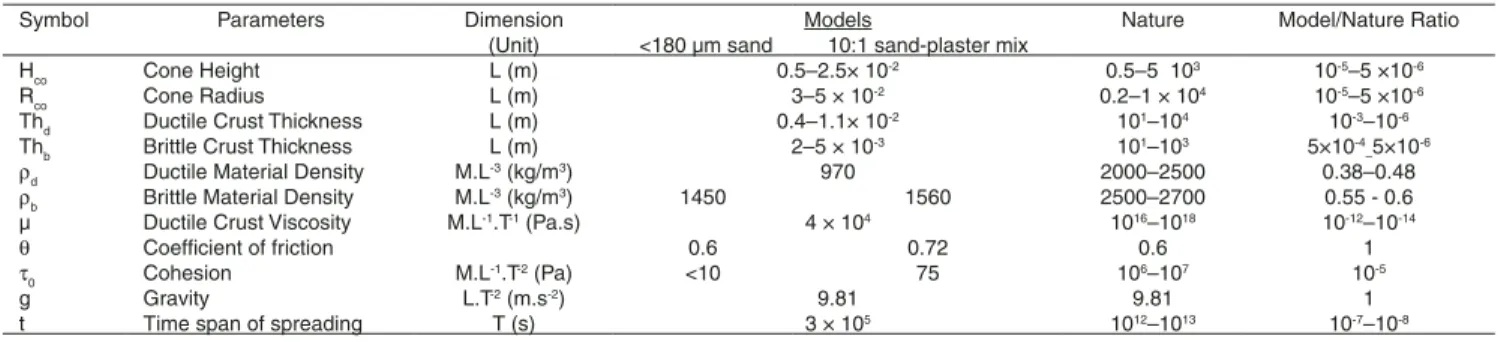
In order to be comparable with natural vol-canoes, analogue models need to be geometri-cally, kinematigeometri-cally, and dynamically scaled. For scaling we used the approach developed in previous experimental work on volcano gravi-tational spreading (Merle and Borgia, 1996; Borgia et al., 2000; Walter, 2003; Walter et al., 2006; Delcamp et al., 2008). Table 1 shows that geometrical parameters are scaled with a model/ nature ratio of 10−5 to 5 × 10⁻⁶. One centimeter in the model represents 1–2 km in nature. The dynamic scaling is achieved if the gravitational stress ratio σ* = ρ* × g* × h*, where ρ*, g* and h* are the model/nature ratios for the den-sity, gravitational acceleration, and height of the volcanic cone, respectively. This calculation yields a stress ratio of ~2.5–5 × 10⁻⁶. Hence the
analogue volcano should be ~2.5–5 × 10⁶ times
mechanically weaker than a real volcano. Using very low cohesion granular material enables simulation of volcanoes that have a bulk cohe-sion of 106 – 107 Pa, the approximate cohesion
of fresh non-fractured rock.
Natural white quartz sand sieved to 125– 180 µm grain size range was used as granular material to simulate the brittle crust and the volcano. The sand was sifted to build up the brittle crust and the cone in order to obtain a homogeneous, densely packed sand as sug-gested by Lohrmann et al. (2003) and Pan-ien et al. (2006). To test the effect of cohe-sion in the model, experiments were also run with a 10:1 mix of the same sand with plaster (<50 µm). This plaster has a higher coeffi cient of internal friction (0.78 instead of 0.62) and a
TABLE 1. CHARACTERIZATION OF ANALOGUE MODEL PARAMETERS AND COMPARISON WITH VALUES EXPECTED FOR NATURAL CASES
Symbol Parameters Dimension Models Nature Model/Nature Ratio
(Unit) <180 µm sand 10:1 sand-plaster mix
Hco Cone Height L (m) 0.5–2.5× 10
-2 0.5–5 103 10-5–5 ×10⁻⁶
Rco Cone Radius L (m) 3–5 × 10⁻² 0.2–1 × 10⁴ 10-5–5 ×10⁻⁶
Thd Ductile Crust Thickness L (m) 0.4–1.1× 10⁻² 101–104 10-3–10-6
Thb Brittle Crust Thickness L (m) 2–5 × 10
-3 101–103 5×10⁻⁴ –5×10
-6
ρd Ductile Material Density M.L
-3 (kg/m3) 970 2000–2500 0.38–0.48
ρb Brittle Material Density M.L
-3 (kg/m3) 1450 1560 2500–2700 0.55 - 0.6
µ Ductile Crust Viscosity M.L-1.T-1 (Pa.s) 4 × 10⁴ 1016–1018 10-12–10-14
θ Coeffi cient of friction 0.6 0.72 0.6 1
τ0 Cohesion M.L
-1.T-2 (Pa) <10 75 106–107 10-5
g Gravity L.T-2 (m.s-2) 9.81 9.81 1
low cohesion, 70 Pa, in contrast to the quasi- cohesionless pure sand.
The kinematic scaling, i.e., the speed at which the analogue model deforms relative to natural cases, is poorly constrained. Deformation veloc-ities are entirely constrained by the balance between the brittle crust and volcano load (and thus its density and height) and the viscosity of the underlying material (Delcamp et al., 2008). Natural viscosity values are ill-constrained and range over several orders of magnitude. Therefore, the deformation velocity of ana-logue models cannot be directly compared with natural cases, but our approach focuses here on the structures associated with the deformation, which are controlled by the system geometry rather than the deformation velocity (Delcamp et al., 2008; Le Corvec and Walter, 2009).
The physical properties of the analogue mate-rials are given in Table 1 and compared to values expected in natural volcanoes. These experi-mental materials were chosen because they have been shown to be well suited to CT analysis. PDMS has a lower and well-contrasted X-ray attenuation relative to quartz sand (Colletta et al., 1991; Panien et al., 2006), enabling good discrimination of the viscous layer deformation. Analogue models have to be stable during the ~2 h that the µCT scan lasts, i.e., the remaining displacements have to be smaller than the scan resolution (80 µm). Through vertical imaging of test experiments, it was found that horizon-tal surface displacements were systematically below this limit 72 h after emplacement for all model types. Four similar models for each set of experimental conditions were built and left to deform for 72 h. Comparable surface defor-mation structures were observed in each of the repeated models, except for occurrence of asym-metric structures due to model heterogeneities, ensuring that experimental results are repeatable. The most symmetric model for each type was selected to be scanned with the µCT setup. X-ray Micro-tomography at UGCT
The basic principle of CT imaging is based on the attenuation of X-rays through materials. This attenuation depends mainly on material density, effective atomic number, and thickness. Fault formation in sand-box models is associ-ated with dilatation of the granular packing and thus reduction of the X-ray attenuation, as ana-lyzed and discussed by Panien et al. (2006).
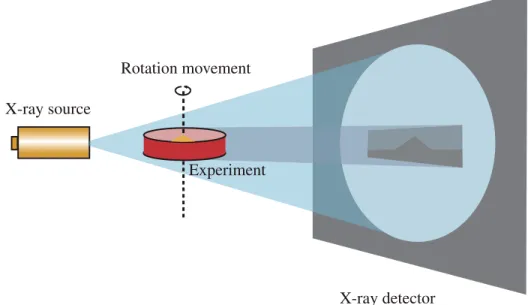
The study was carried out with the Ghent University Centre for Tomography (UGCT) micro-CT scanner (http://www.ugct.ugent.be), which is described by Masschaele et al. (2007). The high-power directional tube head was used for maximum beam intensity at a high voltage
Rotation movement
X-ray detector
X-ray source
Experiment
Figure 1. X-ray micro-tomography setup used at UGCT for imaging analogue experiments. of 130 kV and a tube current of 269 µA target
current, resulting in 35 W effective target power. The X-ray beam was fi ltered by 1.5 mm Cu and 3 mm Al to prevent beam hardening effects. A Varian PaxScan 2520 V detector with CsI scin-tillator was positioned horizontally to obtain an image width of 1880 pixels of 127 × 127 µm2.
Due to the fl at geometry of the volcano models, only part of the detector height was used. 1500 projection images were recorded; each projec-tion was an average of 4 frames with 500 ms exposure time, resulting in a total scan time of a little less than 2 h. With a source-to-object distance of 516 mm and a source-to-detector distance of 820 mm, a magnifi cation of 1.59 was achieved, which corresponds to a spatial resolution of 80 µm. This resolution is much better than that achieved by medical scanners, but it also has two drawbacks. The duration of the scan is much longer, making a scan of the experiment during the deformation impossible. Because the sample itself is rotating (Fig. 1), the rotation speed must be set suffi ciently low to prevent damage from centrifugal effects to the model. It was verifi ed experimentally that a rotation speed of 25° s-1 does not affect the
structure. Because infl uence on scan time is negligible, a safety margin was included by set-ting the rotation speed to 10° s-1.
All data sets were reconstructed using the software package Octopus (http://www.inct.be). The server-client mode reduced the reconstruc-tion time for around 250 slices of 1880 × 1880 pixels to 5 min for 4 clients. No beam hardening correction was used in the reconstruction. For 3D rendering, the software package VGStu-dioMax was used.
EXPERIMENT RESULTS Spreading of a Low Cohesion Circular Cone
The fi rst experiment simulates the deforma-tion of a circular cone over a thin silicone layer (i.e., initial Thd/Hco = 0.2; see Table 1 for sym-bols and Figures 2–5) using a fi ne, low-cohesion quartz sand and plaster mix. The cone is origi-nally 7.2 cm in diameter and 2.2 cm high (i.e., initial Hco/Wco = 0.3). After emplacement, the cone rapidly spreads radially due to the loading exerted on the silicone. After 72 h of deforma-tion, the cone is reduced drastically in height to 1 cm above the base and its diameter increased to 7.9 cm (i.e., fi nal Hco/Wco = 0.07).
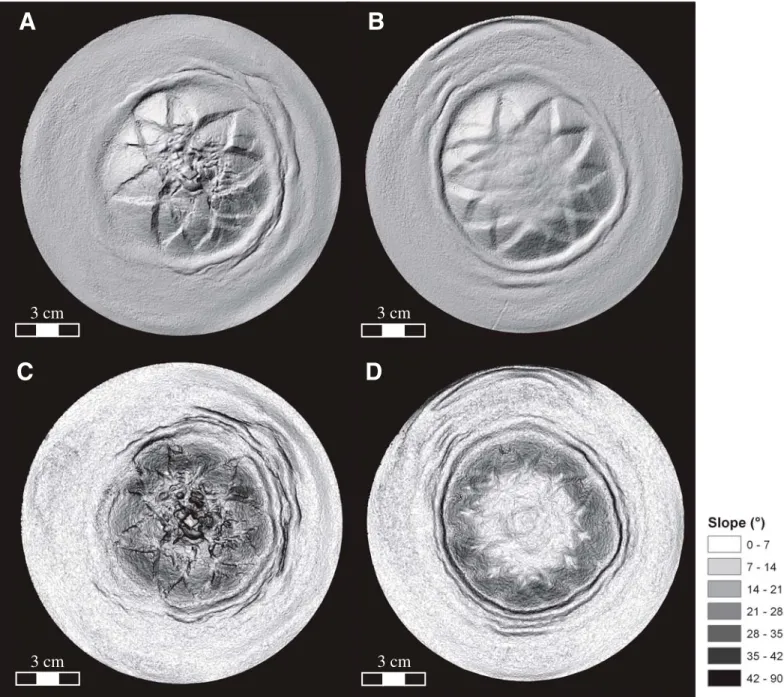
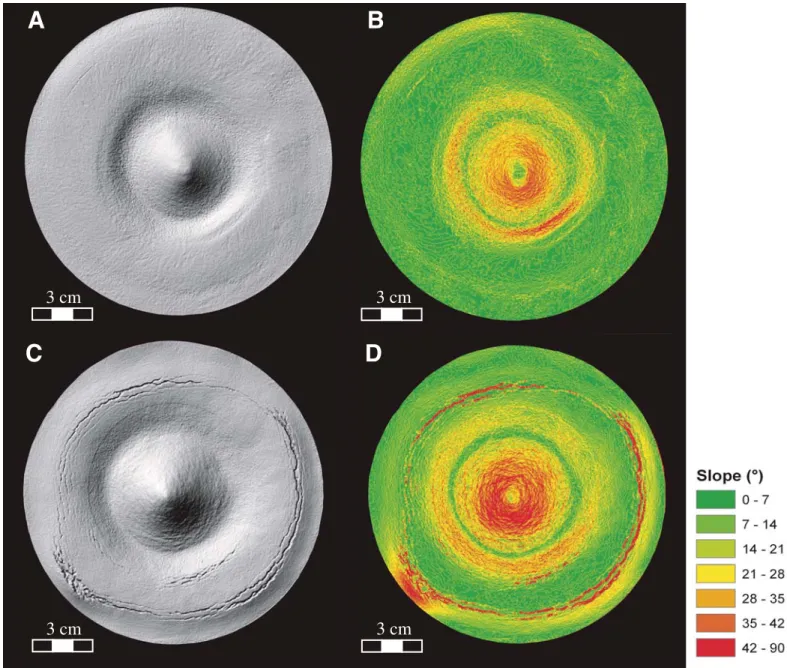
A Digital Elevation Model (DEM) of the experiment surface is extracted from the µCT scan data. Figure 2A, C show the shaded relief and slope distribution derived from the DEM. The model surface is highly dissected and irregular. The cone is characterized by 8 well-expressed symmetric grabens, 1–3 mm deep, and several immature or asymmetric grabens, bounded incompletely or only on one side by a fault. These grabens closing at the base of the cone form a conjugate “fl ower pattern” typical of volcano spreading (Merle and Borgia, 1996; Delcamp et al., 2008). Conjugate graben-bounding faults form an angle of 37–43°.
In addition to V-shaped grabens, the surface of the model is characterized by a high density of fractures, not always associated with vertical offset. The central part of the cone is strongly dissected, with a blocky pattern in the summit zone surrounded by a zone with high fracture
μCT imaging of volcano gravitational deformation
density (Figs. 2A, 2C, and Fig. 5). Note that such fracture zones have only been reported by Delcamp et al. (2008), and then only for the surface. Slopes >45° characterize the sharp graben-bounding structures and the edge of the summit blocks. The mid-fl ank slopes are 10–15° on average, whereas lower fl anks range between 20° and 38°. Slope angles in the slid-ing wedges (Fig. 2B, Fig. 5) between grabens (30–37°) are signifi cantly steeper than slopes within grabens (20–30°).
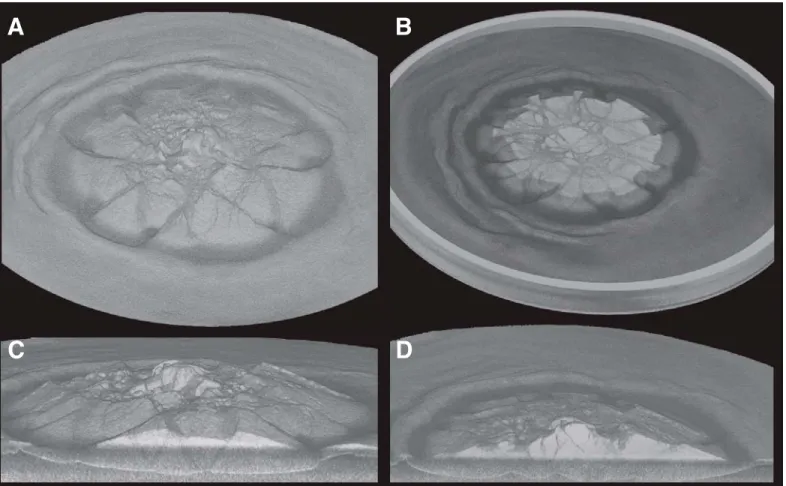
Figure 3 illustrates the 3D reconstruction of the model volume from the µCT data. It
illus-trates the great opportunity offered by µCT volume reconstruction to provide an infi nite number of cross-sections within the 3D volume, enabling us to relate the internal structures with their topographic expression. It can be seen that the cone not only spreads radially, but also sags signifi cantly into the silicone layer, which thins to less than 1 mm below the cone summit.
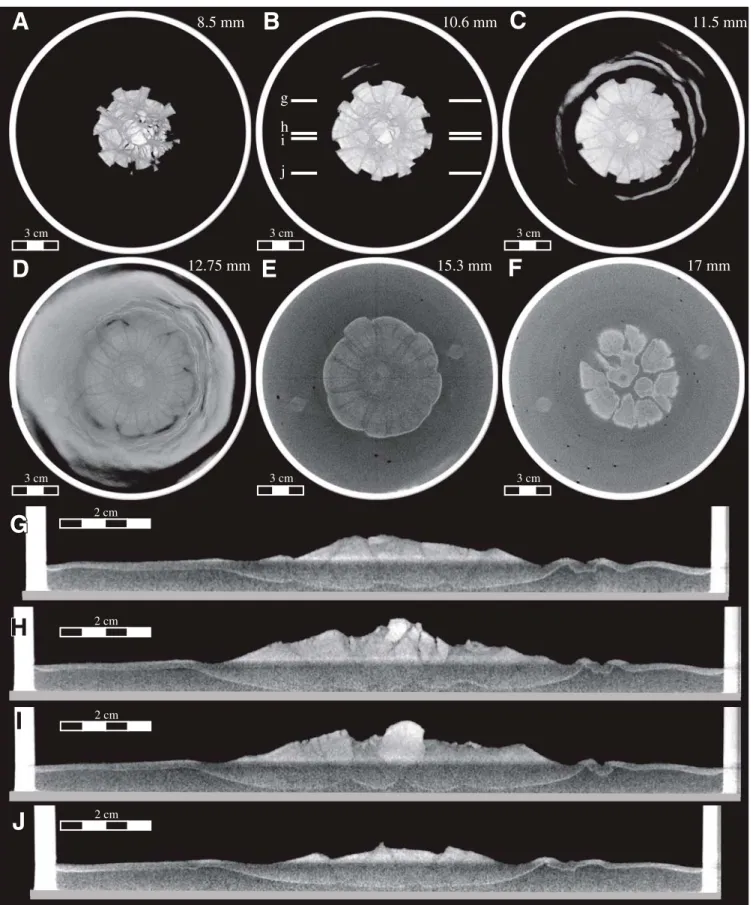
Figures 4 and 5 illustrate typical cross- sections through the model. These serial cross-sections enable the analysis of the structures that accommodated the cone deformation. Moving from the cone base toward its
sum-mit, it is observed, in horizontal cross-sections (Fig. 4A–F), that the outer half of the cone is characterized by undisturbed material except for the graben-bounding structures and some shallow fractures. The graben-bounding faults diverge slightly toward the center and have a curved-outward outline. Structures bounding two adjacent grabens merge into a single struc-ture toward the cone center (Fig. 4A–C). At the cone base level (Fig. 4D), graben-bounding structures penetrate for 50–60% of the cone radius toward the cone center, before signifi -cant interaction occurs with adjacent structures.
A
B
C
D
3 cm
3 cm
3 cm
3 cm
Figure 2. Shaded relief (A–B) and slope distribution (C–D) of the Digital Elevation Models extracted from the 3D reconstruction of cone spreading models for low coheion (A, C) and cohesionless (B, D) sand.
Moving inward into the cone, there is a 0.5–1 cm circular zone with lower density, isolating the central blocks from the outer grabens (Fig. 5). This intermediate zone, characterized at surface by low slopes (Fig. 2C) and general low X-ray attenuation, results from the intersection of the graben-bounding structures.
In vertical cross-sections (Fig. 4G–J), a signifi cant vertical gradient of average X-ray attenuation is visible (Fig. 4G–J). This gradient is associated with variation in the total depth of material crossed by the X-rays. Although this effect limits the capability of identifying structures through the entire cone height, the main graben-bounding structures can be iden-tifi ed. The dip of normal faults bounding gra-bens is 60–65° on average (Figs. 4G, 4J, and Fig. 5C). The summit zone (i.e., ~30% of the cone radius around the center) is characterized by a complex network of structures delimit-ing individual compact blocks separated by open fractures and normal faults. The contrast between the dense blocks and the
intermedi-ate disturbed zone is less well marked deeper into the cone, as normal faults merge below the summit (Fig. 5B). A high density occurrence of a few millimeter-deep tension gashes and deeper fractures is imaged in the intermedi-ate low density zone and around homogeneous summit blocks. These structures, some as nar-row as 200 µm, have a sharp contrast with the surrounding material. Deeper fractures could be the prolongation of graben-bounding faults cutting into the cone center (Figs. 4–5).
Around the cone base, the deformation is associated with formation of concentric, gener-ally asymmetric, anticlines (Fig. 3C). As illus-trated by the interpretation of surface topogra-phy on Figure 5A, these fold structures display lobate shapes and appear to be related in places to graben-bouding faults through relay ramps. Sectors of cones with less well-expressed basal folding are those associated with a slightly higher initial ratio of brittle to ductile crust thickness (i.e., subtle heterogeneities in the ini-tial model).
µCT also provides a good image of the shape of the sand-silicone contact. Generally thinner below the cone, the silicone is seen to rise into extensional zones defi ned by graben-structures but also below the cone center and in the cir-cular zone of heavy fracturing below the mid-fl anks (Fig. 4F, 5B–C). Silicone upwelling is also associated with an anticline structure around the cone base.
Spreading of a Cohesionless Circular Cone Figures 2B, 2D, and 6 illustrate the topog-raphy and representative sections of an exper-iment with the same initial conditions as the one presented in the previous section, except for the use of a cohesionless sand for the cone and brittle crust (Table 1). Striking changes in the resulting cone morphology and struc-tures are associated with the absence of mate-rial cohesion.
The surface of the model presents a smooth texture with twelve symmetrical V-shaped
A
C
B
D
Figure 3. Low cohesion sand cone volume reconstructed from X-ray scan after 72 h of spreading over a 4.5 mm silicone layer. The cone is 7.9 cm in diameter, and rises 1 cm above the average level of the surrounding base. (A) Oblique 3D view of model surface, with irregular blocky texture and secondary fractures; (B) Similar 3D view with horizontal cross section at mid-height through the cone, showing radial pattern of graben-bounding faults and complex network of fractures in the cone central zone; (C–D) Vertical cross sections through the outer fl ank (C) and across cone summit (D) showing propagation of structures at depth.
μCT imaging of volcano gravitational deformation
g
h
i
j
8.5 mm
10.6 mm
11.5 mm
12.75 mm
15.3 mm
17 mm
A
B
C
D
E
F
3 cm 3 cm 3 cm 3 cm 3 cm 3 cmG
G
H
I
H
I
J
2 cm 2 cm 2 cm 2 cmFigure 4. Selected representative horizontal (A–F) and vertical (G–I) X-ray cross sections through the low cohesion cone after spreading. (A–C) Horizontal cross sections at upper, middle and lower cone level, highlighting the graben-bounding faults and the central fractured zone with isolated blocks with higher X-ray attenuation; (D–E) Cross sections at the level of the sand (D) and sili-cone (E) layer; (F) Cone base–silisili-cone contact level showing a circular and radial pattern of silisili-cone upwelling; (G, J) Vertical cross sections through the lower cone fl ank, showing typical V-shaped graben-bounding structures; (H–I) Vertical cross sections through the central zone of the cone, showing complex fracture pattern with varying depth and zones of contrasted X-ray attenuation. White lines in (B) indicate the orientation of vertical cross sections (G–J).
grabens on the outer fl anks. The central half of the cone is mainly fl at with no visible surface structure. Within this central zone, steeper slopes (10–25°) are, however, observed to surround the summit area (i.e., 1–1.5 cm around the center). The lower fl anks are characterized by slopes close to the angle of repose (25–35°). No sig-nifi cant slope differences are observed within or outside the grabens, nor are the graben- bounding structures characterized by steeper slopes.
Looking at the model topography, the con-jugate graben-bounding faults intersect at an angle of 36–42° with smaller opening angles observed on fl anks with more closely-spaced grabens. Going up on the slope toward the sum-mit, structures from adjacent grabens intersect with each other before becoming indiscernible. Grabens are ~1.2 cm wide and ~1.8 mm deep in their upper zone. From the cone base they extend ~2 cm inward (~40% of the cone radius).
In horizontal sections, grabens are bounded by sub-radial structures with lower X-ray attenuation than the surrounding material (Fig. 6A–C). These faults are systematically 1.4–1.8 mm wide (or 18–23 voxels). At high levels in the cone, they affect only the outer cone portion. At lower levels, graben-bounding structures are seen to start always at the same absolute distance from the center, affecting up to 60% of the cone radius at the base level. In
A
3 cm
C
2 cmB
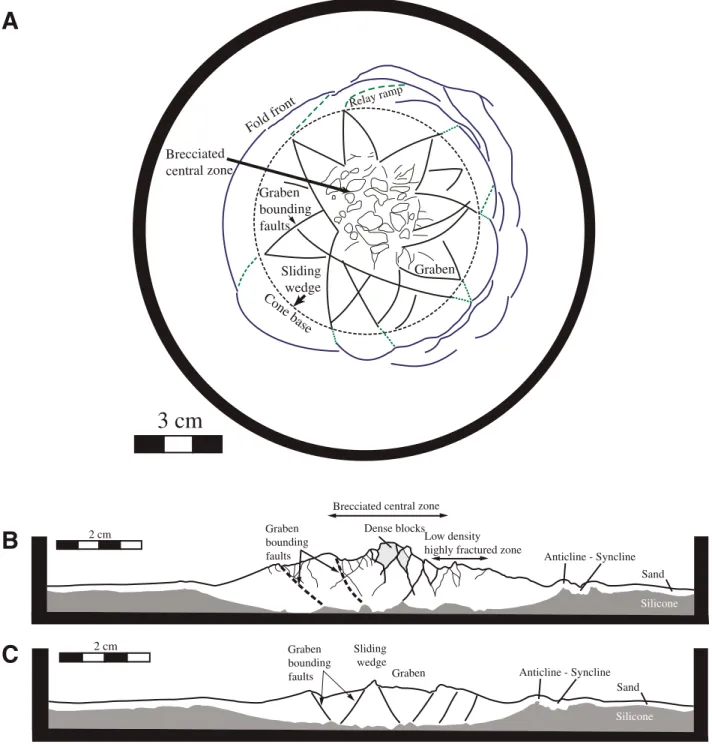
2 cm Fold front Cone base Sliding wedge Graben Graben bounding faults Brecciated central zone Relay ramp Graben Graben bounding faults Sliding wedge Silicone Sand Anticline - Syncline Brecciated central zoneGraben bounding faults Silicone Sand Anticline - Syncline Low density
highly fractured zone Dense blocks
Figure 5. Interpretation of (A) the low cohesion spreading cone model surface (Fig. 3A) and (B–C) cross sections (Fig. 4 H, J) with indications of the key features described in the text.
μCT imaging of volcano gravitational deformation
A
B
C
D
E
F
3 cm 3 cm 3 cm 3 cm 3 cm 3 cmG
H
I
J
2 cm 2 cm 2 cm 2 cmg
i
4.25 mm
5.95 mm
5.95 mm
8.5 mm
10.2 mm
11.9 mm
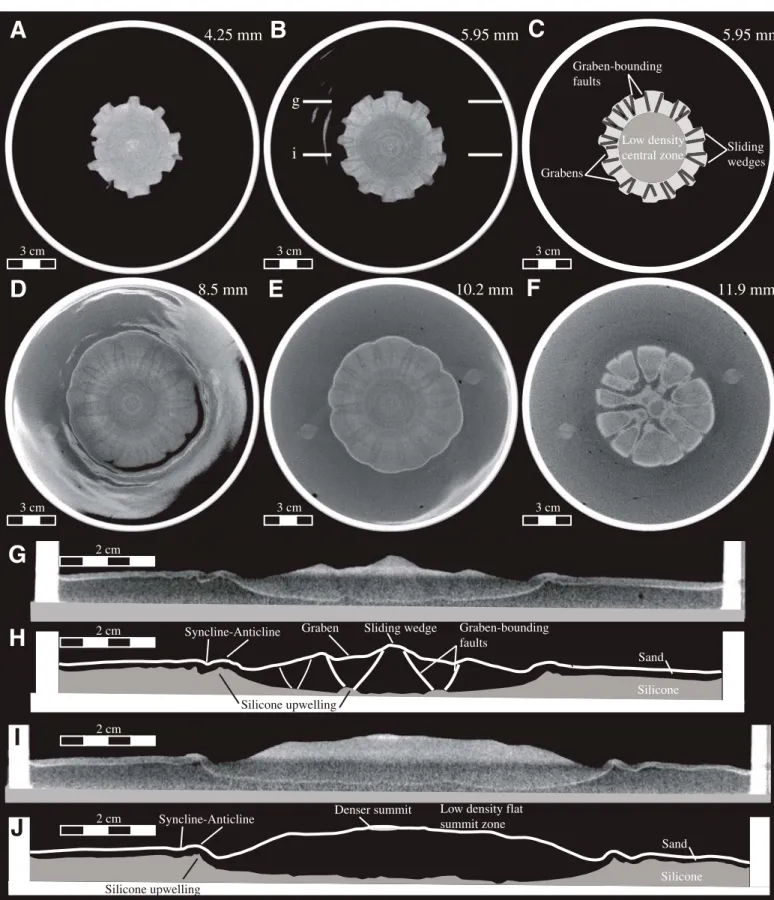
Silicone Graben Sand Graben-bounding faults Silicone upwelling Sliding wedge Syncline-Anticline Silicone Sand Low density flatsummit zone Silicone upwelling Denser summit Syncline-Anticline Low density central zone Graben-bounding faults Grabens Sliding wedges
Figure 6. Selected representative horizontal (A–F) and vertical (G–I) X-ray cross sections through the cohesionless cone after spreading. (A–B) Horizontal cross sections at upper and middle cone level; (C) Interpretation of (B) highlighting the graben-bounding faults and the central zone with lower X-ray attenuation; (D–E) Cross sections at the level of the sand (D) and silicone (E) layer; (F) Cone base–silicone contact level showing a circular and radial pattern of silicone upwelling; (G–H) Vertical cross sections and interpretation through the lower cone fl ank, showing typical V-shaped graben-bounding structures; (I–J) Vertical cross sections and interpretation through the cen-tral zone of the cone, lacking clear structures; note the higher density observed at the summit. White lines in (B) indicate the orientation of vertical cross sections (G–J).
horizontal sections, conjugate graben-bounding structures slightly diverge from each other in the upper half of the cone when propagating into the cone (Fig. 6B–C). Faults from adjacent grabens intersect each other within the cone isolating horsts, or sliding wedges (Fig. 6C), between successive grabens. At lower levels, the con-jugate faults are joined at the cone outer edge but rapidly diverge from each other to become parallel further inward, preserving an internal graben (Fig. 6D–E).
In vertical cross-sections, each graben is seen to be bounded by two linear normal faults converging toward each other at the base of the model. These conjugate normal faults dip at an angle varying from 45 to 70°. Analysis of many successive vertical sections through a single graben shows that these faults are steeper on lower fl anks (65–70°) than in the upper zone of the graben (i.e., dip ~45–55°). Cross-sections through the central part of the cone reveal no well-defi ned structures but illustrate the fl at summit topography and the steeper outer fl anks (Fig. 6I–J).
In addition to the identifi cation of well-defi ned structures, µCT imaging also enables the documentation of broader zones with contrasted average X-ray attenuation and thus contrasted material density. As seen in Figure 6B–C, wedges, or horsts, and grabens between nor-mal faults present a bright color, and thus high density, assumed to correspond to the preserved initial cone density. Preservation of the material density, and thus the compaction, suggest that these zones were not affected by fracturing or faulting outside the well-defi ned fault planes. In contrast, the central part of the cone dis-plays a much lower X-ray attenuation, and thus a lower density. This zone, of constant radius with depth, underwent a signifi cant reduction in compaction during deformation as a result of the complex interactions of the individual graben-bounding faults. As illustrated in Figure 6A and Figure 6I–J, a shallow zone at the summit pre-served a higher density, suggesting that most of the decompaction associated with deformation occurred around and below the summit without signifi cantly affecting it.
Finally, µCT provides a good contrast between the granular material and the sili-cone layer. The contact sand-silisili-cone is even enhanced by a thin layer with higher X-ray attenuation than for the sand, due to infi ltration of the silicone between sand grains at this con-tact layer (Fig. 6E–J). Figure 6G–J shows that cone spreading is associated with signifi cant changes in the silicone layer thickness, thinning signifi cantly below the cone and thickening around its base. This thickening is not uniform, as silicone is seen to rise along radial ridges
below the fl ank grabens, as well as within the low density concentric zone around the summit (Fig. 2B, 6F–H). Directly at the cone base, the silicone forms 2–3 sets of concentric ridges. The fi rst one has an amplitude of 1.5 mm and a wavelength of ~3 mm, resulting in a 0.6–1 cm broad and 1.7 mm high anticline in the brittle crust. This fi rst anticline is asymmetric in places (Fig. 6I) verging toward the cone, with steeper surface slopes on its inward side. Folds devel-oping further away from the cone have lower vertical amplitudes and greater wavelengths. Sagging of a Circular Cone
Volcanoes can build up over thicker layers of ductile sediments or deform over viscous man-tle material (e.g., van Wyk de Vries and Matela, 1998). Here we simulate these conditions by emplacing a volcanic cone of the same shape and size as previous models over a thicker sili-cone layer (Thd = 1.1 cm instead of 0.45 cm in previous cases). The silicone thickness is about half the cone height (Thd/Hco ~0.5). The brittle crust thickness is kept to half the thickness of the ductile layer. The same experi-ment was run with non-cohesive and low cohe-sion granular material.
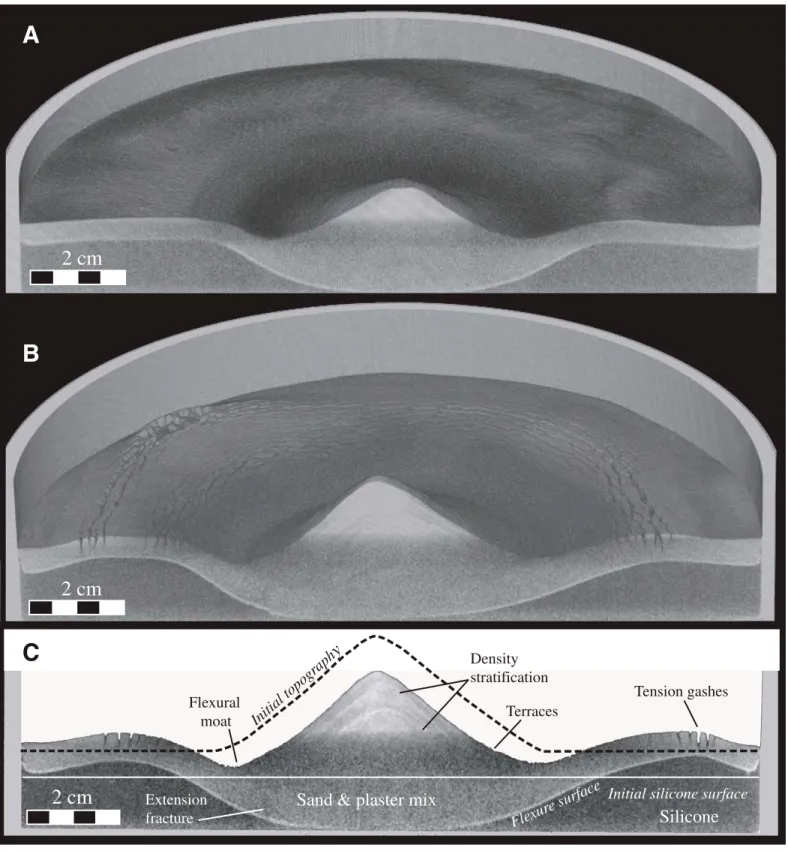
Figure 7 illustrates the extracted surface topography of the two experiments after 72 h of deformation. Figure 8 provides a 3D view of the reconstructed experiment volume with a vertical cross-section through the cone cen-ter and its incen-terpretation (Fig. 8C). Contrary to spreading over thin ductile layers, deformation over a thicker silicone layer causes reduction in the apparent cone radius. Height above its base level was also reduced by 35% and 20%, for the non-cohesive and low cohesion cases, respectively. Starting from the cone summit outward, steep slopes (38–50°) are observed on the upper fl anks for both models. Slopes gradu-ally decrease toward the cone base that is char-acterized by a topographic depression, or moat, whose depth corresponds to a third of the cone height. The surface of the non-cohesive model is smooth and displays no structures in the cone. Greater variability in slope angle is observed for the low-cohesion cones, associated with lobate surface features bordered by curvilinear steep slopes, here called terraces (see Byrne et al., 2009; Fig. 8C). The outer slopes bordering the moat are linear and sharply delineated with slopes between 25° and 45°.
Below the cone center, the silicone is totally depleted, with deformation stopping when the sand reached the base of the experiment setup (Fig. 8). The vertical sagging of the cone was accommodated by lateral fl ow of the silicone away from the cone. Flexure of the brittle crust
caused the formation of the moat and the grad-ual decrease in the cone’s lower slope angle. In the case of the non-cohesive experiment, the silicone layer thickened homogeneously around the cone. The only structure to be observed in the brittle crust is a concentric zone of exten-sion, characterized by lower X-ray attenuation at the outer edge of the moat (Figs. 7A–B and 8A). A similar zone of extension directly out-side the moat is observed in the experiment with low cohesion material (Figs. 7C–D and 8B), characterized by tension fractures 0.2–0.5 mm wide and 2–3 mm deep. As silicone thickened non-uniformly, a second set of tension frac-tures, up to 1 mm wide and cutting through the entire brittle crust (i.e., ~5.5 mm), is observed at greater distance from the cone (Figs. 7C–D and 8B). In places these two zones of extension merge into one (Fig. 8C). The reduced silicone thickness at the experiment border might be caused by the proximity of the setup edge and would not be expected for a ductile substratum with greater lateral extent.
Cross-sections through the reconstructed experiment volumes reveal no evidence for structures accommodating the vertical sagging of the cone into its substratum. A faint, but sys-tematic variation in the average X-ray attenua-tion across the cone is observed on vertical and horizontal cross-sections. The outer fl anks of the cone down to the moat level are characterized by lower X-ray attenuation, with higher attenu-ation in the center zone (Fig. 8). The width of the low density zone increases downward from the cone summit to the moat level. An additional observation is the variation of X-ray attenuation in the low cohesion experiment, along circular structures in plan view, dipping sub-parallel to the slope in vertical sections (Fig. 8B).
Finally, at the sand-silicone contact, below the lower cone slopes, a concentric zone of silicone upwelling is observed, especially well expressed in the low cohesion experiment. On selected cross-sections, this silicone upwelling is associated with a narrowing-upward structure in the sand with low X-ray attenuation, suggest-ing that extensional stresses are exerted at the base of the brittle layer in the zone of highest curvature (Fig. 8C).
Gravitational Deformation of an Elongated Ridge
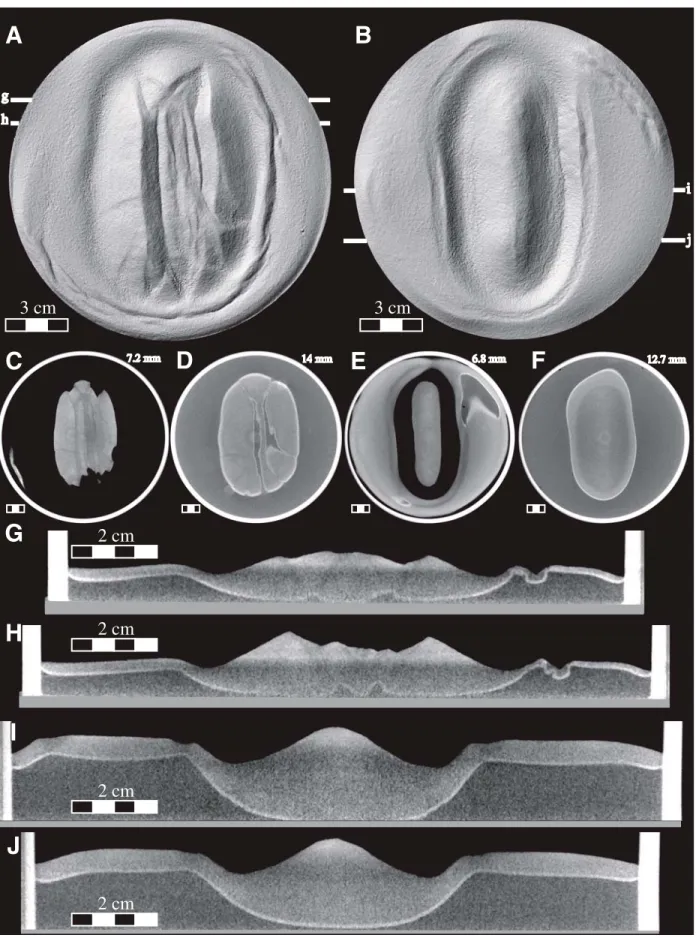
As eruptions often occur along parallel fi s-sures, volcanoes can develop as elongated ridges rather than circular cones. Figure 9 illus-trates the cases of spreading and sagging of an non-cohesive elongated sand ridge (i.e., short to long axis ratio of 0.55) over thin and thick duc-tile substrata, respectively.
μCT imaging of volcano gravitational deformation
To simulate lateral spreading of an elongated ridge, an 11.7 × 6.3 cm wide, 1.8 cm high cone was emplaced over a 4.5 mm thick silicone layer. After deformation, the cone was 12.1 × 7.8 cm wide and 1 cm above its base, with greater spreading in the orientation of its short axis. The spreading of this elongated ridge results in a construct and structures comparable to its circular analogue, with one dominant direction of deformation perpendicular to the elongation axis (Fig. 9A). One main graben bounded on each side by main normal faults forms along the summit ridge. Within this central graben several smaller structures defi ne nested internal gra-bens. At each extremity of the ridge, this central
graben separates into 2 to 3 diverging V-shaped grabens. Graben-bounding normal faults dip at 45–50° in the central part of the main graben, and at 55–60° in the V-shaped grabens on the fl anks (Fig. 9G–H). A few poorly expressed grabens are also observed on the long fl anks. At depth into the sand ridge, the deformation results in several low density linear structures parallel to the elongation axis, causing an over-all decrease in material density along the sum-mit ridge (Fig. 9C). Silicone upwelling along two linear structures at the cone base (Fig. 9D) corresponds to the extensional zones delineated by the two main graben-bounding normal faults and the secondary internal structures (Fig. 9H).
To simulate sagging of a sand ridge, a 11.3 × 6.3 cm wide and 1.7 cm high cone was emplaced over a 11 mm silicone layer. After deformation, the cone was 11.2 × 4.8 and 1 cm above its base, with thus greater apparent basal shortening along the short axis. Vertical cross-sections parallel to the cone short axis present similar characteristics to the experiment of cir-cular cone sagging presented in the previous section (Fig. 9I–J). The slope decreases toward the cone base, and the topographic moat has a depth corresponding to half the remaining cone height. The cone sagged vertically to reach the base of the setup and the silicone is thicker than initially below the fl at brittle crust. Concentric
A
B
C
D
3 cm
3 cm
3 cm
3 cm
Figure 7. Shaded relief (A, C) and slope distribution (B, D) of the Digital Elevation Models extracted from the 3D reconstruction of cone sagging models for cohesionless (A–B) and low cohesion (C–D) sand.
A
B
2 cm
2 cm
2 cm
Silicone
Fle
xur
e surface
Tension gashes
Flexural
moat
Terraces
Density
stratification
C
Sand & plaster mix
Initial topo
gr
aph
y
Initial silicone surface
Extension
fracture
Figure 8. 3D oblique view, with a vertical cross section through the cone center, of the sand cone volumes reconstructed from X-ray scan after 72 h of deformation into a 1.1 cm thick silicone layer for experiments with cohesionless (A) and low cohesion (B) sand. (C) Interpreta-tion of a vertical cross secInterpreta-tion through the low cohesion cone model with indicaInterpreta-tion of key features described in the text.
μCT imaging of volcano gravitational deformation
A
3 cm
B
3 cm
C
D
E
F
G
H
II
J
2 cm
2 cm
2 cm
2 cm
g h i j 7.2 mm 7.2 mm 14 mm14 mm 6.8 mm6.8 mm 12.7 mm12.7 mmFigure 9. Shaded relief of the Digital Elevation Model extracted from 3D reconstruction of elongated ridge models deform-ing for 72 h over a 4.5 (A) and 11 (B) mm thick silicone layer; (C–F) Horizontal cross sections at mid-fl ank (C, E) and at basal level (D, F) of the spreading (C–D) and the sagging ridges (E–F); (G–J) Vertical cross sections perpendicular to the elongation axis for the spreading (G–H) and the sagging ridge (I–J). (H) and (I) are sections through the central part of the cone; (G) and (J) are sections at one extremity of the elongation axis.
zones of extension, ~1 cm wide at the surface and narrowing with depth, defi ned by their lower X-ray attenuation, are observed adjacent to the moat, where the surface becomes sud-denly fl atter, but also close to the setup edge probably due to border effects (Fig. 9B, E, I, J). Figure 9F also illustrates that the lower cone fl anks are characterized by lower material density than the material in the central axis of the cone. Just above the sand-silicone contact level, a narrow structure of low X-ray attenu-ation, parallel to the cone long axis, can be observed at the vertical of the moat’s deepest point. This structure is interpreted as an exten-sional structure associated with low amplitude silicone upwelling. Parallel to the long axis, the vertical sagging of the fl anks is more gradual and the moat is less deep. No signifi cant varia-tion in material density along the long axis can be observed.
DISCUSSION
3D Gravitational Deformation of Volcanic Cones
Detailed comparison of the experimental results presented here with specifi c natural vol-canoes is outside the scope of this preliminary study. Field evidence for gravitational defor-mation of natural volcanoes has been provided in numerous previous studies (e.g., Borgia et al., 1992; Borgia, 1994; Merle and Borgia, 1996; van Wyk de Vries et al., 2001; Borgia and van Wyk de Vries, 2003; Morgan and McGovern, 2005; Münn et al., 2006; Walter et al., 2006; Delcamp et al., 2008; Le Corvec and Walter, 2009). µCT imaging of the presented analogue experiments, however, provides new insights into the gravitational deformation of volcanic constructs.
In the case of a spreading cone, key new infor-mation is the vertical and horizontal variations of cone density and especially the formation of a central brecciated zone of sub-polygonal shape (Fig. 10). This zone is delimited by the prolongation of the individual graben-bounding faults. Within this central zone, the central part is characterized by undisturbed blocks sepa-rated by clear fractures, whereas the outer part of the polygon is more heavily fractured. This variation in fracture density cannot be high-lighted from analysis of the model topography nor preserved in physical sections of the model. It is possible to preserve the fracture pattern at depth through the introduction of several thin plaster layers within the cone structure, excavating the cone until reaching each suc-cessive layer (Lebas, 2009). Observations of larger spreading cones using such a technique
polygonal fracture zone polygonal fracture zone
B
A
graben graben graben graben graben grabenSliding wedge Sliding wedge
Sliding wedge Sliding wedge
Sliding wedge Sliding wedge
passive zone
passive zone passive zone
passive zone passive zone
passive zone graben graben graben graben graben graben Sliding wedge passive zone
passive zone passive zone
passive zone passive zone
passive zone Sliding wedge Sliding wedge Sliding wedge Sliding wedge Sliding wedge Thrust f ault Anticline Syncline Relay ramps Strike-sli p fault
Figure 10. Idealized sketches of a spreading cone with (A) folds or thrusts, related to graben-bounding faults by relay ramps, accommodating cone spreading at the cone base or (B) strike-slip faults prolonging graben-bounding faults at the cone base and joining each other to delineate diamond-shaped sliding-wedges.
μCT imaging of volcano gravitational deformation
provided a similar fracture network as docu-mented in 3D by µCT (Fig. 11). However, direct excavation is diffi cult, intrusive, destroys struc-tures, and does not give a clear 3D picture. The scans here provide hitherto inaccessible detail of the fractured core of the cone. This weaker zone, created by the complex interactions of individ-ual graben-bounding structures and the vertical sinking of the volcano summit, will affect how magma intrudes into a volcanic cone, control the structure of hydrothermal systems and ore deposition, and infl uence the destabilization of the central portion of the edifi ce.
Delcamp et al. (2008) have shown that graben-bounding structures are transtensional strike-slip faults and not pure normal faults. µCT imaging does not enable the detail con-straint of the motion of structures as normal and strike-slip faulting both result in similar material decompaction (Colletta et al., 1991; Ueta et al., 2000). It is, however, worth not-ing that movements along graben-boundnot-ing structures are accommodated at the base by fold or thrust structures (Fig. 10A), and that the two systems of faults are related to each other through relay ramps that enable transfer from transtentional to compressive movement. Delcamp et al. (2008) observed that graben-bounding faults can prolong into the surround-ing base as sub-radial transtensional strike-slip faults (Fig. 10B). This situation is characteris-tic for high values of the ratio of brittle to duc-tile layers’ thickness and for a gradual slope decrease at the cone base. Comparing ideal-ized spreading models of Figures 10A and B, it can be seen that a continuum exists between these two cases. Relay ramps transform into a compressive structure when they cross at high angles, whereas when they cross each other at a smaller angle, they delineate diamond-shaped sliding wedges.
The sliding wedges that formed between grabens in both models are not deformed and not affected by fracturing, as highlighted by the homogeneous high density in µCT scans. These more preserved zones will be the volumes that will resist erosion at natural volcanoes and will thus form the part of the volcano that will strike out after prolonged erosion periods. Such topographic wedges will provide good evidence of spreading after signifi cant erosion. This is the case, for example, of many eroded strato- volcanoes in the Andes or Kamtchatka (see fi g-ure 15 in Delcamp et al., 2008).
In the case of sagging cones, the high resolution DEM of the model enables the identifi -cation of subtle terrace features. Such struc-tures have been observed to occur at large natural volcanoes undergoing basal fl exure on Earth and Mars (Borgia et al., 1992; Merle
and Borgia, 1996; Byrne et al., 2009). These terraces do appear to be related to signifi cant deformation at depth. The density stratifi ca-tion observed in the central cone zone (Fig. 8) is probably to be attributed to grain size seg-regation through avalanching during cone emplacement and formation of thin, plaster rich layers in the central part of the cone. The decreased X-ray attenuation on the lower fl anks of sagging cones is probably due to grain rearrangement associated with the terrace-like thrusts seen on the surface. The scans show that these structures are formed without clear localization along individual structures below the surface. The decompaction is somewhat counter-intuitive as it is in association with an expected contraction in this area (van Wyk de Vries and Matela, 1998), but Colletta et al. (1991) showed that lower X-ray attenua-tion also characterizes compressive structures. Here, radial and concentric contraction must be accommodated by vertical dilation that appears at the surface as terraces.
µCT provides an image of the model sur-face as well as the cone base after fl exure. This is impossible to do through model section, as the silicone moves rapidly. Comparison of the fl exure surface and the surface topography with the original model conditions enables the determination of the strain in the volcano. Extension can, for example, be inferred at the lower boundary of the brittle crust for sagging cones, as illustrated by silicone upwelling and structures of lower X-ray attenuation (Fig. 7C), whereas contraction takes place on the cone’s lower fl anks on the terraces.
Tension fractures and extensional fractures are exceptionally well imaged by the µCT tech-nique. These features are usually not preserved when physically cutting the model. Exten-sion structures are imaged as tenExten-sion gashes or narrow lower attenuation zones in the case of low cohesion material, whereas they appear as broader zones of lower attenuation for non-cohesive models (see, for example, extensional structures in the crust around sagging cones, Figures 7–8). These features are essential for indicating directions of extension.
µCT imaging has been proven to provide valuable information about volcano deforma-tion processes through detailed reconstrucdeforma-tion of the volcano volume, which enables docu-mentation of the relationships between the sur-face topography, the structures at depth, and the silicone deformation. The relationships between individual structures; the documentation of the 3D variation in bulk density; and the possibil-ity to infer strain distribution at the surface, at depth, and at the brittle-ductile boundary are other contributions of this technique.
Advantages and Limitations of µCT
First, volcano topography is documented in great detail. The method presented here has the advantage of providing a higher resolution (~80 µm) than that achieved with photogramme-try techniques (200–300 µm; Cecchi et al., 2003; Donnadieu et al., 2003), to be independent of the surface texture and to enable detailed char-acterization of deep but narrow fractures, usu-ally affected by shadow effects in stereoscopic methods. Characterization of surface topography and slope distribution is essential for comparison with natural volcanoes for which the morphol-ogy and surface structures are often the only available evidence for active deformation.
The second added value of µCT is that it enables imaging of internal structures. Horizon-tal and vertical cross-sections through the mod-els display clear variations in the X-ray attenu-ation. As discussed by Colletta et al. (1991), X-ray attenuation in granular material depends on the mineral composition of the grains, the grain size, and the bulk density or the com-paction of the material. As the material can be assumed to be initially homogeneous, variation in the observed X-ray attenuation after deforma-tion can be attributed to variadeforma-tion in compacdeforma-tion due to rearrangement of grain packing during deformation. In spreading experiments, surface traces of graben-bounding faults always cor-respond at depth with thin planar structures of lower attenuation.
Striking differences are observed between spreading of a non-cohesive and a low cohesion sand cone. In experiments with sand-plaster mix, the surface topography is dissected, tension fractures are preserved, and deformation struc-tures are sharp at the surface and thin in cross-sections. The X-ray attenuation of faults is well contrasted with the surrounding, undisturbed material. With non-cohesive sand, structures are broader and more diffuse, surface topography is fl atter, and individual structures cannot be discriminated in areas of high fault density. For pure quartz sand, the fault width corresponds to ten times the average grain size (~150 µm). This matches with previous observations (Panien et al., 2006 and references therein) and theoreti-cal modeling of shear lotheoreti-calization in granular media (Herrmann, 2001). Mixing the sand with a limited fraction of fi ne cohesive material such as plaster enables the width reduction of these shear zones by a factor of two.
The application of µCT imaging to volca-nic analogue models is also constrained by several limitations. First, the spatial resolution of the µCT scan is directly proportional to the size of the model. In order to enable identifi ca-tion of structures smaller than a millimeter, it is
A
B
C
D
Preserved
central
zone
Thrusts
En-echelon
fractures
Heavily
brecciated
zone
Grabens
Graben-
bounding
faults
Brecciated
central zone -
Diffuse fracturing
Silicone
upwelling
Initial
cone base
Grabens
Graben-
bounding
faults
8 cm
8 cm
Figure 11. (A–B) Plan view picture and interpretation of a large spreading cone, initially 5.6 cm high and 20 cm in diameter, built over a 1-cm-thick brittle crust and 0.5 cm thick silicone layer. The model surface is covered by a thin plaster layer, in order to record the forma-tion of fi ne-scaled structures. (C–D) Plan view picture and interpretaforma-tion of the same cone after removal of one third of its volume to reach an internal plaster layer recording some internal fractures. Note that no structures are preserved in the heavily disturbed central zone as the sand material has no cohesion.
μCT imaging of volcano gravitational deformation
necessary to develop analogue models of the order of 10 cm in diameter or smaller, 2–5 times smaller than the ones usually used in analogue models (Merle and Borgia, 1996; Delcamp et al., 2008). To prevent border effects, cone defor-mation must not approach the model edges too closely. This further reduces the size of the inves-tigated cone. Building homogeneous models with well-controlled crust thickness and constant cone slope becomes a challenge at such a small size.
The signal to noise ratio of µCT data depends partly on the duration of the scan but also on the thickness of the material that the X-ray has to pass through before reaching the X-ray detec-tor. In our experiment, a signifi cant contrast in average X-ray attenuation is observed between the crust zone and the cone, as the material thickness varies by a factor of two. This varia-tion in average attenuavaria-tion complicates the interpretation of vertical cross-sections in the reconstructed experiments. The lower signal to noise ratio within the crust prevents clear identi-fi cation of all the structures to their lowest level. This effect also causes higher noise in zones of topographic lows, such as the moat surrounding the sagging cones.
In contrast to medical scanners, which are using a linear detector and higher energy, µCT scans require 30–120 min to image an object; longer scan times enable a higher signal to noise ratio. During the scan, the object is slowly rotated but it needs to be fully stable relative to its rotation axis for accurate 3D reconstruction. This means that the experiments on volcano gravitational deformation could only be imaged after a prolonged deformation period (i.e., 72 h) once continued deformation became negligible. In the simulated gravitational deformation pro-cesses, there is no way to stop the process before it reaches a stable situation. The magnitude of deformation can only be reduced by increasing the thickness of the brittle crust relative to the ductile substratum (Merle and Borgia, 1996). This limitation prevents imaging the model at its initial stage and at intermediate stages dur-ing deformation, in order to document the verti-cal and horizontal surface deformation, as with photogrammetry techniques (Donnadieu et al., 2003; Delcamp et al., 2008), or to document the spatio-temporal evolution of deformation structures, as in 2D experiments (Burchardt and Walter, 2009; Le Corvec and Walter, 2009). However, this issue will not limit experiments simulating most other types of volcano-tectonic processes in which deformation (e.g., magma intrusion, magma chamber infl ation/defl ation, tectonic fault movement) can be implemented incrementally and stopped at different stages. Such experiments would then be imaged at their initial stage and at several stages of deformation,
as is done for tectonic analogue models (e.g., Schreurs et al., 2001). Layers of sands with dif-ferent X-ray attenuation, but comparable fric-tion angle and grain size, or individual denser grains can then be used as markers to document 3D movements at the surface and at depth (e.g., Wilkerson et al., 1992).
CONCLUSIONS
This study aimed at illustrating the capabili-ties offered by µCT in documenting analogue models of volcano-tectonic processes through a small set of experiments focusing on gravita-tional deformation of a volcanic construct over a ductile substratum. From the presented observa-tions, we can conclude that:
1. µCT imaging enables the reconstruction and visualization of the 3D volume of analogue models with a resolution of 80 µm.
2. Cone spreading is associated with the for-mation of fl ank grabens and the forfor-mation of anticlines at the cone base, but the scans also show heavy fracturing of the core of the volca-nic cone around a relatively preserved summit zone and upwelling of the ductile substratum in the extensional grabens.
3. A highly accurate DEM of the experiment surface can be extracted from the 3D reconstruc-tion, enabling quantitative documentation of the model topography and the slope distribution.
4. Virtual cross-sections through the recon-structed model volume with vertical and hori-zontal orientations make it possible to document variations in X-ray attenuation associated with formation of fractures and faults and with the transition from sand to silicone material.
5. In comparison with non-cohesive sand, experiments with low cohesion sand display sharper fault structures, preservation of shallow fractures, and formation of fractured blocks in the cone center.
6. Documentation of analogue models through µCT is constrained by the size of the experiment, the variation of signal to noise ratio with the depth of material crossed by X-rays, and the need to have stable models during the duration of the scan.
Despite the highlighted limitations, µCT has the potential to document the full 3D complex-ity of analogue models essential for investiga-tion of other volcano-tectonic processes, such as caldera formation, magma emplacement, or volcano interactions with tectonic structures. This technique will prove to be especially pow-erful for processes whose deformation can be simulated incrementally and repetitively imaged by µCT. Documenting the 3D complexity of deformation structures offers the potential to more closely relate analogue observations with
structures accommodating deformation at natu-ral volcanoes as documented by geophysical or geological evidence.
ACKNOWLEDGMENTS
M.K., V.C., and K.F. are supported by the Research Foundation–Flanders (Fonds voor Wetenschappelijk Onderzoek–Vlaanderen).
REFERENCES CITED
Acocella, V., 2005, Modes of sector collapse of volca-nic cones: Insights from analogue experiments: Journal of Geophysical Research, v. 110, doi: 10.1029/2004JB003166.
Andrade, S.D., and van Wyk de Vries, B., 2010, Structural analysis of the early stages of catastrophic stratovol-cano fl ank-collapse using analogue models: Bulletin of Volcanology, doi: 10.1007/s00445-010-0363-x. Borgia, A., 1994, Dynamic Basis of Volcanic Spreading:
Journal of Geophysical Research. Solid Earth, v. 99, p. 17791–17804, doi: 10.1029/94JB00578.
Borgia, A., and van Wyk de Vries, B., 2003, The volcano-tectonic evolution of Concepcion, Nicaragua: Bul-letin of Volcanology, v. 65, p. 248–266, doi: 10.1007/ s00445-002-0256-8.
Borgia, A., Ferrari, L., and Pasquare, G., 1992, Importance of gravitational spreading in the tectonic and volcanic evolution of Mount Etna: Nature, v. 357, p. 231–235, doi: 10.1038/357231a0.
Borgia, A., Delaney, P.T., and Denlinger, R.P., 2000, Spread-ing volcanoes: Annual Review of Earth and Planetary Sciences, v. 28, p. 539–570, doi: 10.1146/annurev .earth.28.1.539.
Burchardt, S., and Walter, T.R., 2009, Propagation, link-age, and interaction of caldera ring-faults: Comparison between analogue experiments and caldera collapse at Miyakejima, Japan, in 2000: Bulletin of Volcanology, doi: 10.1007/s00445-009-0321-7.
Byrne, P.K., van Wyk de Vries, B., Murray, J.B., and Troll, V.R., 2009, The geometry of volcano fl ank terraces on Mars: Earth and Planetary Science Letters, v. 281, p. 1–13.
Cecchi, E., van Wyk de Vries, B., Lavest, J.-M., Harris, A.J.L., and Davies, M., 2003, N-view reconstruction and deformation measurement in volcanology: Jour-nal of Volcanology and Geothermal Research, v. 123, p. 181–201, doi: 10.1016/S0377-0273(03)00035-0. Colletta, B., Letouzey, J., Pinedo, R., Ballard, J.-F., and
Balé, P., 1991, Computerized X-ray tomography analysis of sandbox models: Examples of thin-skinned thrust systems: Geology, v. 19, p. 1063–1067, doi: 10.1130/0091-7613(1991)019<1063:CXRTAO>2.3 .CO;2.
Delcamp, A., de Vries, B.V., and James, M.R., 2008, The infl uence of edifi ce slope and substrata on volcano spreading: Journal of Volcanology and Geothermal Research, v. 177, p. 925–943, doi: 10.1016/j.jvolgeores .2008.07.014.
Donnadieu, F., and Merle, O., 1998, Experiments on the identa-tion process during cryptodome intrusions: New insights into Mount St. Helens deformation: Geology, v. 26, p. 79–82, doi: 10.1130/0091-7613(1998)026<0079: EOTIPD>2.3.CO;2.
Donnadieu, F., Kelfoun, K., van Wyk de Vries, B., Cecchi, E., and Merle, O., 2003, Digital photogrammetry as a tool in analogue modelling: applications to volcano instability: Journal of Volcanology and Geothermal Research, v. 123, p. 161–180, doi: 10.1016/S0377 -0273(03)00034-9.
Herrmann, H.J., 2001, Structures in deformed granular pack-ings: Granular Matter, v. 3, p. 15–18, doi: 10.1007/ s100350000059.
Kervyn, M., Ernst, G.G.J., van Wyk de Vries, B., Mathieu, L., and Jacobs, P., 2009, Volcano load control on dyke propagation and vent spatial distribution: Insights from analogue modelling: Journal of Geophysical Research, v. 114, p. B03401, doi: 10.1029/2008JB005653.
Lagmay, A.M.F., van Wyk de Vries, B., Kerle, N., and Pyle, D.M., 2000, Volcano instability induced by strike-slip faulting: Bulletin of Volcanology, v. 62, p. 331–346, doi: 10.1007/s004450000103.
Le Corvec, N., and Walter, T.R., 2009, Volcano spreading and fault interaction infl uenced by rift zone intrusions: Insights from analogue experiments analyzed with digital image correlation technique: Journal of Volca-nology and Geothermal Research, v. 183, p. 170–182, doi: 10.1016/j.jvolgeores.2009.02.006.
Lebas, E., 2009, Genèse et nature de la fracturation des édi-fi ces volcaniques: De l’échelle du volcan à l’échelle de la coulée (in French): Clermont Ferrand, Université Blaise Pascal.
Lohrmann, J., Kukowski, N., Adam, J., and Oncken, O., 2003, The impact of analogue material properties on the geometry, kinematics and dynamics of convergent sand wedges2: Journal of Structural Geology, v. 25,
p. 1691–1711, doi: 10.1016/S0191-8141(03)00005-1. Mandl, G., 1988, Mechanics of Tectonic Faulting:
Amster-dam, Elsevier, 407 p.
Marti, J., Ablay, G.J., Redshaw, L.T., and Sparks, R.S.J., 1994, Experimental studies of collapse calderas: Jour-nal of the Geological Society, v. 151, p. 919–929, doi: 10.1144/gsjgs.151.6.0919.
Masschaele, B.C., Cnudde, V., Dierick, M., Jacobs, P., Van Hoorebeke, L., and Vlassenbroeck, J., 2007, UGCT: New X-ray radiography and tomography facility: Nuclear Instruments & Methods in Physics Research. Section A, Accelerators, Spectrometers, Detectors and Associated Equipment, v. 580, p. 266–269, doi: 10.1016/j.nima.2007.05.099.
Mathieu, L., van Wyk de Vries, B., Holohan, E.P., and Troll, V.R., 2008, Dykes, cups, saucer and sills: Analogue experiments on magma intrusion into brittle rocks: Earth and Planetary Science Letters, v. 271, p. 1–13. Merle, O., and Borgia, A., 1996, Scaled experiments of
volcanic spreading: Journal of Geophysical Research, v. 101, p. 13805–13817, doi: 10.1029/95JB03736. Merle, O., Vidal, N., and de Vries, B.V., 2001, Experiments
on vertical basement fault reactivation below
volca-noes: Journal of Geophysical Research, Solid Earth, v. 106, p. 2153–2162, doi: 10.1029/2000JB900352. Morgan, J.K., and McGovern, P.J., 2005, Discrete element
simulations of gravitational volcanic deformation: 1. Deformation structures and geometries: Journal of Geophysical Research, Solid Earth, v. 110, doi: 10.1029/2004JB003252.
Münn, S., Walter, T.R., and Klügel, A., 2006, Gravitational spreading controls rift zones and fl ank instability on El Hierro, Canary Islands: Geological Magazine, v. 143, p. 257–268, doi: 10.1017/S0016756806002019. Panien, M., Schreurs, G., and Pfi ffner, A., 2006,
Mechani-cal behaviour of granular materials used in analogue modeling: Insights from grain charachterisation, ring-shear-tests and analogue experiments: Journal of Struc-tural Geology, v. 28, p. 1710–1724, doi: 10.1016/j.jsg .2006.05.004.
Roche, O., Druitt, T.H., and Merle, O., 2000, Experimen-tal study of caldera formation: Journal of Geophysi-cal Research. Solid Earth, v. 105, p. 395–416, doi: 10.1029/1999JB900298.
Schreurs, G., 1994, Experiments on strike-slip faulting and block rotation: Geology, v. 22, p. 567–570, doi: 10.1130/0091-7613(1994)022<0567:EOSSFA>2.3 .CO;2.
Schreurs, G., Hänni, R., and Vock, P., 2001, Four-dimen-sional analysis of analogue models: experiments on transfer zones in fold and thrust belts, in Koyi, H.A., and Mancktelow, N.S., eds., Tectonic Modelling: A volume in honor of Hans Ramberg: Boulder, Colo-rado, Geological Society of America Memoir 193, p. 179–190.
Schreurs, G., Hänni, R., Panien, M., and Vock, P., 2003, Analysis of analogue models by helical X-ray com-puted tomography, in Mees, F., Swennen, R., Van Geet, M., and Jacobs, P., eds., Applications of X-ray com-puted tomography in the Geosciences, Volume 215: Special Publications: London, Geological Society, p. 213–223.
Shea, T., and de Vries, B.V., 2008, Structural analysis and analogue modeling of the kinematics and dynamics of
rockslide avalanches: Geosphere, v. 4, p. 657–686, doi: 10.1130/GES00131.1.
Ueta, K., Tani, K., and Kato, T., 2000, Computerized X-ray tomography analysis of three-dimensional fault geom-etries in basement-induced wrench faulting: Engineer-ing Geology, v. 56, p. 197–210, doi: 10.1016/S0013 -7952(99)00143-X.
van Bemmelen, R.W., 1949, The geology of Indonesia: Gen-eral geology of Indonesia and adjacent archipelagos: The Hague, Netherlands, Gov. Print. Off.
van Wyk de Vries, B., and Matela, R., 1998, Styles of volcano-induced deformation: Numerical models of substratum fl exure, spreading and extrusion: Journal of Volcanology and Geothermal Research, v. 81, p. 1–18, doi: 10.1016/S0377-0273(97)00076-0.
van Wyk de Vries, B., Self, S., Francis, P.W., and Keszthe-lyi, L., 2001, A gravitational spreading origin for the Socompa debris avalanche: Journal of Volcanology and Geothermal Research, v. 105, p. 225–247, doi: 10.1016/S0377-0273(00)00252-3.
Walter, T., 2003, Buttressing and fractional spreading of Tenerife, an experimental approach on the formation of rift zones: Geophysical Research Letters, v. 30, p. doi:10.1029/2002GL016610.
Walter, T.R., Klugel, A., and Munn, S., 2006, Gravitational spreading and formation of new rift zones on over-lapping volcanoes: Terra Nova, v. 18, p. 26–33, doi: 10.1111/j.1365-3121.2005.00656.x.
Wilkerson, M.S., Marshak, S., and Bosworth, W., 1992, Computerized tomographic analysis of displacement trajectories and three-dimensional fold geometry above oblique thrust ramps: Geology, v. 20, p. 439–442, doi: 10.1130/0091-7613(1992)020<0439:CTAODT>2.3 .CO;2.
MANUSCRIPT RECEIVED 10 NOVEMBER 2010 REVISED MANUSCRIPT RECEIVED 20 APRIL 2010 MANUSCRIPT ACCEPTED 04 MAY 2010